Top Funds’ Activity in Q2 2019

Vincent Bielski, Melissa Karsh, Brandon Kochkodin and Paul Murray of Bloomberg report the world’s biggest hedge funds piled into Uber and sold Microsoft, among other big moves during the second quarter:

The world’s biggest hedge funds anointed a clear favorite: Uber. They piled into the ride-hailing company, which had its initial public offering in May. Three Tiger Cubs—alumni of Julian Robertson’s Tiger Management—led the charge on a $1.4 billion wager. As they favored the shiny new thing, plenty of others cast off an old tech giant, Microsoft, turning it into the most disliked stock.

Winners. Losers. Buyers. Sellers. By Aug. 14, fund managers disclosed in regulatory filings the multi-million dollar moves they made in the U.S. stock market in the second quarter. The quarterly rite allows investors to gain some insight in an otherwise opaque arena dominated by some of the richest managers—from Bill Ackman to David Einhorn.

Here we parse the flood of data that was released to show you where the smart money placed wagers—and how those bets look, in hindsight.

The chart below gives you the big picture. It plots about 250 U.S. stocks, combining in each dot two measures: the change in the value of hedge fund positions and the performance of the equity in the first 45 days of the third quarter. Scroll over the dot for Humana, a popular stock with hedge funds like Glenview Capital and Maverick Capital in the second quarter. Shares of the health insurer surged after it boosted its outlook in July. Alcohol giant Constellation Brands, which sells beer and tequila from Mexico in the U.S., has had a tougher time. Hedge funds fled the stock as the Trump administration made trade and immigration threats against its southern neighbor.

Hedge funds kept their years-long infatuation for almost all of the FAANGs—Netflix, Amazon, Facebook and Google parent Alphabet. They jumped into the companies, as the chart below shows, with D1 Capital taking a new stake in Amazon and adding to its holdings in Netflix and Facebook. Meanwhile, funds ditched Apple amid slowing iPhone sales, and also Microsoft, just as the software giant deepens its partnership with Samsung. Big quant names like D.E. Shaw and AQR Capital trimmed their positions in the iPhone maker.

IPOs in the U.S. surged in the second quarter, raising the most capital in years, after a slow start to 2019. CrowdStrike, a software firm, has been one of the top performing offerings. Big hedge funds like Tiger Global, Element Capital and Melvin Capital got a piece of the CrowdStrike action. Chewy, an online pet store, was another favorite. Its stock got an early pop fueled by the firm’s robust growth. The shares have since settled down.

Hedge funds often move in clusters, crowding into or clearing out of the same stock at about the same time. The chart below displays the most and least popular stocks by the number of firms that bought or sold them in the second quarter. Disney was among the winners of the beauty contest, gaining fans as it makes an aggressive push into streaming video. Marshall Wace added to its stake and Suvretta Capital took a new position in the quarter. Chevron, which lost a takeover battle for an oil driller in May, was less appealing. More hedge funds sold Chevron than bought it.

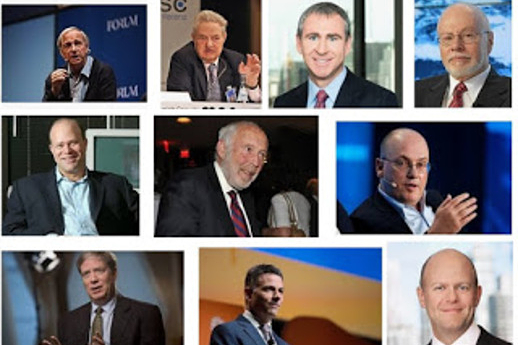
The hedge fund industry’s boldfaced names—from Bill Ackman of Pershing Square to Andreas Halvorsen of Viking Global—made a splash in the quarter.

Big Names, Big Bets

Pershing Square took a new stake in Berkshire Hathaway, valued at about $749 million as of June 30. Berkshire’s shares may have taken a hit on weak earnings and a swoon in bank stocks as Warren Buffett builds up the firm’s financial holdings.

After ditching its Boeing stake in the first quarter, Viking Global built a new position in the jet manufacturer this go-around, worth about $1 billion at the end of June. 737 Max concerns continue to weigh on Boeing shares.

Appaloosa cut its Allergan stake by more than 50%, valuing the holding at about $217 million as of June. Shares of the drugmaker have been down slightly after an initial jump once AbbVie agreed to acquire it in June.

Elliott exited its $1.4 billion position in Sempra Energy after reaching an agreement in October to add two new directors to the utility’s board.

You have to go to the Bloomberg article here to have access to the interactive charts.

The article is interesting but I must be honest, I couldn’t care less what big hedge funds or Warren Buffett or any of the big name gurus were buying and selling last quarter.

Many hedge funds are underperforming and in these volatile markets, a lot of them are going to get annihilated if market volatility persists.

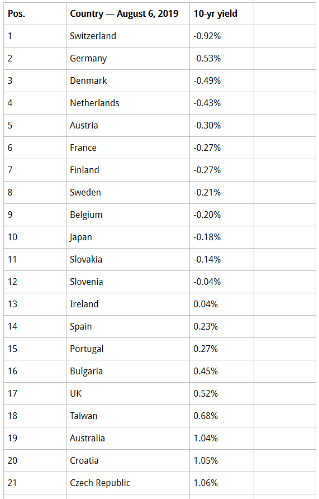
What concerns me these days is market volatility, geopolitical risks, the inverted yield curve, negative interest rates all over the world exacerbating the massive rally in US Treasurys, and most of all capital preservation.

Make sure you go back to read my last three market comments:

The most important thing right now is trying to figure out the market environment and how to navigate all the risks ahead.

For example, what if China devalues the yuan considerably? That will basically export deflation throughout the world and clobber risk assets.

When macro risks dominate, and they always do, beta risks are high so even if you’re a great stock picker, you can easily get whacked hard in these volatile markets.

The herding behavior top hedge funds are exhibiting isn’t an accident. They’re all looking for the three “Ls” of investing in these volatile markets: Liquidity, Liquidity, and Liquidity.

That’s essentially why FAANG stocks are so popular among top hedge funds, they can get in and out of them very easily.

Have a look at the 5-year weekly chart of the S&P Technology ETF (XLK), it’s been volatile lately but the uptrend is still intact:

If it drops below 70 and 60, then I’d start to worry if I’m loaded up with FAANG stocks.

Here are two other nice charts to keep in mind, the 5-year weekly chart of US long bonds (TLT) and the 5-year weekly chart S&P Gold shares (GLD) which have both gone parabolic as fear sets in that negative rates will hit the US:

The big money these days isn’t in picking stocks, it’s in making the right macro calls and sticking with them.

In fact, the hedge funds posting the best performance recently were CTAs who were on the right side of the bond trade as yields plunged all over the world.

But everyone is so fixated on what Warren Buffett, Dan Loeb and other big name gurus are buying and selling in the stock market, it’s quite silly in these volatile markets.

Those of you who love trading stocks, I can tell you Fidelity made killing on Roku (ROKU) and got destroyed on Nektar Therapeutics (NKTR).

I can tell you Jim Simons’ Renaissance Technologies made a killing on Chipotle Mexican Grill (CMG) and Starbucks (SBUX) as they ran up to make record highs this quarter (I was telling people to buy Starbucks when it dipped below $50 after that scandal broke out):

I can also tell you generic drug manufacturers and other healthcare stocks which are part of that massive opioid lawsuit got destroyed but are bouncing a bit today as markets end the week on a high note (be careful here but worth tracking them):

I can also tell you the selloff in shares of Cisco (CSCO), Dropbox (DBX), and Revolve Group (RVLV) have all got me interested but I’m not nibbling here:

There are a lot of stocks that got clobbered and some keep making new highs, but I remain very cautious here as I remain convinced macro and geopolitical risks will dominate the second half of the year.

A lot of chatter lately of the Fed cutting rates 50 basis points in September. If it does, stocks will sell off hard and gold shares will make even higher highs.

On that cheery note, have fun looking at the second quarter activity of top funds listed below. The links take you straight to their top holdings and then click on the column head “Change (%)” to see where they increased and decreased their holdings (you have to click once or twice to see).

Top multi-strategy and event driven hedge funds

As the name implies, these hedge funds invest across a wide variety of hedge fund strategies like L/S Equity, L/S credit, global macro, convertible arbitrage, risk arbitrage, volatility arbitrage, merger arbitrage, distressed debt and statistical pair trading. Below are links to the holdings of some top multi-strategy hedge funds I track closely:

1) Appaloosa LP

2) Citadel Advisors

3) Balyasny Asset Management

4) Point72 Asset Management (Steve Cohen)

5) Peak6 Investments

6) Kingdon Capital Management

7) Millennium Management

8) Farallon Capital Management

9) HBK Investments

10) Highbridge Capital Management

11) Highland Capital Management

12) Hudson Bay Capital Management

13) Pentwater Capital Management

14) Och-Ziff Capital Management

15) Carlson Capital Management

16) Magnetar Capital

17) Whitebox Advisors

18) QVT Financial

19) Paloma Partners

20) Weiss Multi-Strategy Advisors

21) York Capital Management

Top Global Macro Hedge Funds and Family Offices

These hedge funds gained notoriety because of George Soros, arguably the best and most famous hedge fund manager. Global macros typically invest across fixed income, currency, commodity and equity markets.

George Soros, Carl Icahn, Stanley Druckenmiller, Julian Robertson have converted their hedge funds into family offices to manage their own money.

1) Soros Fund Management

2) Icahn Associates

3) Duquesne Family Office (Stanley Druckenmiller)

4) Bridgewater Associates

5) Pointstate Capital Partners

6) Caxton Associates (Bruce Kovner)

7) Tudor Investment Corporation (Paul Tudor Jones)

8) Tiger Management (Julian Robertson)

9) Discovery Capital Management (Rob Citrone)

10 Moore Capital Management

11) Element Capital

12) Bill and Melinda Gates Foundation Trust (Michael Larson, the man behind Gates)

Top Quant and Market Neutral Hedge Funds

These funds use sophisticated mathematical algorithms to make their returns, typically using high-frequency models so they churn their portfolios often. A few of them have outstanding long-term track records and many believe quants are taking over the world. They typically only hire PhDs in mathematics, physics and computer science to develop their algorithms. Market neutral funds will engage in pair trading to remove market beta.

1) Alyeska Investment Group

2) Renaissance Technologies

3) DE Shaw & Co.

4) Two Sigma Investments

5) Cubist Systematic Strategies (a quant division of Point72)

6) Numeric Investors now part of Man Group

7) Analytic Investors

8) AQR Capital Management

9) SABA Capital Management

10) Quantitative Investment Management

11) Oxford Asset Management

12) PDT Partners

13) Angelo Gordon

14) Quantitative Systematic Strategies

15) Quantitative Investment Management

16) Bayesian Capital Management

17) Quadrature Capital

Top Deep Value, Activist, Event Driven and Distressed Debt Funds

These are among the top long-only funds that everyone tracks. They include funds run by legendary investors like Warren Buffet, Seth Klarman, Ron Baron and Ken Fisher. Activist investors like to make investments in companies where management lacks the proper incentives to maximize shareholder value. They differ from traditional L/S hedge funds by having a more concentrated portfolio. Distressed debt funds typically invest in debt of a company but sometimes take equity positions.

1) Abrams Capital Management (the one-man wealth machine)

2) Berkshire Hathaway

3) Baron Partners Fund (click here to view other Baron funds)

4) BHR Capital

5) Fisher Asset Management

6) Baupost Group

7) Fairfax Financial Holdings

8) Fairholme Capital

9) Trian Fund Management

10) Gotham Asset Management

11) Fir Tree Partners

12) Elliott Associates

13) Jana Partners

14) Gabelli Funds

15) Highfields Capital Management

16) Eminence Capital

17) Pershing Square Capital Management

18) New Mountain Vantage Advisers

19) Atlantic Investment Management

20) Polaris Capital Management

21) Third Point

22) Marcato Capital Management

23) Glenview Capital Management

24) Apollo Management

25) Avenue Capital

26) Armistice Capital

27) Blue Harbor Group

28) Brigade Capital Management

29) Caspian Capital

30) Kerrisdale Advisers

31) Knighthead Capital Management

32) Relational Investors

33) Roystone Capital Management

34) Scopia Capital Management

35) Schneider Capital Management

36) ValueAct Capital

37) Vulcan Value Partners

38) Okumus Fund Management

39) Eagle Capital Management

40) Sasco Capital

41) Lyrical Asset Management

42) Gabelli Funds

43) Brave Warrior Advisors

44) Matrix Asset Advisors

45) Jet Capital

46) Conatus Capital Management

47) Starboard Value

48) Pzena Investment Management

Top Long/Short Hedge Funds

These hedge funds go long shares they think will rise in value and short those they think will fall. Along with global macro funds, they command the bulk of hedge fund assets. There are many L/S funds but here is a small sample of some well-known funds.

1) Adage Capital Management

2) Viking Global Investors

3) Greenlight Capital

4) Maverick Capital

5) Pointstate Capital Partners

6) Marathon Asset Management

7) Tiger Global Management (Chase Coleman)

8) Coatue Management

9) D1 Capital Partners

10) Artis Capital Management

11) Fox Point Capital Management

12) Jabre Capital Partners

13) Lone Pine Capital

14) Paulson & Co.

15) Bronson Point Management

16) Hoplite Capital Management

17) LSV Asset Management

18) Hussman Strategic Advisors

19) Cantillon Capital Management

20) Brookside Capital Management

21) Blue Ridge Capital

22) Iridian Asset Management

23) Clough Capital Partners

24) GLG Partners LP

25) Cadence Capital Management

26) Honeycomb Asset Management

27) New Mountain Vantage

28) Penserra Capital Management

29) Eminence Capital

30) Steadfast Capital Management

31) Brookside Capital Management

32) PAR Capital Capital Management

33) Gilder, Gagnon, Howe & Co

34) Brahman Capital

35) Bridger Management

36) Kensico Capital Management

37) Kynikos Associates

38) Soroban Capital Partners

39) Passport Capital

40) Pennant Capital Management

41) Mason Capital Management

42) Tide Point Capital Management

43) Sirios Capital Management

44) Hayman Capital Management

45) Highside Capital Management

46) Tremblant Capital Group

47) Decade Capital Management

48) Suvretta Capital Management

49) Bloom Tree Partners

50) Cadian Capital Management

51) Matrix Capital Management

52) Senvest Partners

53) Falcon Edge Capital Management

54) Park West Asset Management

55) Melvin Capital Partners

56) Owl Creek Asset Management

57) Portolan Capital Management

58) Proxima Capital Management

59) Tourbillon Capital Partners

60) Impala Asset Management

61) Valinor Management

62) Marshall Wace

63) Light Street Capital Management

64) Rock Springs Capital Management

65) Rubric Capital Management

66) Whale Rock Capital

67) York Capital Management

68) Zweig-Dimenna Associates

Top Sector and Specialized Funds

I like tracking activity funds that specialize in real estate, biotech, healthcare, retail and other sectors like mid, small and micro caps. Here are some funds worth tracking closely.

1) Avoro Capital Advisors (formerly Venbio Select Advisors)

2) Baker Brothers Advisors

3) Perceptive Advisors

4) Broadfin Capital

5) Healthcor Management

6) Orbimed Advisors

7) Deerfield Management

8) BB Biotech AG

9) Birchview Capital

10) Ghost Tree Capital

11) Sectoral Asset Management

12) Oracle Investment Management

13) Palo Alto Investors

14) Consonance Capital Management

15) Camber Capital Management

16) Redmile Group

17) RTW Investments

18) Bridger Capital Management

19) Boxer Capital

20) Bridgeway Capital Management

21) Cohen & Steers

22) Cardinal Capital Management

23) Munder Capital Management

24) Diamondhill Capital Management

25) Cortina Asset Management

26) Geneva Capital Management

27) Criterion Capital Management

28) Daruma Capital Management

29) 12 West Capital Management

30) RA Capital Management

31) Sarissa Capital Management

32) Rock Springs Capital Management

33) Senzar Asset Management

34) Southeastern Asset Management

35) Sphera Funds

36) Tang Capital Management

37) Thomson Horstmann & Bryant

38) Ecor1 Capital

39) Opaleye Management

40) NEA Management Company

41) Great Point Partners

42) Tekla Capital Management

43) Van Berkom and Associates

Mutual Funds and Asset Managers

Mutual funds and large asset managers are not hedge funds but their sheer size makes them important players. Some asset managers have excellent track records. Below, are a few funds investors track closely.

1) Fidelity

2) Blackrock Fund Advisors

3) Wellington Management

4) AQR Capital Management

5) Sands Capital Management

6) Brookfield Asset Management

7) Dodge & Cox

8) Eaton Vance Management

9) Grantham, Mayo, Van Otterloo & Co.

10) Geode Capital Management

11) Goldman Sachs Group

12) JP Morgan Chase & Co

13) Morgan Stanley

14) Manulife Asset Management

15) RCM Capital Management

16) UBS Asset Management

17) Barclays Global Investor

18) Epoch Investment Partners

19) Thornburg Investment Management

20) Legg Mason (Bill Miller)

21) Kornitzer Capital Management

22) Batterymarch Financial Management

23) Tocqueville Asset Management

24) Neuberger Berman

25) Winslow Capital Management

26) Herndon Capital Management

27) Artisan Partners

28) Great West Life Insurance Management

29) Lazard Asset Management

30) Janus Capital Management

31) Franklin Resources

32) Capital Research Global Investors

33) T. Rowe Price

34) First Eagle Investment Management

35) Frontier Capital Management

36) Akre Capital Management

37) Brandywine Global

38) Brown Capital Management

39) Victory Capital Management

Canadian Asset Managers

Here are a few Canadian funds I track closely:

1) Addenda Capital

2) Letko, Brosseau and Associates

3) Fiera Capital Corporation

4) West Face Capital

5) Hexavest

6) 1832 Asset Management

7) Jarislowsky, Fraser

8) Connor, Clark & Lunn Investment Management

9) TD Asset Management

10) CIBC Asset Management

11) Beutel, Goodman & Co

12) Greystone Managed Investments

13) Mackenzie Financial Corporation

14) Great West Life Assurance Co

15) Guardian Capital

16) Scotia Capital

17) AGF Investments

18) Montrusco Bolton

19) CI Investments

20) Venator Capital Management

21) Van Berkom and Associates

22) Formula Growth

23) Hillsdale Investment Management

Pension Funds, Endowment Funds, and Sovereign Wealth Funds

Last but not least, I the track activity of some pension funds, endowment and sovereign wealth funds. I like to focus on funds that invest in top hedge funds and have internal alpha managers. Below, a sample of pension and endowment funds I track closely:

1) Alberta Investment Management Corporation (AIMco)

2) Ontario Teachers’ Pension Plan

3) Canada Pension Plan Investment Board

4) Caisse de dépôt et placement du Québec

5) OMERS Administration Corp.

6) British Columbia Investment Management Corporation (BCI)

7) Public Sector Pension Investment Board (PSP Investments)

8) PGGM Investments

9) APG All Pensions Group

10) California Public Employees Retirement System (CalPERS)

11) California State Teachers Retirement System (CalSTRS)

12) New York State Common Fund

13) New York State Teachers Retirement System

14) State Board of Administration of Florida Retirement System

15) State of Wisconsin Investment Board

16) State of New Jersey Common Pension Fund

17) Public Employees Retirement System of Ohio

18) STRS Ohio

19) Teacher Retirement System of Texas

20) Virginia Retirement Systems

21) TIAA CREF investment Management

22) Harvard Management Co.

23) Norges Bank

24) Nordea Investment Management

25) Korea Investment Corp.

26) Singapore Temasek Holdings

27) Yale Endowment Fund

Below, Bloomberg’s Sonali Basak reports on Hedge Funds releasing second quarter 13F filings on “Bloomberg Daybreak: Americas.”

Second, Bianco Research’s James Bianco believes Fed Chairman’s Jerome Powell’s comments at Jackson Hole will determine what happens next in the markets.

Jim thinks the Fed should open the door to a 50 basis point rate cut but I believe if they do, stocks will sell off hard after the initial knee-jerk reaction.

Lastly, an interesting conversation where Teddy Vallee, CIO of Pervalle Global, explains to Raoul Pal why he thinks leading indicators are pointing to a global recession (filmed on July 9, 2019).


Equities Contributor: Leo Kolivakis

Source: Equities News

BioMark’s Liquid Biopsy Scientific Paper To Be Featured as Cover on Cancers’ Upcoming Issue

Vancouver, British Columbia – (August 19th, 2019) – BioMark Diagnostics Inc. (“BioMark”) is pleased to announce that the article “Liquid Biopsy in
Lung Cancer Screening: The Contribution of Metabolomics. Results of A Pilot Study” will be on the cover of Cancers.

Rashid Ahmed, President and CEO, says, “This latest paper that was published a few days ago
paper has been selected by the editors of the journal as the cover of the forthcoming issue. The
issue cover will be displayed on the issue page:
https://www.mdpi.com/2072-6694/11, and
promoted in the issue released notification which will be sent to the journal subscribers
together with the table of contents. I would like to thank and acknowledge the team for their
excellent contribution that resulted in recognition of this manuscript.”

The paper is available through : https://www.mdpi.com/2072-6694/11/8/1069 and or at
https://www.ncbi.nlm.nih.gov/pubmed/31362354

About Cancers

Cancers (ISSN 2072-6694) is an international, peer-reviewed open access journal on oncology. It publishes article types including Research Papers, Reviews, Editorials, Communications, etc. Our aim is to encourage scientists to publish their experimental and theoretical results in as much detail as possible. The full experimental details must be provided so that the results can be reproduced.

There is, in addition, a unique feature of this journal: we accept studies showing meaningful but negative results. While there are many journals that focus on cancer studies, none of them actively accepts negative results. As a result, most negative data end up not being in the public domain even if the data were meaningfully negative and the study well designed. By accepting those negative results, our journal encourages scientists to share those data so that they would not need to repeat the experiments that somebody else has already done.

Scope of Journal

We publish high-quality articles including basic, translational, and clinical studies on all tumor types (https://medlineplus.gov/cancers.html).

About BioMark Diagnostics Inc.

BioMark is developing proprietary, non-invasive, and accurate cancer diagnostic solutions which can help detect, monitor and assess treatment for cancer early and cost effectively. The technology can also be used for measuring response to treatment and potentially for serial monitoring for cancer survivors.

Further information about BioMark is available under its profile on the SEDAR website www.sedar.com and on the CSE website https://thecse.com/.

For further information on BioMark, please Contact:
Rashid Ahmed Bux
President & CEO
BioMark Diagnostics Inc.
Tel. 604-370-0779
Email: [email protected]

Forward-Looking Information:

This press release may include forward-looking information within the meaning of Canadian securities legislation, concerning the business of BioMark. Forward-looking information is based on certain key expectations and assumptions made by the management of BioMark. Although BioMark believes that the expectations and assumptions on which such forward-looking information is based are reasonable, undue reliance should not be placed on the forward-looking information because BioMark can give no assurance that they will prove to be correct. Forward-looking statements contained in this press release are made as of the date of this press release. BioMark disclaims any intent or obligation to update publicly any forward-looking information, whether as a result of new information, future events or results or otherwise, other than as required by applicable securities laws.

The CSE has not reviewed, approved or disapproved the content of this press release.

Source: TheNewswire

Negative Yields Tell A Story Of Shifting Economic Leadership

Negative yields are becoming common for many of the world’s most mature economies. The process of extending negative yields within these economies suggests that safety is more important than returns and that central banks realize that growth and increases in GDP are more important than positive returns on capital. In the current economic environment, this suggests that global capital investors are seeking out alternative solutions to adequately develop longer-term opportunities and to develop native growth prospects that don’t currently exist.

Our research team has been researching this phenomenon and how it relates to the continued “capital shift” that is taking place throughout the globe. We believe we have some answers for anyone interested in our opinions. We also believe the longer-term answers will depend on what happens over the next 5 to 7 years throughout the globe and how economic expectations shift as well as how global debt is dealt with.

We urge all of our followers to read all of
the segments of this research post about how the global central banks are
pushing the envelope and have been for many years :

Aug 14, 2019: GLOBAL CENTRAL BANKS MOVE TO KEEP THE PARTY ROLLING

Throughout our research, we referenced a
number of current articles to determine our own outcomes and expectations. Some of the articles we used as reference are
listed below.

Sources for some of our research:

Each of these resources helped to create a
bigger picture of what we believe will likely happen and how the process may
unfold. We’ll start by attempting to
understand the core elements of the negative yield perspective and how/when it
may change.

Negative yields are a result of expected economic malaise rooted in the understanding that GDP growth and economic output are relatively flat and not expected to rise. It comes down to the fact that if investors identified true growth opportunities in the major global economies, the yields for the debt instruments would reflect investor optimism (resulting in higher yields). Thus, the core element of the current global economic malaise is that the planet is transitioning from a very fragile 19th-century economic model into something new – we call it the 21st-century economic model.

This process will likely take an additional
10+ years to really begin to complete and may require many false starts as the
world begins to understand exactly what is required to make this transition. Debt, as a process of engaging in economic
activity, is something that is essential for some level of inflation, income,
and the creation of future growth. Debt
becomes a major issue when growth declines over extended periods of time
resulting in a default risk for some nations/countries. Yet, as the human population continues to
expand and global central banks continue to attempt to find the spark that will
launch the new economic growth model, debt is essential to avoid economic
contraction.

As we’ve hinted to, above, we believe the true answer is the transition away from 19th century economic structures that have resulted in massive risk factors (like unfunded pensions, unfunded state, and federal liabilities and massive global bank, investment banking and industrial level economic “black holes”) and to move towards true new world economic model. What that looks like is something we are considering at the moment and have a few ideas of.

Currently, there are a few new industries that show promise across the globe in terms of the new 21st-century economy and fledgling new industries.

_
Cannabis industry

_
Human Care Services Industry

_
Alternate housing Solutions

_
Eco-Sustainability Solutions

_
Fintech Wealth Creation Solutions

_
Social/Infrastructure Restoration Solutions

We believe the next 10+ years will become very fluid as traditional economic models are replaced with newer, more alternative, types of economic solutions that spark real growth industries and opportunities. We hope this process of transition initiates fairly quickly before any extended failure process takes place to start the reduction of capacity and resources that will be required for the rebuilding of the new 21st-century economy. Time will tell.

What this means for the rest of us is that we need to stay very focused on the fact that transitional asset shifts are very likely over the next 10+ years. The only time in history that we believe was similar to the current global economic environment was shortly after WWII. Global debts had skyrocketed and economic expectations throughout the planet were mild at best. Germany and most of Europe was beginning a rebuilding process while most of SE Asia and Japan were also attempting to rebuild and restructure after a brutal series of global wars. Much of the outside world was still in some form of an undeveloped economic structure at that time. For most of the developed world, the process of rebuilding and identifying real economic growth came nearly 20 years after the end of WWII – near the late 1950s and early 1960s as a type of Renaissance Era.

Given today’s world and how quickly things progress, we believe the process may take about 7 to 14 years to complete this time – depending on how quickly we are able to transition the global away from risks and systematic failures that are a result of clinging to failed 19th-century components.

It is our opinion that wild price rotations
in a variety of global assets will plague the global markets over the next 7+
years as pools of capital are moved into and out of opportunities for returns
and gains. We believe all of the world’s
global markets are at risk for these very volatile rotations in price levels
and that individual segments of the global markets will become targets for price
declines and advances as capital attempts to force a “price discovery” process
that seeks to identify true price values.

The process of true price discovery is convoluted with the steps of shaking off old expectations, risks, liabilities, falsehoods, and processes while attempting to identify real future value and executing the steps to transition these resources into renewed future expectations. It is almost like tearing down a structure in order to build something better and more efficient from the usable pieces of the old structure.

Our opinion is that skilled technical
traders need to stay very fluid right now and to understand that broader risk
factors are at play throughout the globe.
Every major and minor economy on the planet will likely feel some aspect
of the transition that is taking place within the global economy. We’ve highlighted a few charts, below, to
show variations of risk as related to the trends that have taken place over the
past 8+ years. Two of these charts shows
a Pitchfork type of price channel. Once
price breaks below these price channels, we enter a new territory of downward
price trends that will begin the price discovery process.

This chart of the German DAX suggests the
lower price trend channel is currently near $9300. As time progresses, that channel continues to
rise. We would expect the $10,000 level
to be a critical psychological level going forward.

This chart of the FSTE 100 shows a similar
pattern where the lower price channel is near $5450 currently. As we progress further in time, that level
continues to rise. We would suggest the
$6000 will become critical for price support in the FTSE going forward.

The SPY sets up a similar pattern but shows more of our cycle and other research elements. The lower BLUE price channel, near $240, is our current price channel providing longer-term support. Below that level, we would fall back to the 2016 lows near $209.40.

Pay attention to what happens in the global markets over the next 6 to 18 months. The US Presidential election, Brexit and a host of other global issues are still playing out. We believe we are just starting this transition process and we believe now is the time for all skilled technical traders to fully understand that risks, price rotation, and true price discovery are very likely outcomes that may drive very wild price moves for many years into the future.

We urge all of our followers to read all of
the segments of this research post about how the global central banks are
pushing the envelope and have been for many years :

Aug 14, 2019: GLOBAL CENTRAL BANKS MOVE TO KEEP THE PARTY ROLLING

CONCLUDING THOUGHTS:

In closing, sit back and think about all the opportunities that will be created over the next 7+ years if you are skilled enough to trade these massive price swings. Think about how the world will transition away from risk factors that continue to plague our future and towards something that will usher in a 50+ year run of opportunity and gains. If you are young enough to enjoy this run, now is the time you will want to find a solid team of people that can help you navigate this process and find success.

We are only halfway into August and we have already closed out 24.16% in gains from the falling SP500 using SDS, and the pop in gold using UGLD, and from the oversold bounce and rally in silver miners SIL.

We urge all of our followers to pay attention to our research, consider your options very closely and prepare for this next move by pulling some of your active portfolio away from risks and into more protective measures. This Crazy Ivan event is just 10 days away and we really want to urge all of our followers to not under-estimate this event cycle.

WARNING SIGNS ABOUT GOLD, SILVER, MINERS, AND S&P 500

In early June I posted a detailed video explaining in showing the bottoming formation and gold and where to spot the breakout level, I also talked about crude oil reaching it upside target after a double bottom, and I called short term top in the SP 500 index. This was one of my premarket videos for members it gives you a good taste of what you can expect each and every morning before the Opening Bell. Watch Video Here.

I then posted a detailed report talking about where the next bull and bear markets are and how to identify them. This report focused mainly on the SP 500 index and the gold miners index. My charts compared the 2008 market top and bear market along with the 2019 market prices today. See Comparison Charts Here.

On June 26th I posted that silver was likely to pause for a week or two before it took another run up on June 26. This played out perfectly as well and silver is now head up to our first key price target of $17. See Silver Price Cycle and Analysis.

More recently on July 16th, I warned that the next financial crisis (bear market) was scary close, possibly just a couple weeks away. The charts I posted will make you really start to worry. See Scary Bear Market Setup Charts.

FREE GOLD OR SILVER WITH MEMBERSHIP!

BECOME A TECHNICAL TRADER AND PROFIT
CLICK HERE

Chris Vermeulen

Bonds in a Bubble

On the heels of an 800-point plunge in the DOW Wednesday, stocks regained their footing closing out the week on a positive note. Friday’s bounce helped us enjoy the weekend but not enough to wash away some of the negative headlines that hang over the market like a dark cloud. Negative rates abroad and an inverted yield curve here still dominate the news cycle.

The confusing message sent by the administration did little to clear up the picture. It’s fair to say we saw something of a capitulation with the President delaying at least temporarily the 10% tariff on the remaining $300 billion of Chinese imports. The rhetoric focused on the U.S. consumer, but the real fear was the message from the market.

With polls pointing to Americans increasing distrust of China, trade has become a bipartisan issue. Now both sides of the aisle seem to echo something must be done to challenge the world’s second largest economy and increasingly our biggest adversary.

Right now, markets are kind of in a no man’s land. There’s enough good news to keep investors in the game and enough bad news to make for sleepless nights. Let’s look at the landscape and what we we’ll be dealing with in the weeks and months ahead.

Earnings season is all but over and as usual most companies beat expectations. Hardly an accomplishment given CEOs have spent most of the year talking down the numbers. Add the fact that my favorite indicator estimate revisions are still on I-95 South, and it’s easy to see that this dynamic has to change if we’re going to avoid an earnings recession.

Earnings Recession?

Last year, EPS for the S&P 500 came in at just shy of $161. Unfortunately, expectations for 2019 have been declining since September 2018, and this month is no different. If we extrapolate the pace of decline for the first half of the year on a percentage basis to the second half, we’re looking at negative year on year growth.

Which is the better asset class?

German Yield Curve

The focus on the inverted curve is legitimate but can’t be looked at in a vacuum. There’s of course history that signals a rising possibility of a recession when the spread between the 10 year minus the 2-year yield is negative. However, with rates for Germany now negative as far as the eye can see, it’s not surprising that investors would flood into our bonds as a safe haven to capture yields that still start with a plus sign.

U.S. Yield Curve

While equity investors take on more security risk, the dividend yield of the S&P 500 well above the 10-year yield offers a lot of support. I’ll leave it to the talking heads to argue over which is the safer asset class. With yields at historic lows and institutional investors willing to accept a negative rate of return, I think the asset class in a bubble is visible to all but the blind.

S&P 500 1 Year

Technically we need some improvement. When we glance at a standard chart, we can see the index is still living above the 200-day moving average and sits less than 5% from the all-time highs. The rising slopes in the long-term averages adds to the support.

NYSE Bullish Percent Index

To get a more in-depth picture on the market, I often turn to the NYSE Bullish Percent Index which compares the percentage of stocks on a point and figure buy signal vs those on a sell signal. When the the chart is in a column of zeros the number of stocks on a sell signal are rising. Admittedly, point and figure charting is for technical wonks but is still a good indicator on whether the offense or defense should be on the field. For the moment the bears are still in control able to easily push the market lower especially during the summer months when half the buyers are camping out in the Hamptons.

I think it’s safe to say over the last few months the picture has deteriorated, but just not enough to push us into a full-blown correction. We still have a dovish Fed that has all but guaranteed more cuts as the year unfolds. Currently my radar is focused on inflation making sure that benign back drop doesn’t change forcing the Fed to back off from their present course. Last Tuesday’s CPI was hot coming in at 0.3% just above consensus. Not enough to change Fed sentiment, but you can bet it’s on their radar as well.

Equities Contributor: David Nelson, CFA CMT

Source: Equities News

LD Micro: Finding Value in The Habit Restaurants

The LD Micro Index has a rough week like most but made up some lost ground on Friday.

The LD Micro Index currently stands at 2,000.79

When we began four years ago, the opening number was 2,000.

Earnings were in full bloom.

Crescent Capital BDC and Alcentra Capital Corporation decided to tie the knot.

The consideration was $11.02 per share in a combination of cash and stock.

As of the close on Friday, the stock is currently trading at $8.84 per share.

Seems like the “street” doesn’t know or care about the proposed deal.

I wonder what the stock would be trading at if it was an “all-cash” offer.

In 16 days, the 7th annual LD Micro Summit is going to take place in San Francisco.

The top local investors have always expressed tremendous interest in the format because it is fun and fast-paced.

Execs sit at the same table as the investors do, and questions can be asked at any time.

27 investors, 27 companies, one table.

On the company side, we have been picky and have been able to convince a couple of “high-flying, valuation-is-no-concern-everyone-here-owns-a-Model X” companies to join us.

Two spots remain open. I’m confident that we shall be full by the end of the week.

The smaller gatherings are always more fun for me because I present each company personally, and know the audience in attendance quite well.

Tuesday, September 3rd is the date for the SF Summit.

Monday, October 7th is the date of the NYC event.

I fought the law and the law won last year.

When the United Nations is in town, it is best to stay the hell away from Manhattan.

Ten years ago, they used to block a street every now and then. Today, entire quadrants are on lockdown.

No thanks.

During the week, I had the pleasure of spending time with one of my closest friends.

I can count them with one hand.

This person has seen me evolve since the age of 14. If my life was a stock chart, it would be this.

When it was my turn at the squat rack (I was trying to activate my glutes), he asked me a couple of questions that I was not ready for.

“Do you watch any movies anymore?”

Answer: “No”

“Do you ever commit to deep-dives in your research? The ones you were famous for eons ago.

Answer: “Not as much as I like.”

I decided for the first time in my life not to procrastinate, and to show some initiative. Watch a movie, and do some “real” research.

For any person who is looking for a good movie to watch, “The Highwaymen” is a part of American history and fun to watch.

Kevin Costner and Woody Harrelson play Frank Hamer and Maney Gault, two former Texas Rangers whose mission it was to find Bonnie and Clyde and to permanently put an end to their murderous rampage.

The real story is a fascinating one and again reflects on the fact that Texans are not to be screwed with. https://truewestmagazine.com/maney-gault/

On the company side, I would suggest our community to look at one company in particular.

SoCal based.

It went public almost five years ago, at nearly a billion-dollar valuation.

The Company has been consistently profitable throughout most of its history.

It puts In-N-Out to shame and has a very loyal following of consumers, myself included.

The Habit Restaurants is a very interesting name indeed.

Most Americans today do not have time for freshly baked meals in the kitchen.

I don’t even like sit-down restaurants that much anymore, and not many people know the real reason why (not because I am bad tipper).

The Habit plays in a very competitive space, where labor is hard to come by, ingredients are getting more expensive, and everyone’s pocketbooks are feeling the pinch.

I look at it this way..

The Habit has 234 company-operated locations and 28 stores that are franchised.

Expecting to generate revenue between $462 million to $465 million for 2019.

2.5% and 3.5% sales growth at existing company-owned stores.

Geographic expansion both domestically and internationally are still in the early innings.

As of now, the current market cap is $232 million, and the stock is trading at near an all-time low.

Essentially, one is paying 0.5x sales on a business that has a great brand and loyal customer base.

Another thing to consider is that consolidation is alive and well in this sector.

Both from the bigger players involved as well as private equity.

At its IPO, yeah, It was expensive!

Currently, you’re paying less than a million per store.

Let’s see where the “fries” land.

For full disclosure purchases, I do not own any shares in the company and they have never attended any of our past events.

Have a great week.

CL


Impact.

Highlighting Anomalies Amongst the Week’s Biggest Gainers, Losers, & Volume Leaders

by Christian Galatti (Phase 4 Research)

Infrastructure & Energy Alternatives, Part II…+40% For the Week.

IEA Makes the List Again: ARES & Oaktree Buy Into Wind.

Story.

Over the last few months the leader boards have discovered microcaps that make over a billion in revenue. All trading at severe discounts because of a lack of profitability. With little to no coverage, these unheard of names have exponential potential if they execute a turnaround. It’s understandable why IEA went under $2. Even though they guided to $1.2B in revenue, and double that in backlog. Their GAAP EBITDA is negative without adding back depreciation and interest expense, and their inability to build wind farms in bad weather gave investors no hope until summer began.

As soon as the weather got better, so too did IEA. First announcing commitment to their billion dollar guidance in July with a new $150M wind contract. An announcement that reversed the trajectory of the stock.

INDIANAPOLIS, July 01, 2019 (GLOBE NEWSWIRE) — Infrastructure and Energy Alternatives, Inc. (NASDAQ: IEA) (“IEA” or the “Company”), a leading infrastructure construction company with specialized energy and heavy civil expertise, today announced two new wind energy project awards valued at approximately $150 million.

One award is for construction of the Las Majadas Wind Farm in Willacy County, southern Texas. This is an approximate 272-megawatt project that is expected to provide enough energy to power up to 77,000 average Texas homes. This is equivalent to avoiding nearly 280,000 metric tons of carbon (CO2) emissions annually. The power generated by the project’s planned 125 Vestas turbines will be delivered into the Texas electrical grid.

With the Company now able to execute into its favorable season IEA improved again. Adding another $491M in new contracts, which raised backlog to $2.6B (link.) Q2 was a pivotal quarter for the Company. It was not only able to add to revenue, it added huge investors. Securing over $50M in capital now, and the potential for another $110 from Ares and Oaktree.

On August 13, 2019, the Company entered into an Equity Commitment Agreement (the “Equity Commitment Agreement”) among the Company, funds managed by the Private Equity Group of Ares Management Corporation (NYSE:ARES) (“Ares”), a leading global alternative asset manager, and funds managed by Oaktree Capital Management (solely for the limited purposes set forth therein) (“Oaktree”). Pursuant to the Equity Commitment Agreement, the Company agreed to issue and sell 50,000 shares of Series B Preferred Stock (with amended terms, as compared to the terms of the existing Series B Preferred Stock) and 900,000 warrants to purchase common stock (“Warrants”) to Ares for an aggregate purchase price of $50.0 million (the “Tranche One Transaction”).

IEA went up another 40% this week to achieve a market cap of $80M. For Ares and Oaktree are not looking at the short term negative GAAP earnings to make back their $50M. They looking at the long term cash flow, when the majority of the wind farms will be complete, and the maintenance and service continue for a decade. They are looking ahead to when the $2.6B in backlog is done, and the low margin business of making wind farms transitions to the high margin business of keeping them working.

Analyst Disclosures: None (no ownership or relationship with Company.)


ACQUISITION: Crescent Capital BDC, Inc. to Acquire Alcentra Capital Corporation ($ABDC)

Sienna Biopharmaceuticals ($SNNA) Engages Cowen to Explore Financial and Strategic Alternatives

Infrastructure and Energy Alternatives, Inc. ($IEA) Announces Second Quarter 2019 Results, Additional Equity Commitment and Other Potential Financing and Sale Transactions

Horizon Global ($HZN, +30%) Announces Definitive Agreement to Sell Asia-Pacific Business Segment

Galaxy Next Generation ($GAXY) Issues Statement Regarding Unauthorized Promotional Activity Involving its Common Stock

Micro-cap lagged its larger brethren by quite some distance last week, giving up a lot of ground early in the week.

Equities Contributor: Chris Lahiji

Source: Equities News

The Market Has Gone Nowhere in the Last Twelve Months

Image: iStock.com/DjelicS

So, as the bulls pat themselves on the back for holding all the way down last year for a 20% draw down so that they can “enjoy” the rally we got in 2019, I hope they don’t hurt their arms and shoulders from all their back-patting. But, they may be in for a dose of realism when they realize that the market has now been completely flat for the last twelve months.

Allow me to show you a simple fact that should make bulls feel like they have exerted a lot of energy and worry, only to be completely flat over the last year. (And, yes, I am going to use a date from the middle of this past week for a reason). On August 14th of 2018, the SPX closed at 2839.96. And, now, one year later, on August 14th, 2019, the SPX closed at 2840.60.

Think about that before you continue to pat yourself on the back. You have lost a tremendous amount of opportunity over the last year by holding during 2018’s 20% decline.

Now, how many foresaw this potential over the last year? Well, we did. And, we even earned over 20% during that time with the money we took out from the market last fall, whereas “holders” have been flat.

And, it may even get worse before things get better. As I warned those willing to listen over the last few weeks, it was time to prepare for a wild market represented by whipsaw. Thus far, the market has certainly followed through on our expectations.

As I have said so many times before, I know of no other market analysis methodology which can provide you the context for the market as well as Elliott Wave analysis. As one of our members noted at the end of this past week:

“In crazy whipsaw market, EW can identify almost every twist and turn, and even curveballs. Last October to December was a great example, so was the present.”

Yet, my larger degree expectations have not changed. Over the coming weeks, I still foresee the market breaking down towards levels below 2700 on the SPX. However, we will likely see further whipsaw over the coming week before that decline may begin in earnest.

While the details of the continued whipsaw potential can be seen in the potentials I am following on the attached smaller degree charts, I will simply note that as long as the market remains below the 2950-80 SPX resistance region, I am going to maintain my expectations for the market to break down below the 2700 SPX region in the coming weeks.

Should we see this downside follow through in the coming weeks, the action we then see in the last quarter of 2019 will tell us whether we will begin the rally to 3800-4100 SPX sooner rather than later, or if the market will ultimately point us back down towards the 2200 SPX region over the coming year before we begin that rally to 3800-4100.

See charts illustrating the wave counts on the S&P 500.

Equities Contributor: Avi Gilburt

Source: Equities News

Jeff Kagan: Investors, Users Don’t Like Tech Innovation Slump

Image: iStock.com/phive2015

Investors and users have noticed only some kinds of innovation help a company grow and become a leader. Only the right kind is rewarded by the marketplace. Non-important, non-valuable and less exciting innovation not only misses the mark but can also cast a shadow on the company. Let’s take a closer look at this important divide.

While innovation is important, so much is not exciting or even necessary. There are quite a few areas where we find a need for new thinking in our daily lives. Here are a few examples to consider.

Smartphones. During the first several years, the Apple iPhone, Google Android and Samsung Galaxy were always changing. Every year they introduced important, attractive and even sexy new features. Enough so their customers upgraded every year and lined up around the block to get their hands on these new devices.

iPhone, Android, Galaxy in innovation slump with higher prices

However, over the last several years, the smartphone innovation wave was limp at best. That’s why their customers have not upgraded as quickly. It’s not the customer who has changed. In this case, it’s the lack of innovation and the higher price that is just not exciting the customer enough to act.

Next, companies like Apple, Google and Samsung have made a big mistake. Instead of focusing on innovation, they raised prices. Have you noticed how the prices of iPhone, Android and Galaxy have skyrocketed in recent years? To make matters worse, real and exciting innovation is just not there.

So, even big and successful companies can act irrationally and screw this simple recipe up. I think if they dropped prices to their previous, lower levels, sales would be stronger. Lack of innovation would still slow sales, but not as slow as they are today with high prices.

The automotive industry is another great example. There are plenty of areas where car makers can offer what their customers want. They can juice things up and gain a competitive advantage. So why haven’t they done so? Here are a few off the top of my head.

Automotive industry should innovate with sunglasses for cars

Sunglasses for cars. Ever notice how when your car sits in the sun it gets too hot to handle inside? There is an easy solution to counter this heat. Why has no car maker solved this problem? Or for that matter, no after-market company either.

There are several answers. One is self-tinting windows. Like what “Transitions” does for eyeglasses. Think Transitions lenses for the car. This is an opportunity both for the auto industry and for the glass industry.

The windows can either automatically darken in sunlight the way eyeglasses do, or you can flip a switch and they can darken, giving you privacy. Makes perfect sense. Something every customer would want.

In addition to sunglasses and privacy, car shades will also keep cars cool in summer. Who wouldn’t want that?

What about the horn? We still have only one, single, loud horn. What about a dual horn? You know, one for quietly asking someone to get out of the way and the other for the real, loud sound we sometimes suddenly need. That way we don’t have to give walkers a heart attack.

There are plenty of new and innovative ideas in the automobile industry. Why have we not seen them?

Google, Amazon Search Engines need an update

What about search engines and smartphones? We have not seen real innovation in that area since Google popped on the scene knocking Yahoo! out of the leadership position.

What if we could search using AI? As an example, it could allow us to take a photo of something and it will find it online. Google has an image search, but it’s rudimentary and klugey. Or hear a sound and search. This is perfect for search engines, whether they be Google Search or Amazon Search.

We all know there are items we don’t have a name for or just can’t remember. But we may have a picture or a sound. This only makes sense, yet we have not seen it from Google or any other search engine.

Apple has a technology that works this way helping you find the name of a song you are listening to. If they can do that, why not with everything else?

And what about alert systems on our smartphones? Imagine getting notified when your car is going to be towed, or when you are going to get a parking ticket. Or when someone bumps you in a parking lot. Or better yet, when someone is breaking in or stealing your car?

New technology like Ring doorbell and SimpliSafe security are reinventing the home security industry. If that’s the case, we aren’t we also reinventing the driving and automotive experience as well?

We can be notified on an app on our smartphone. Doesn’t that make sense?

There is plenty of need for this protection. Yet there is nothing in the marketplace yet.

Investors are looking for innovative companies

Are you getting the point? There are so many great, exciting and innovative ideas in every industry that users would love.

Ideas that would guarantee media attention and competitive advantage. Ideas that can change industries. Ideas that would fuel rapid growth like we saw in the smartphone market a decade ago.

These are the ideas and the companies that investors are looking for. They are the symbols of the next generation of leaders. Yet, we have seen very little in recent years.

Why are we stuck in this world with a lack-of-innovation? We saw incredible innovation over the last decade or two with Google, Apple, Samsung, Facebook, Twitter, LinkedIn and so much more.

Yet, what innovation have we seen in recent years? Precious little. And that’s my point. Some ideas can create or reinvent entire industries. And there are plenty of ideas and plenty of need.

So, let’s get to it! Time is wasting away. The question investors and users are asking is simple. What company and what people will be the next leaders with exciting and transformative ideas to transform a company or an industry?

That’s what investors are always on the lookout for.

Jeff Kagan is an Equities.com columnist. Kagan is a Wireless Analyst, Telecom Analyst, Industry Analyst, Influencer, speaker and consultant. He follows wireless, wire line, telecom, Internet, pay TV, cable TV, IPTV, Cloud, Mobile Pay and communications technology. Email him at [email protected]. His web site is www.jeffKAGAN.com. Follow him on Twitter @jeffkagan.

Equities Contributor: Jeff Kagan

Source: Equities News

August 19 Turn Date is Tomorrow – Are You Ready?

Our August 19 breakdown prediction from
months ago has really taken root with many of our followers and readers. We’ve been getting emails and messages from
hundreds of our followers asking for updates regarding this prediction. Well, here is the last update before the
August 19th date (tomorrow) and we hope you have been taking our
research to heart.

First, we believe the August 19 breakdown
date will be the start of something that could last for more than 5 to 12+
months. So, please understand that our
predicted date is not a make-or-break type of scenario for traders. It means that we believe this date, based on
our cycle research, will become a critical inflection point in price that may
lead to bigger price swings, more volatility and some type of market breakdown
event. Thus, if you have already
prepared for this event – perfect. If
this is the first time you are reading about our August 19 breakdown
prediction, then we suggest you take a bit of time to review the following
research posts.

August 12, 2019: AUGUST 19 (CRAZY IVAN) EVENT ONLY A FEW DAYS AWAY

August 7, 2019: OUR CUSTOM INDEX CHARTS SUGGEST THE MARKETS ARE IN FOR A WILD RIDE

July 30, 2019: AUGUST 19 PRICE PEAK PREDICTION IS CONFIRMED BY OUR ADL PREDICTIVE SYSTEM

July 13, 2019: MID-AUGUST IS A CRITICAL TURNING POINT FOR US STOCKS

Originally, our research team identified
July 2019 as a market top potential back in April/May 2019. Later, our research team updated our analysis
to include the August 19 breakdown date prediction based on our advanced
predictive modeling tools and cycle analysis tools. This became a critical event in the minds of
our research team because it aligned with much of our other predictive research
and aligned perfectly with what we were seeing in the charts as we neared the
Summer.

The top prediction for July 2019 by our
research team became true as we entered early August. This confirmation of our research and
prediction back in April/May helped to solidify our belief that our August 19th
breakdown prediction would likely become valid as well. Whenever we make a prediction many months in
advance, one has to understand that we are using our predictive analysis tools
to suggest what price “wants” to try to do in the future. External events can alter the price level by
many factors to create what we call a “price anomaly”. When the external events and price predictive
outcomes align as they have been doing over the past 4+ months, it lends quite
a bit of credibility to our earlier predictive research.

In other words, we couldn’t be happier that our research team has been able to deliver incredible insight and analysis regarding the global markets and how the price will react over the past 4+ months. This is something no other investment research firm on the planet is capable of doing with any degree of accuracy right now. In fact, it is amazing to us that we’ll read some research post by a multi-national investment firm that may suggest something now that we’ve alerted our followers to 90 days earlier.

Now, onto some new details about the August
19th breakdown event…

First, be very cautious about investing in Cryptos throughout this event. The initial move, if our research continues to play out, maybe an upside rally in BitCoin based on fear as the global markets start a breakdown process. But we believe this move in Cryptos will be very short-lived as our current research suggests central banks, governments, and other institutions are getting ready to pounce on unregulated Crypto Currencies. It is our belief that the breakdown event will possibly push Bitcoin higher on a “move to safety” rotation. But once Bitcoin investors understand that governments and institutions are targeting these digital currency exchanges as criminal enterprises that threaten central banks and that there is no real safety in putting capital into a digital enterprise that can be shut down in minutes, we believe a rush to the exits will begin to take place.

We believe the shift to real physical assets will take place as a shift in asset valuations continues to take place. We believe the downside risk in Bitcoin is currently at least 30 to 40% from current values. Our initial downside target is a level near $5570 for Bitcoin with potential for price support near $7900.

Daily Bitcoin Chart

This Daily Bitcoin chart highlights arrows that we drew in mid-July based on our expectations for future price rotation. You can see that price, for the most part, followed our expectations and stayed within the Fibonacci price channel, near the lower price levels, while navigating the MAGENTA Fibonacci price amplitude arc (across the tops in price) as it moved towards our August 19th breakdown date. It is critical to understand that price will attempt to either establish new price highs or new price lows based on Fibonacci price theory. It is our belief that an upside rally towards the $11,300 level will be the “last rally” before a breakdown price trend pushes Bitcoin much lower. This is likely the reaction of the “flight to safety” that we suggested earlier.

Weekly Bitcoin Chart

This Weekly Bitcoin chart provides a broader picture of the same event and how it will likely play out in the near future. Remember, initially, global investors will attempt to pike into anything that is quick, easy and efficient to protect against perceived capital risks. We are certain that some investors will attempt to pile into Cryptos as the breakdown event starts. The question is, will this transition of capital stay safe long enough for investors to capitalize on the move? We don’t believe so based on our research.

If the price of Cryptos breaks through that
Magenta Fibonacci price amplitude arc and initiates a move to new higher highs,
then we’ll have to rethink our analysis.
But for right now, we are sticking to our belief that Cryptos will see
an impulse rally that will quickly be followed by a breakdown event (likely the
result of some government intervention or broader risk event).

Weekly S&P 500 Chart

This Weekly S&P 500 chart highlights what we believe is the most likely immediate price trend related to the October 2018 price decline. If a downside price move does initiate as we expect because of the August 19 breakdown inflection point, we believe the S&P will target immediate support above $2400. If you’ve followed any of our research, you already understand we believe the move dynamic economies on the planet are uniquely situated to actually benefit from this downside price event. Therefore, we must understand that a “price exploration event”, like this, is a mechanism for investors to seek out true value levels for global assets. All major price corrections are, in essence, a process of seeking out price levels where investors believe “true value” exists.

NASDAQ Weekly Transportation Index

The NASDAQ Transportation Index paints a very clear picture for our research team. In fact, we find the TRAN particularly useful in our research of the global and US markets. Even though we follow dozens of symbols and instruments, one of our key objectives is to attempt to validate our analysis across multiple instruments/charts and to attempt to identify faults in our expected outcomes.

The recent downside price move in the TRAN
aligns perfectly with our August 19 breakdown expectation. It is very likely that some news or pricing
event over the next 7+ days pushes the TRAN below the RED price channel and
downward towards the middle Standard Deviation level near $3900. Once the TRAN breaks the RED support level,
you should expect the US and global markets to also begin a broader move lower.

Ideally, the $3500 level should operate as a moderately hard price floor for this downside move. $3900 would be considered the initial target of the downside price move whereas $3500 would be considered the initial “hard floor” support level. Given these expectations, we have to consider the potential for a -15% to -25% initial downside price move in TRAN which would translate into a -18% to -35% downside price move in the S&P or NASDAQ.

CONCLUDING THOUGHTS:

In closing, August 19th is tomorrow (Monday). This is where we’ll find out if our prediction will be viewed in the future as accurate or not. The one thing about making public predictions for many months in advance is that you can’t go back and try to lie to your followers/readers. Either it works out as we suggested or it does not. We believe in the skills of our research team and predictive modeling systems. We’ve seen how accurate they have been in the past and we believe we’ve delivered top-tier analysis to all of our followers and readers. In fact, we know you can’t find anything like this type of research from other investment or research firms.

Over the next 10 to 30+ days, we’ll be able to look back at our August 19th prediction and say “we were right” or “we were wrong” – that is part of trading, folks. You use your best tools to make an educated assessment of current and future expectations, then act on it (if you want). We’ll follow up on the other side of August 19th with all of you.

Stay fluid as this event plays out, and most importantly, know that we don’t blindly trade on predictions, we use our short-term technical analysis and current market trends to enter and exit trades. The reality is, no matter if the markets roll over and crash or rocket higher, we will follow and trade with the market. The best thing about being technical traders is we don’t care which way the markets go. We just analyze and trade with the current market trend and make money in both directions and at the drop of a hat!

If you want to trade and invest without the stress of a pending market collapse or missing out on another extended rally to new highs then join my Wealth Building Newsletter today and copy my proven technical trading setups and trade with me!

Chris Vermeulen
www.TheTechnicalTraders.com

Industrials Sector 3Q19: Best and Worst

The Industrials sector ranks fifth out of the 11 sectors as detailed in our 3Q19 Sector Ratings for ETFs and Mutual Funds report. Last quarter, the Industrials sector ranked seventh. It gets our Neutral rating, which is based on an aggregation of ratings of the 422 stocks in the Industrials sector as of July 11, 2019. See a recap of our 2Q19 Sector Ratings here.

Figures 1 and 2 show the five best and worst rated ETFs and mutual funds in the sector. Not all Industrials sector ETFs and mutual funds are created the same. The number of holdings varies widely (from 21 to 358). This variation creates drastically different investment implications and, therefore, ratings.

Investors seeking exposure to the Industrials sector should buy one of the Attractive-or-better rated ETFs or mutual funds from Figures 1 and 2.

Our Robo-Analyst technology[1] empowers our unique ETF and mutual fund rating methodology, which leverages our rigorous analysis of each fund’s holdings.[2] We think advisors and investors focused on prudent investment decisions should include analysis of fund holdings in their research process for ETFs and mutual funds.

Figure 1: ETFs with the Best & Worst Ratings – Top 5

Image Source: New Constructs, LLC

* Best ETFs exclude ETFs with TNAs less than $100 million for inadequate liquidity.

Sources: New Constructs, LLC and company filings

Four ETFs (JETS, HECO, JHMI, FTXR) are excluded from Figure 1 because their total net assets (TNA) are below $100 million and do not meet our liquidity minimums.

Figure 2: Mutual Funds with the Best & Worst Ratings

Image Source: New Constructs, LLC

* Best mutual funds exclude funds with TNAs less than $100 million for inadequate liquidity.

Sources: New Constructs, LLC and company filings

ICTRX is excluded from Figure 2 because its total net assets (TNA) are below $100 million and do not meet our liquidity minimums.

XHB is the top-rated Industrials ETF and FSLEX is the top-rated Industrials mutual fund. XHB earns a Very Attractive rating and FSLEX earns an Attractive rating.

EVX is the worst rated Industrials ETF and PGIAX is the worst rated Industrials mutual fund. EVX earns an Unattractive rating and PGIAX earns a Very Unattractive rating.

422 stocks of the 2800+ we cover are classified as Industrials stocks.

The Danger Within

Buying a fund without analyzing its holdings is like buying a stock without analyzing its business and finances. Put another way, research on fund holdings is necessary due diligence because a fund’s performance is only as good as its holdings’ performance. Don’t just take our word for it, see what Barron’s says on this matter.

PERFORMANCE OF HOLDINGs = PERFORMANCE OF FUND

Analyzing each holding within funds is no small task. Our Robo-Analyst technology enables us to perform this diligence with scale and provide the research needed to fulfill the fiduciary duty of care. More of the biggest names in the financial industry (see At BlackRock, Machines Are Rising Over Managers to Pick Stocks) are now embracing technology to leverage machines in the investment research process. Technology may be the only solution to the dual mandate for research: cut costs and fulfill the fiduciary duty of care. Investors, clients, advisors and analysts deserve the latest in technology to get the diligence required to make prudent investment decisions.

Figures 3 and 4 show the rating landscape of all Industrials ETFs and mutual funds.

Figure 3: Separating the Best ETFs From the Worst ETFs

Image Source: New Constructs, LLC

Sources: New Constructs, LLC and company filings

Figure 4: Separating the Best Mutual Funds from the Worst Mutual Funds

Image Source: New Constructs, LLC

Sources: New Constructs, LLC and company filings

This article originally published on July 11, 2019.

Disclosure: David Trainer, Peter Apockotos, and Kyle Guske receive no compensation to write about any specific stock, sector or theme.

Follow us on Twitter, Facebook, LinkedIn, and StockTwits for real-time alerts on all our research.

[1] Harvard Business School features the powerful impact of our research automation technology in the case New Constructs: Disrupting Fundamental Analysis with Robo-Analysts.

[2] This paper compares our analytics on a mega cap company to other major providers. The Appendix details exactly how we stack up.