The significant underperformance of value strategies over the past 15 years has led many investors to ask: “Is Value Investing Dead?”
As we’ve previously argued, value investing isn’t dead, but one of the most popular value metrics – price to book (P/B) – is flawed and outdated. Changes in accounting rules, off-balance sheet liabilities, and the increased importance of intangible assets make P/B a poor measure of value.
The underperformance of major value index funds – such as the Russell 1000 Value ETF (IWD) – can be tied to their reliance on P/B and other unscrubbed traditional valuation metrics.
Our analysis[1] of the holdings of over 7,500 U.S. ETFs and mutual funds turned up a value ETF that does a much better job of identifying value stocks than its benchmark. This ETF’s methodology is worthy of more investors’ attention because it uses return on invested capital (ROIC) and free cash flow (FCF) to find quality companies that are significantly undervalued. ETF Series Solutions: Deep Value ETF (DVP) is this week’s Long Idea.
High-Quality Holdings Set DVP Apart

DVP is the overall top-rated[2] fund out of the 7,500 U.S. ETFs and mutual funds we cover. However, DVP’s $244 million in assets are less than 1% of the $38 billion allocated to the iShares Russell 1000 Value ETF, which is the 23rd ranked and largest All Cap Value ETF.
Despite being in the same style and focused on finding value stocks, Figure 1 shows that these two ETFs are not at all the same. DVP holds a highly concentrated, high-quality portfolio of just 20 stocks. 14 of these stocks earn our Attractive or Very Attractive rating. No stock held by DVP earns an Unattractive or Very Unattractive rating.
Figure 1: DVP Asset Allocation Compared to IWD

Image Source: New Constructs, LLC
Sources: New Constructs, LLC and company filings
DVP allocates 69% of its portfolio to Attractive-or-better rated stocks compared to just 21% for IWD. On the flip side, DVP allocates none of its portfolio to Unattractive-or-worse rated stocks compared to 39% for IWD. Given this favorable allocation, DVP appears well positioned to capture more upside with lower risk.
The (Not So) Secret to Finding High Quality Stocks – ROIC
DVP’s methodology clearly finds highly rated stocks, as seen above. But what sets it apart from other ETFs that claim to invest in value stocks? The discipline to focus on return on invested capital. Per DVP’s prospectus:
“The universe of companies (to invest in) is then narrowed to include only companies that have positive earnings and returns on invested capital, generate free cash flow, and currently pay a dividend.”
By only considering companies that earn a positive ROIC (which has a strong correlation to increasing shareholder value), DVP is already one-step ahead of other ETFs and mutual funds that use flawed metrics such as price to book, return on equity, or price to earnings.
Most importantly, DVP’s managers have the discipline to pay more than lip service to this stated methodology and only invest in stocks with quality ROICs. The average ROIC of DVP’s holdings is 15%, compared to just 8% for IWD.
DVP’s Methodology Also Successfully Finds Undervalued Stocks
Focusing on ROIC allows DVP’s managers to excel at finding high-quality companies. However, not all good companies are good stocks. DVP’s managers must also excel at finding undervalued companies – and they do.
Despite some drawbacks (which we’ll cover later), DVP’s methodology of using free cash flow, enterprise value (EV), and earnings before interest, taxes, depreciation, and amortization (EBITDA) has enabled its managers to find undervalued stocks.
Figure 2 compares DVP, IWD, and the State Street SPDR S&P 500 ETF (SPY) on the basis of their weighted average valuation metrics, free cash flow yield, price to economic book value (PEBV), and market implied growth appreciation period (GAP).
Figure 2: Valuation Comparison: DVP vs. IWD vs. SPY

Image Source: New Constructs, LLC
Sources: New Constructs, LLC and company filings
As Figure 2 shows, DVP’s holdings are superior to IWD and SPY in all three of the valuation criteria that drive our stock ratings:
- DVP’s free cash flow yield of 6% is three times higher than IWD and SPY. This superior cash flow helps it sustain a 4.8% dividend yield compared to 2.7% for IWD and 2.1% for SPY.
- The PEBV ratio for DPV’s holdings is 0.8, which is less than half of IWD and SPY.
- The average market implied growth appreciation period for DVP’s holdings is just five years compared to 32 years for IWD and 37 years for SPY.
Above Average Costs Are Offset by Quality Holdings
DVP’s 0.65% total annual costs are above the weighted average of all All Cap Value ETFs under coverage, which sits at 0.29%. However, DVP justifies its costs by executing an intelligent investment strategy and being only one of four (out of 27) All Cap Value ETFs to earn an Attractive Portfolio Management Rating.
Top Holdings Found Looking Beyond Traditional Metrics
We can see how DVP’s methodology, and the metrics it doesn’t use, help managers avoid value traps and find high-quality stocks by looking at a few of its top holdings.
Some of DVP’s top holdings include tech firms such as Lam Research (LRCX), Applied Materials (AMAT), Western Digital (WDC), Seagate Technology (STX), and Skyworks Solutions (SKWS). Together, these firms make up 25% of DVP’s portfolio.
We featured Lam Research (LRCX: $177/share) as a Long Idea in May 2018 and the stock continues to earn our Very Attractive rating. LRCX has improved its return on invested capital from 3% in 2013 to a top-quintile 53% TTM while its after-tax operating profit (NOPAT) has grown 22% compounded annually over the same time, per Figure 3. Further highlighting the strength of its business, LRCX has generated a cumulative $5.5 billion (21% of market cap) in FCF since 2015.
Figure 3: LRCX’s Profits on the Rise
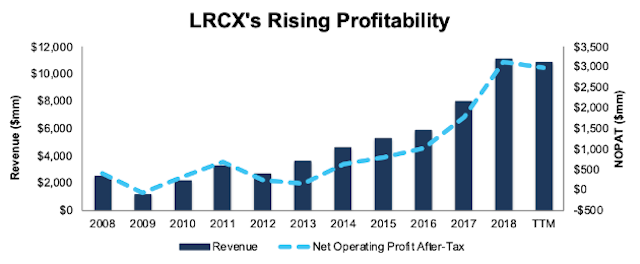
Image Source: New Constructs, LLC
Sources: New Constructs, LLC and company filings
Not only does LRCX exhibit signs of a high-quality company, its stock is also cheap. At its current price of $177/share, LRCX has a price-to-economic book value (PEBV) ratio of 0.9. This ratio means the market expects LRCX’s NOPAT to permanently decline by 10%. This expectation seems pessimistic given that LRCX has grown NOPAT by 22% compounded annually since 2008.
If LRCX can maintain TTM NOPAT margins (27%) and grow NOPAT by just 5% compounded annually for the next 10 years, the stock is worth $292/share today – a 65% upside. See the math behind this dynamic DCF scenario.
DVP foregoes the use of popular valuation metrics, such as price to book (P/B), which allow its managers to find value in stocks many other “Value” ETFs may overlook.
Due to accounting rules, book value is well-known to make Technology firms look more expensive than traditional, capital intensive businesses. For more details, click here. By focusing on ROIC and cash flow generation, DVP can cut through the misleading metrics and find quality Technology stocks such as those listed above.
DVP’s Methodology Could Still Be Improved
Despite its ability to find quality, undervalued stocks, DVP’s methodology is not without flaws.
First, two of the metrics DVP uses to measure valuation are enterprise value and EBITDA. In the past, 80% of equity analysts used EV/EBITDA and others have called it the “best metric” for measuring valuation, so it’s easy to understand why DVP would use such a metric. However, its popularity does not make it a quality measure of valuation.
We detailed many of the flaws with EV/EBITDA in our article “How EV/EBITDA Misses The Point on Valuation.” We’ve also covered issues with EBITDA (and other non-GAAP) metrics here. Mainly, just as with other traditional valuation metrics, EV/EBITDA relies on flawed accounting data and can give a misleading picture of a firm’s valuation relative to its true cash flows.
Second, DVP only looks at a firm’s current ROIC, not necessarily changes in ROIC. This distinction means DVP could view the current profitability of a firm as positive, even if its ROIC is rapidly declining. The Gap (GPS: $25/share), which earns our Neutral rating, is a perfect example of the importance of the trend in ROIC. Specifically, GPS’s ROIC has fallen from 16% in 2014 to 9% TTM, while its NOPAT has fallen 8% compounded annually from 2014-2018. TTM NOPAT is down 14% over the prior TTM period, per Figure 4.
GPS, which accounts for 7% of DVP’s portfolio, currently earns a positive ROIC and generated positive FCF over the trailing twelve months, thereby meeting DVP’s initial criteria. However, given the current trend in ROIC, GPS might not meet DVP’s criteria in the future.
Figure 4: GPS’ NOPAT & ROIC Headed the Wrong Direction
Image Source: New Constructs, LLC
Sources: New Constructs, LLC and company filings
Given the deteriorating fundamentals, it’s easier to understand why the expectations baked into GPS (as measured by its PEBV of 0.8), imply that profits will permanently decline by 20%. Luckily for investors, GPS appears to be the outlier in what is largely a strong portfolio.
The Importance of Holdings Based Analysis
Smart ETF (or mutual fund) investing means analyzing the holdings of each ETF. Failure to do so is a failure to perform proper due diligence. Simply buying an ETF or fund based on past performance does not necessarily lead to outperformance. Only through holdings based analysis can one determine if a fund’s managers are sticking to their stated methodology and truly allocating to high-quality stocks, as DVP does.
However, most investors don’t realize they can already get the sophisticated fundamental research that Wall Street insiders use. Our Robo-Analyst technology analyzes the holdings of all 380 ETFs and mutual funds in the All Cap Value style and 7,500+ ETFs and mutual funds under coverage. The number of holdings in these All Cap Value ETFs and mutual funds varies from just 18 stocks to 1,549 stocks in a given fund. Our diligence on holdings allows us to cut through the noise and find ETFs, like DVP, with a portfolio and methodology that suggests future performance will be strong.
This article originally published on February 6, 2019.
Disclosure: David Trainer, Kyle Guske II, and Sam McBride receive no compensation to write about any specific stock, style, or theme.
Follow us on Twitter, Facebook, LinkedIn, and StockTwits for real-time alerts on all our research.
[1] Harvard Business School features our Robo-Analyst research automation technology in the case New Constructs: Disrupting Fundamental Analysis with Robo-Analysts.
[2] Excluding FLAG-Forensic Accounting Long-Short ETF (FLAG) and Alpha Architect US Quantitative Value ETF (QVAL), both of which have less than $100 million in assets and don’t meet our liquidity minimums.


