Animation: The Heartbeat of Nature’s Productivity
Even the most ferocious predator must rely on simple plants for vitality. That’s because without the conversion of carbon dioxide to organic compounds, entire food chains would cease to exist.
Photosynthesis is quite the catalyst for life, yet it’s easy to overlook this humble chemical process. But what if you could see its results scaled across the globe?
The Pulse of Nature
Today’s unique cartogram animation comes from geographer Benjamin Hennig at Worldmapper, and it depicts ongoing cycles in the productivity of ecological systems around the world. Created with Yadvinder Malhi from the University of Oxford, the researchers factored the daily net photosynthesis value over an 8-day interval of satellite observations, and extrapolated the trends for a year.
The outcome? A pattern of gross primary productivity (GPP) – the net amount of energy produced by land plants during photosynthesis – resembling the rhythmic impression of a “heartbeat”.

Here’s how a big-picture of average annual productivity ends up looking:
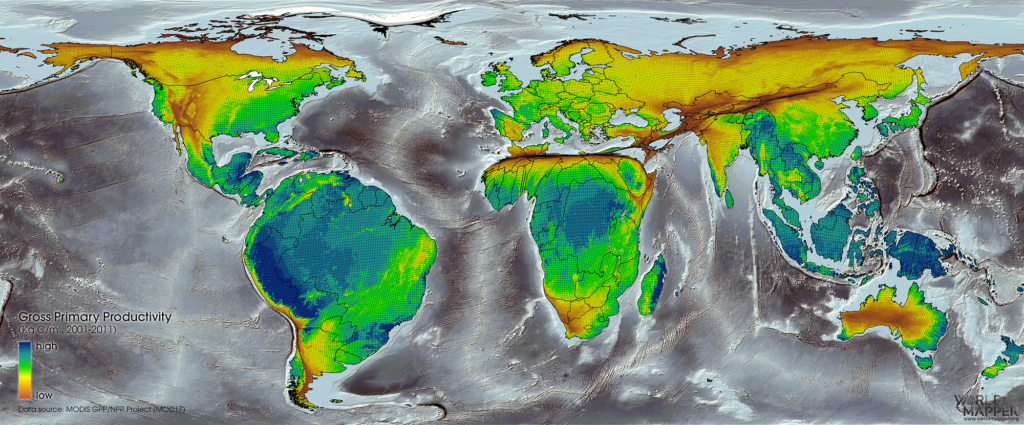
Location, Location, Location
Although the entire biosphere harnesses the sun’s energy, it’s clear this varies greatly based on both region and season. For example, desert areas such as the Sahara or Australian Outback occupy relatively low productivity areas on the map.
The taiga biome, a boreal forest made of coniferous trees such as pines, accounts for nearly a third of the world’s forest cover. Since the largest boreal areas are in Russia and Canada, it’s no wonder their productivity shrinks dramatically when it gets a bit cooler up north. When these areas slow down in sub-zero temperatures, their tropical neighbors to the south do the heavy lifting.
If forests are considered the world’s lungs, then the Amazon in South America and Congo forest in Central Africa help us all breathe a bit easier. The two largest forests act as crucial “carbon sinks”, trapping carbon that would otherwise be converted to carbon dioxide.
It’s also why rapid deforestation of these areas is cause for alarm. Many environmental scientists suggest that our human impact on forests could intensify global warming.


