The Dow 30 Industrials and S&P 500 declined significantly when the US markets opened. Stock market indices in Asia and Europe declined earlier today. The declines were from the anxiety which was caused due to the official start of the trade war between the US and China which began at the end of last week. The economies of the two countries are the world’s largest.
The war officially began on June 15, 2018, when US President Trump announced that the US was moving forward with its instituting 25% tariffs on $50 billion of Chinese goods that are imported into the US. China retaliated with $50 billion of tariffs on US’ soy, corn, wheat, cotton, rice, sorghum, beef, pork, poultry, fish, dairy products, nuts and vegetables. All of the US indices including the Dow Jones 30, S&P 500 and NASDAQ ended Friday lower. For the week ended June 16, 2019, the Dow 30 index had its worst performance within the past 12 weeks.
There is a reason why the markets are now discounting the trade war instead of when Mr. Trump threatened to start it. Many had believed that Mr. Trump was only using the tariffs as a bluff and a negotiating tactic.
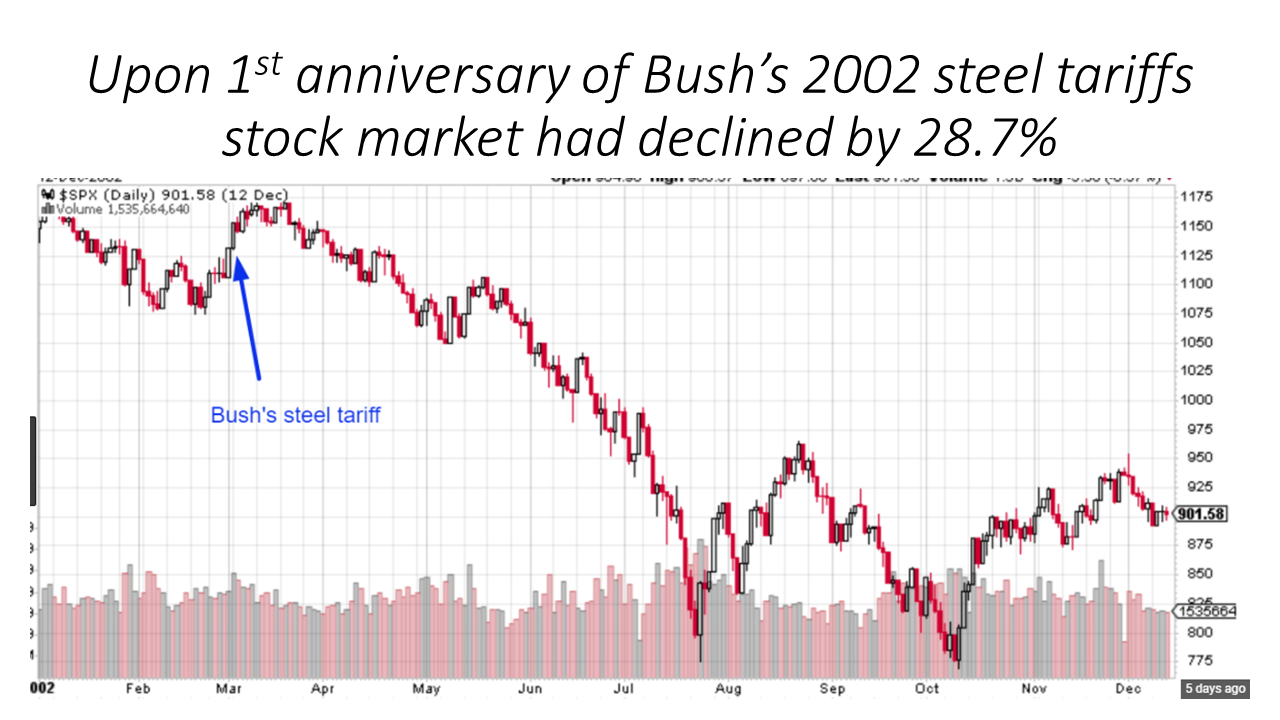
Now that trade war has officially begun the markets discounting it has also begun. The bottom line is that tariffs negatively impact share prices since they compress PE multiples. It’s because tariffs constrict FREE trade and this reduces global economic activity. The charts below illustrate that the PE multiples declined and also that the market declined by 28.7% while the Bush steel tariffs were in effect.


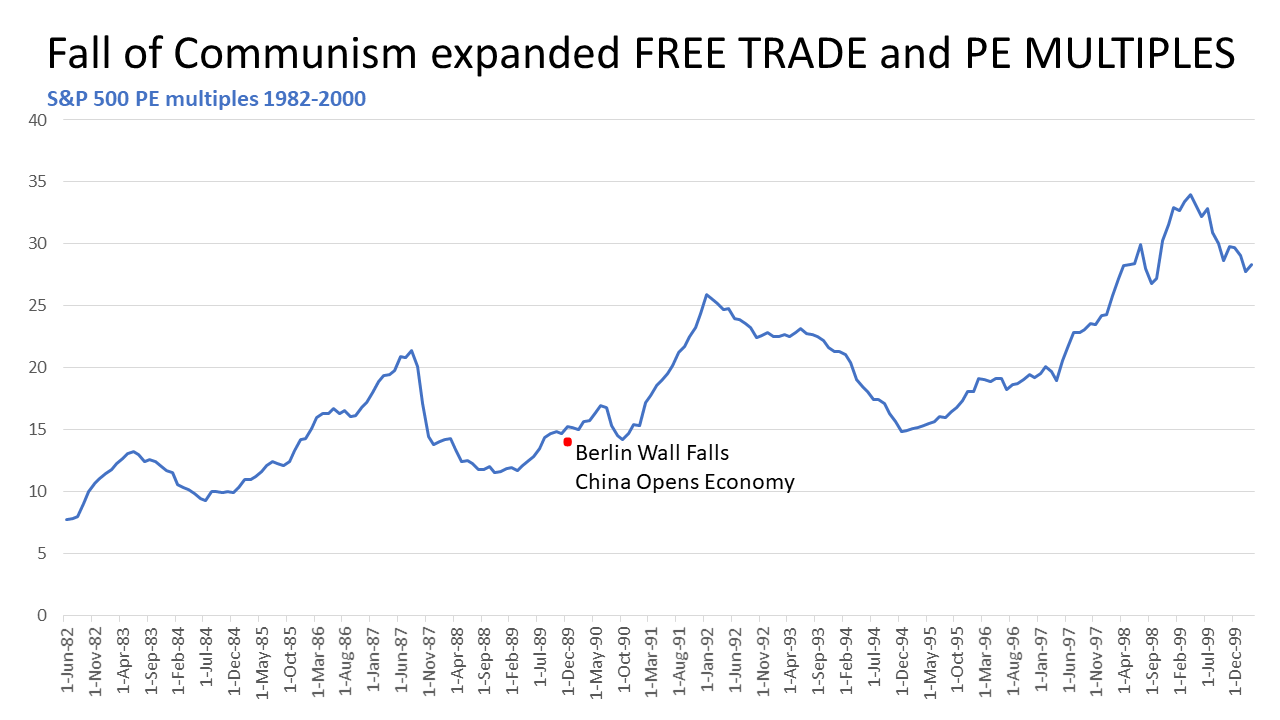
The elimination of a tariff has the exactly opposite effect. It expands free trade and the stock market’s PE multiples. However, there is not an example of this since there has not been a previous time in world history for what happened after tariffs were lifted. Therefore, the best example is what happened in the late 1980s. Communism collapsed in eastern Europe after the Berlin Wall was knocked down and China transformed its economy to allow free trade. See white paper “China: Economic Transformation Before and After 1989” by Barry Naughton. This increased the number of consumers to purchase goods by over 1 billion. The two FREE Trade events were the drivers of the expansion of PE multiples at approximately the mid-point of 1982 through 2000 secular bull market. The chart below depicts that expansion of PE multiples from 14 to 34.
The 3 minute, 2 second video below is an interview of me. The video is about the effects that tariffs have on PE multiples.
All of my alerts and updates about secular bear market which is has been underway are available for FREE at www.profitfromthecrash.com.
For those investors who do not want to take minimal risk and yet have the potential for their portfolios to grow I am recommending the deployment of a 90/10 Crash Protection Strategy. For information on the strategy which is the only fail-safe strategy that one can utilize to protect their liquid assets from crashes, recessions and depressions view video below entitled “Profit From the Crash”.
Disclaimer. Mr. Markowski’s predictions are frequently ahead of the curve. The September 2007 predictions that appeared in his EquitiesMagazine.com column stated that share-price collapses of the five major brokers, including Lehman and Bear Stearns, were imminent. While accurate, they proved to be premature. For this reason he had to advise readers to get out a second time in his January 2008 column entitled “Brokerages and the Sub-Prime Crash”. His third and final warning to get out, and stay out, occurred in October of 2008 after Lehman had filed for bankruptcy. In that article “The Carnage for Financials Isn’t Over” he reiterated that share prices for Goldman and Morgan Stanley were too high. By the end of November 2008, the share prices of both had fallen by an additional 60% and 70%, respectively — new all-time lows.


