Crude oil’s price continues to soar in a sharp manner, but no asset can move in a straight line without periodic corrections so even if crude oil’s price was about to rally tens of dollars (which doesn’t appear so likely to be seen this year, but that is a discussion for a different day), one should still expect it to form local tops along the way. Where will crude oil top and where can it provide us with a promising trading opportunity?
We summarized yesterday’s Oil Trading Alert by saying that higher prices in the short run would become more likely if the black gold closed the June price gap – and that’s exactly what happened yesterday. Please take a look for details below (charts courtesy of http://stockcharts.com).
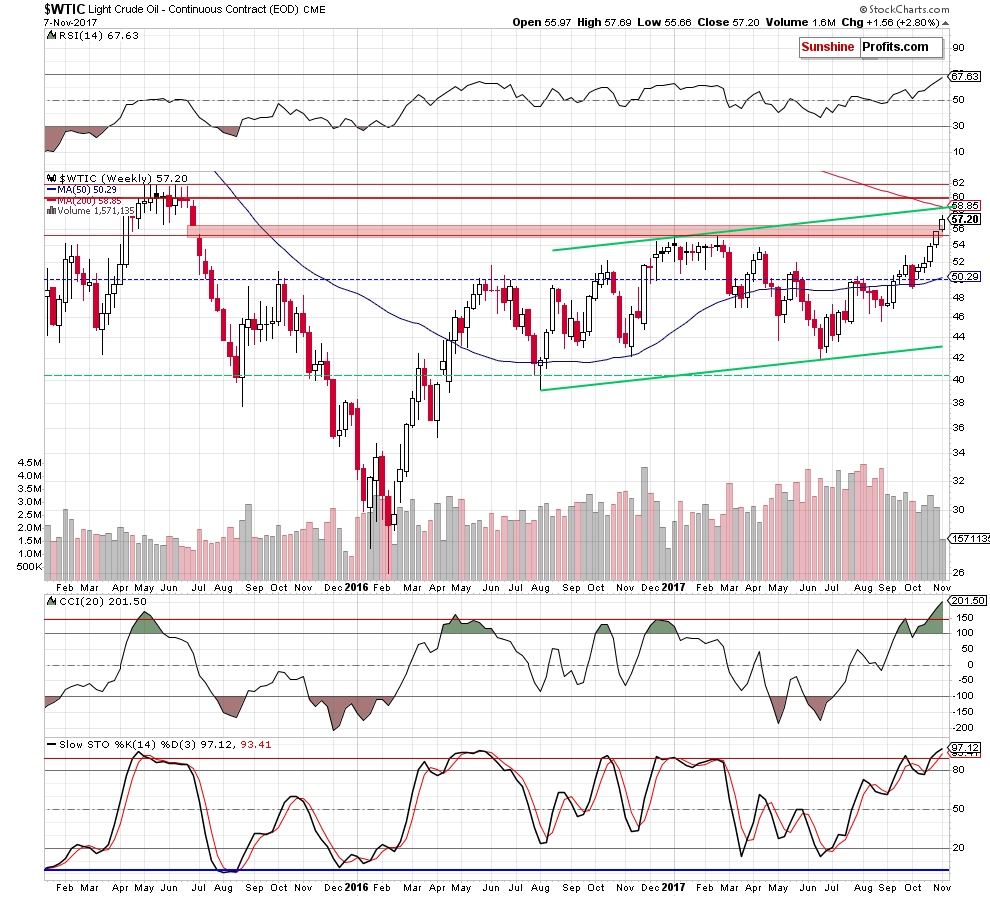

The mentioned price gap is marked with the red rectangle and it’s clearly visible that the price of crude oil closed above it. This makes higher prices much more likely in the short term. So, the question becomes, what’s the next stop and will it be the final one for some time (in terms of months). There are a few candidates for the next turnaround price and they are all close to the $60 level.
The resistance is provided by the upper border of the rising trend channel (marked in green) and the 200-week moving average coincide at about $59. The 2015 highs in terms of weekly closing prices provide the target at about $60 and the same highs, but in intraday terms point to $62 as important resistance.
The long-term chart provides additional details.
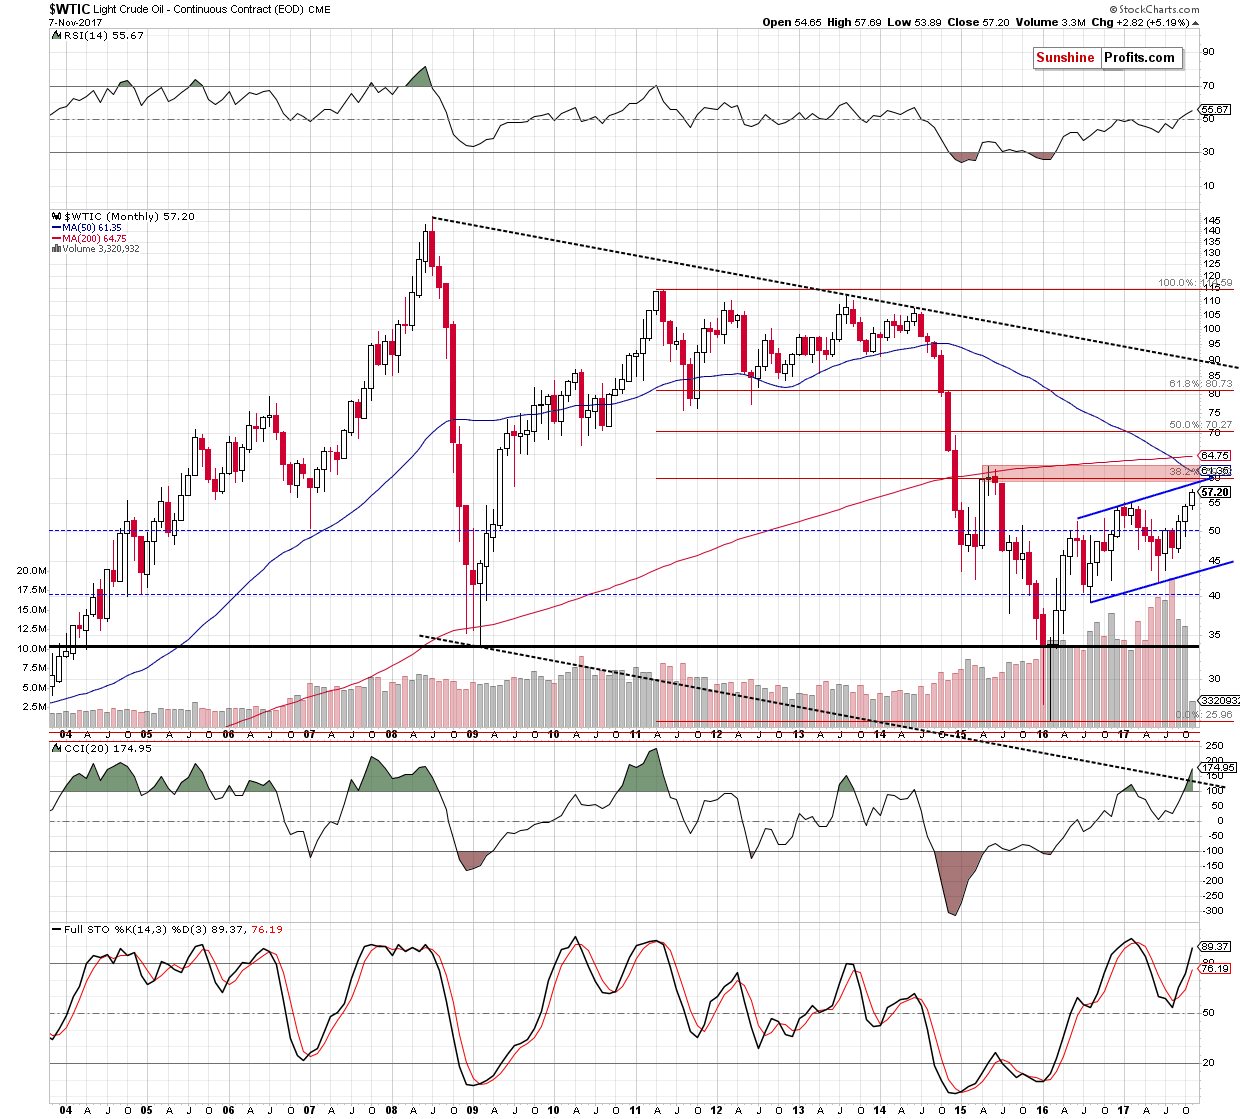
The 2011 is a year that’s important not only for gold investors, but also for crude oil investors and traders as that’s where we saw the second most important top of the past decade. Using this high as a starting point and the early 2016 low as the final point provides us with important (the above extremes are very important, so the techniques based on them are important as well), long-term Fibonacci retracement levels. The first of the classic levels – 38.2% – is just a few dollars above yesterday’s closing price and just a few cents below the $60 level.
Is there anything else that could indicate the possibility of a reversal in the coming days or weeks a few dollars above the most recent price? Yes, something that’s not visible on the above chart but that could still be important. The thing is that the importance of the geopolitical events is often needlessly overstated. Yes, quite a lot happened over the weekend, but did just as much change? Not really and while it’s no wonder that the market reacted by rallying higher, nothing really happened that would justify a major, $10+ rally from here. Consequently, the market is likely to get ahead of itself, overreacting to the news – just like it usually does. This is likely to provide us with a good trading opportunity in the coming days. Naturally, that’s just a good idea at this time, not a definite trading plan just yet – we’ll need some confirmations that the top is indeed in when crude oil rallies further. Naturally, we will be looking for them and report to you – our subscribers – accordingly.
Summing up, it seems that crude oil could rally further, until approximately the $60 level is reached and there is a good chance that it would provide us with a shorting opportunity, but it doesn’t seem that we should be opening the positions without seeing an additional bearish confirmation first.
If you enjoyed the above analysis and would like to receive free follow-ups, we encourage you to sign up for our daily newsletter – it’s free and if you don’t like it, you can unsubscribe with just 2 clicks. If you sign up today, you’ll also get 7 days of free access to our premium daily Gold & Silver Trading Alerts. Sign up today!.
Thank you.
Nadia Simmons
Forex & Oil Trading Strategist
Przemyslaw Radomski, CFA
Founder, Editor-in-chief, Gold & Silver Fund Manager
Gold & Silver Trading Alerts
Forex Trading Alerts
Oil Investment Updates
Oil Trading Alerts


