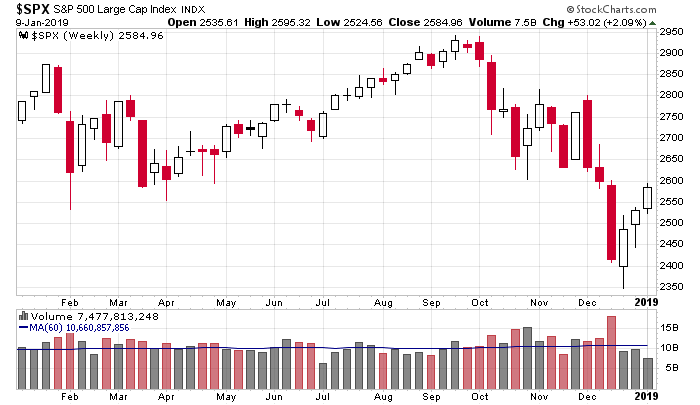
The market plunged into its December low. The S&P fell 450 points in 3 weeks, and the number of stocks trading above their 20, 50, and 200-day moving averages hit levels not seen since the Financial Crisis.
Now the market is moving straight up – call it a V bottom. The S&P has recaptured almost 250 of those lost points.
This has Wall Street wondering: Is that it? Is a bottom in place? Does the market need to go back down and test the low, or can it just keep moving higher from here?
Let’s go back in time and look at previous bottoms and see if there is a trend, see if a certain bottom formation is more prevalent than others.

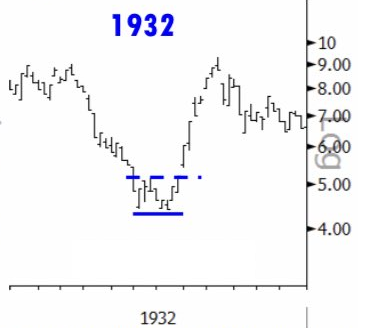
1932: Mini double bottom, with lows only 2 months apart. Initial rally recaptured the stiff move down that preceded the bottom.
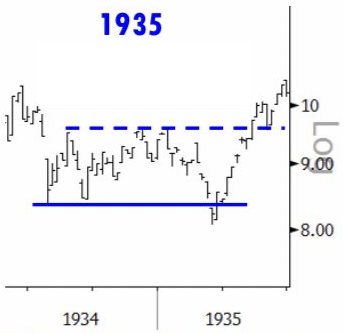
1935: Mini double bottom in 1934 failed. Bigger double bottom between 1934 and 35 formed, with the second low being a V bottom that very was quickly followed by a huge vertical move.
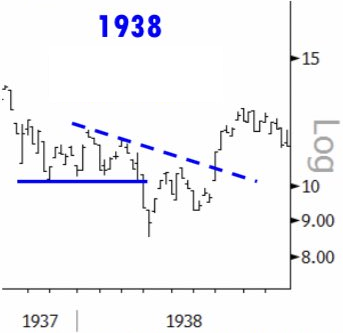
1938: V bottom, but the S&P stalled for a couple months before legging up again. The V took place right after the index broke down to a new low.
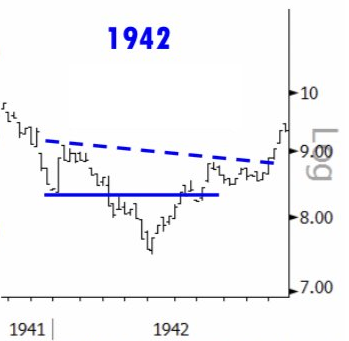
1942: V bottom with what appears to be a head-n-shoulder bottom. The rally off the low was steady, only pausing near the previous high before breaking out again.
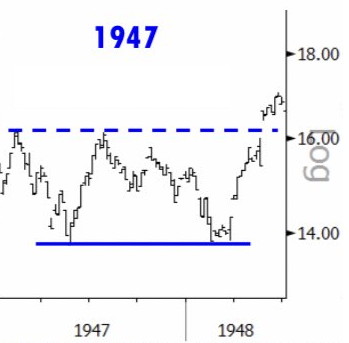
1947: Large double bottom with lows almost a year apart. When the second low was in, the market gapped up and went virtually straight up.
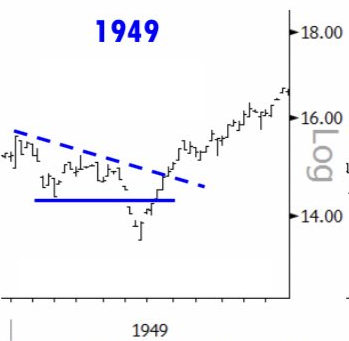
1949: V bottom and then lock-out rally. Despite things looking pretty bleak, given the break of the previous and vertical plunge, the S&P recovered quickly.
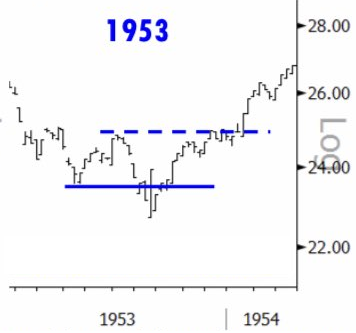
1953: Lower low followed by V bottom and lock-out rally.
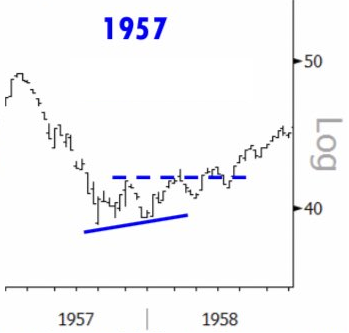
1957: Double bottom separated by a couple months. The index then grinded higher for several months and then seemed to hit an inflection point in mid-1958.
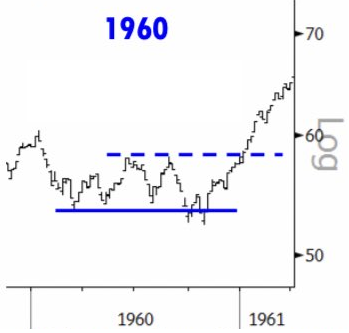
1960: False breakdown and then lock-out vertical move.
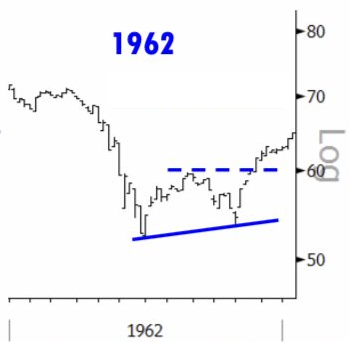
1962: Double bottom separated by about 6 months. Then steady move up.
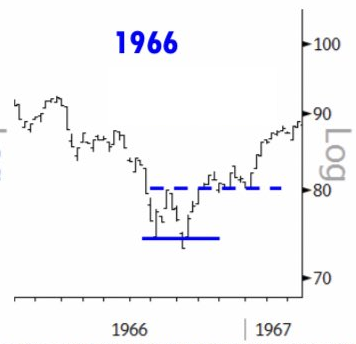
1966: Steady downtrend…mini double bottom…steady uptrend. Once the second bottom was in place, there was no threat the low would be tested.
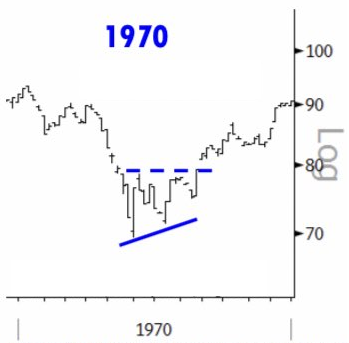
1970: Mini double bottom, followed by breakout at resistance. Then continuation of the move up with no threat to retest the lows.
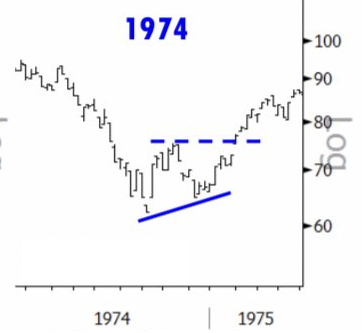
1974: Double bottom followed by steady rally. No threat to test the low once the move started.
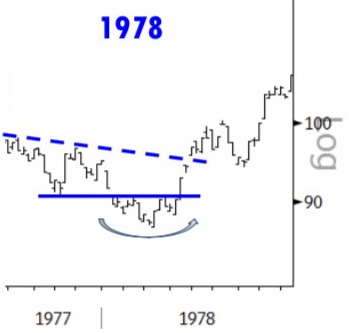
1978: Lower low followed by mini head-n-should bottom. A robust move took out the previous high, and after a rest, the uptrend continued.
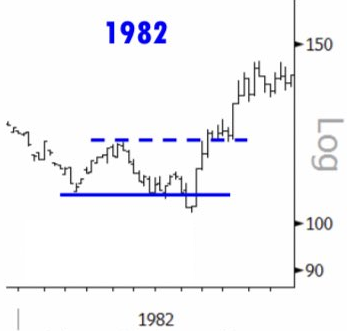
1982: Failed breakdown was followed by V bottom and robust rally that paused briefly at previous high before continuing up.
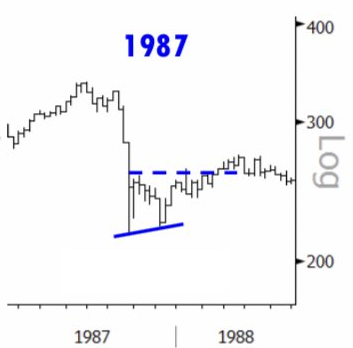
1987: Double bottom followed by slow grind up.
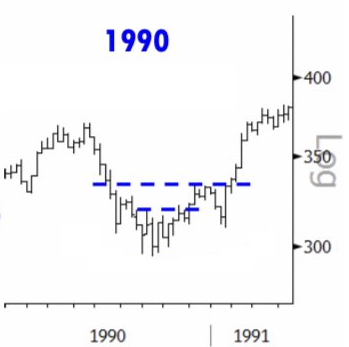
1990: Head-n-shoulders bottom followed by robust rally once the neckline was taken out. The previous high was easily eclipsed.
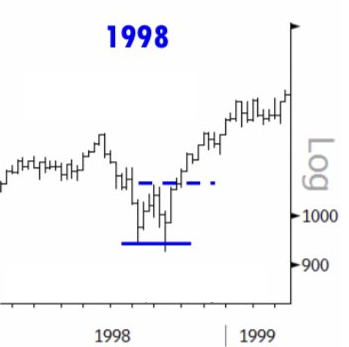
1998: Mini double bottom followed by steady rally that paused briefly in the area of the previous high before continuing on.
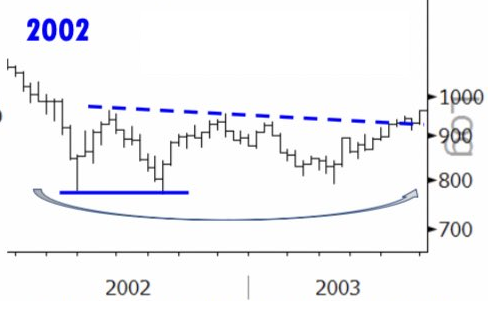
2002: Triple bottom spread out over 8 months. Then S&P moved up 11 of 12 months with only minor pauses.
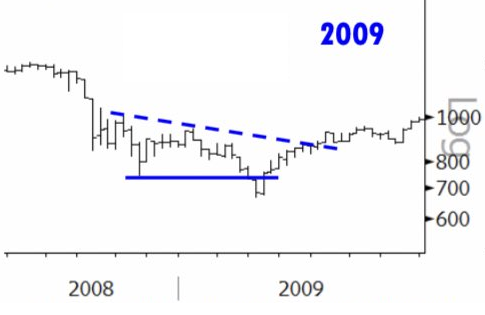
2009: V bottom following a lower low. Once the low was in, the S&P rallied 12 of 14 months.
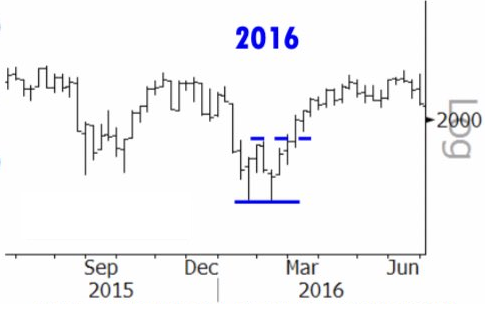
2016: Double double bottom. The market paused at the previous highs, but otherwise moved steadily up for 2 years.
2019: ??? So far we have a V bottom. Or this might not be the bottom.
Conclusions :
Bottoms come in all shapes and sizes and play out over many time frames. There is no dominant pattern. There are V bottoms. There are mini double bottoms where the lows are separated by a month or two. There are big double bottoms that take 6-12 months to form. We cannot look for a certain type of pattern or sequence to play out. Bottoms really do take many shapes, so if you’re looking for something specific, there’s a good chance you won’t get it.
But…
One characteristic that exists in almost off these bottoms is a very robust and energetic subsequent rally. In fact most of them are lock-out rallies that don’t let investors in at lower prices once they begin.
There are many examples of the market falling to lower lows – and you knew news and sentiment were terrible during those times – only to quickly reverse and head straight north.
So if you think the market has to go down and test those lows, it doesn’t. If you think the market has to pause or a give a little back and form a larger foundation, it doesn’t.
The most dominant common characteristic between these charts is that once a bottom is in, the market surges up.
I’m not calling for a low. What we got in December may just be a moderate drop within a bigger downtrend, with much lower prices to come. But I am making the point that when a bottom is in place – no matter how terrible things are – the market tends to just take off. Even if you are rightfully bearish, not being open-minded to the possibilities will lead you to missing the beginning stages of some big rallies.
Jason Leavitt
[email protected]


