Central banks’ purchases create a floor for gold prices. Myth or fact?
We invite you to read our today’s article about the central banks’
demand for gold and find out whether it will save gold.
Gold is an important part of central banks’ foreign exchange
reserves. As of H1 2018, they hold about 34,000 tons of bullion worth
$1.36 trillion, or 10.3 percent of the total reserves, according to the World Gold Council.
Interestingly,
we have recently seen the increased interest in gold. In the first nine
months of 2018, central banks purchased more than 350 tons, the fastest
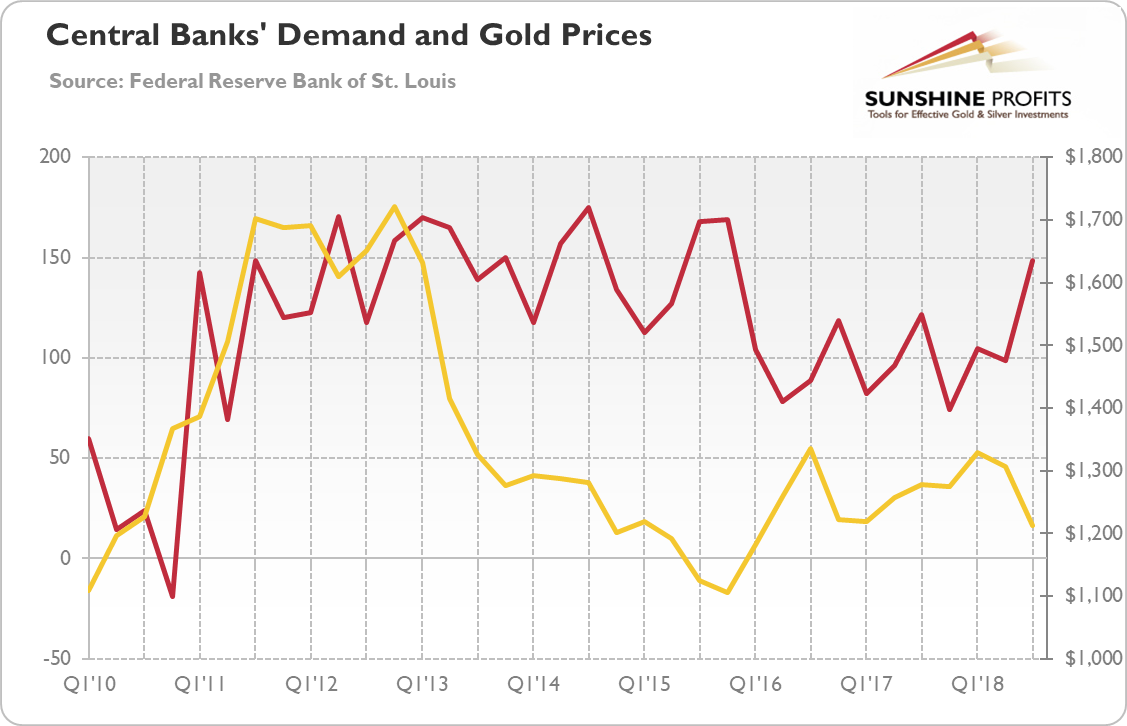
pace of accumulation since 2015. In sole Q3 2018, central banks bought
more than 148 tons, 22 percent higher year-over-year. It was the highest
level of quarterly demand since Q4 2015, as one can see in the chart
below.
Chart 4: Central banks’ demand (red line, left axis,
in tons) and the price of gold (yellow line, right axis, London P.M.
Fix, in $) from Q1 2010 to Q3 2018.

What
is important is that more central banks joined the list of gold
purchasers, which means that the gold’s appeal is widening. While
Russia, Turkey and Kazakhstan continued their buying, other players
decided to buy the yellow metal as well. For example, Egypt bought gold
for the first time since 1978, while India added gold to its assets for
the first time in almost nine years. Also Indonesia, Thailand and the
Philippines re-entered the market after multi-year absences.
Moreover,
the National Bank of Poland made its first purchases of gold in 20
years, while the Hungarian National Bank added more gold to their
reserves for the first time since 1986. Their purchases marked the first
growth in gold reserves within the European Union so far in the 21st century.
Hence, the questions arises. Why are they buying? Does that mean that the price of gold is going to rise? Do the central banks’ purchases of bullion provide a floor for its price?
Although
it’s tempting to assume that central bank are buying gold because they
possess some inside knowledge about the upcoming financial crisis for
which they want to be prepared, there is a much more prosaic reason. The
gold price has declined more than 6 percent so far this year (since
January 2nd to November 7th). After such a drop, gold might look as an attractive alternative to other foreign currencies, US dollar in particular.
It suggests that the central bank demand does not drive the gold prices. One thing is that it is simply too tiny in comparison to the overall gold market. It makes about 13 percent of the annual new gold supply calculated by the WGC, which itself constitutes a small percentage of the total gold holdings. But another is that, as we have seen, central banks tend to buy gold when its price declines. So the gold prices drive the central bank purchase, if at all, not the vice versa.
Or,
actually, the link between the central banks and the bullion prices may
be even weaker. Joshua Aizenman and Kenta Inoue analyzed the patterns
of gold holding and trading by central banks during 1979-2010 in their
paper “Central Banks and Gold Puzzles”.
They found that generally central banks maintained passive stocks of
gold, independently of the patterns of the gold prices. Just look once
more at the chart above: as you can see, the quarterly demand remained
within a narrow range during 2013-2015, although the price of gold
plunged.
This is because the intensity of holding gold has more to do with signaling economic might.
Indeed, among buyers there are countries with a strong need to signal
their power, especially relative to the ‘rotten West’, like Russia or
Turkey. And it might not be a coincidence that Poland and Hungary, which
are supposedly turning away from constitutional democracies, joined
the club of gold buyers.
Summing up, the central banks continue
buying the shiny metal. Actually, they increased their demand for
bullion, which indicates that the gold’s appeal as a safe haven or a portfolio diversifier is widening.
However, despite some mistaken opinions, it is not a bullish sign.
If the central bank purchases have something to do with the level of
gold prices (which is not certain), it is a testimony of previous
declines. Investors should drop their hope that the central bank demand
will provide a floor for the price of gold. The history shows that official purchases did not prevent the deep dives in prices.
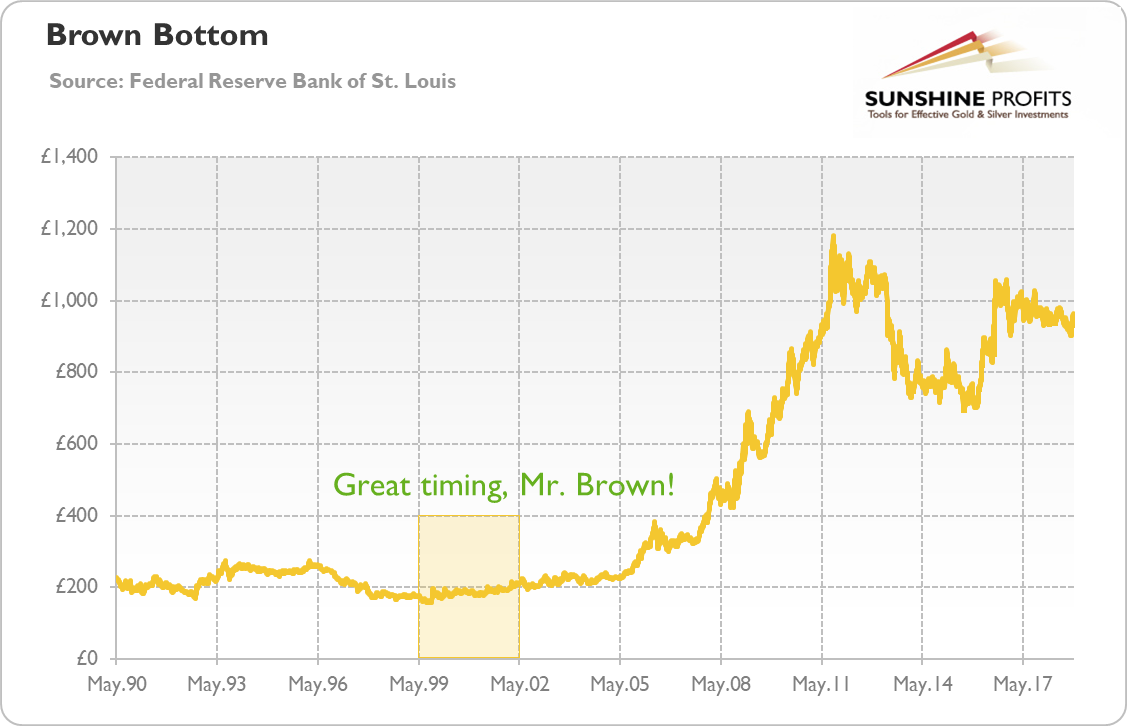
Moreover, do you remember the Brown Bottom?
The UK sold half of its gold reserves, and the price declined just
8.5%. But very soon gold started its tremendous bull market (see the
chart below), which puts the ability of official transactions to affect
the gold prices in a sustainable manner into question.
Chart 5: Gold prices in British pound from May 1990 to November 2018.
And
it was at the turn of 1990s and 2000s, when the price of gold was much
lower, while the gold market less liquid. Now, given a few times higher
prices and highly liquid market, the amount of gold needed to affect the quotation is prohibitive – and its impact would be only short-lived.
If you enjoyed the above analysis and would you like to know more
about the macroeconomic outlook and the gold market, we invite you to
read the December Market Overview
report. If you’re interested in the detailed price analysis and price
projections with targets, we invite you to sign up for our Gold & Silver trading Alerts.
If you’re not ready to subscribe yet and are not on our gold mailing
list yet, we urge you to sign up. It’s free and if you don’t like it,
you can easily unsubscribe. Sign up today!
Thank you.
Arkadiusz Sieron, Ph.D.
Sunshine Profits‘ Gold News Monitor and Market Overview Editor
Gold News Monitor
Gold trading Alerts
Gold Market Overview


