All of the sudden….volatility.
Well, that is what it seems like anyway after several years of a steady grind higher in the markets. However, despite the pickup in volatility, the breaks of previous bullish trends, and a reversal in Central Bank policy, it is still widely believed that bear markets have become a relic of the past.
Now, I am not talking about a 20% correction type bear market. I am talking about a devastating, blood-letting, retirement crushing, “I am never investing again,” type decline of 40%, 50%, or more.
I know. I know.
It’s the “doom-and-gloom” speech to try to scare investors into hiding in cash.

But that is NOT the point of this missive.
While we have been carrying a much higher weighting in cash over the last several months, we also still have a healthy dose of equity related investments.
Why? Because the longer-term trends still remain bullish as shown below. (Note: The market did break the bullish trend with a near 20% correction in 2016, but was bailed out by massive interventions from the ECB, BOE, and BOJ.)
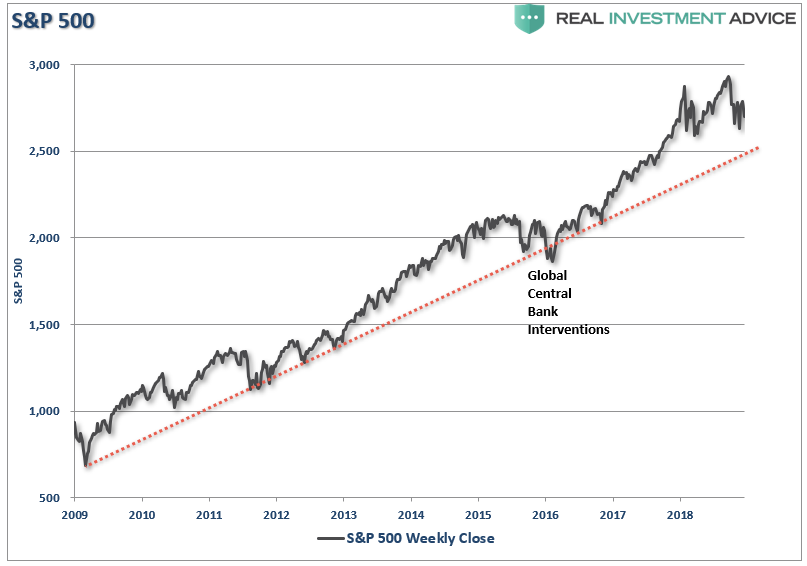
Now, you will note that I keep saying a 20% “correction.” Of course, Wall Street classifies a bear market as a decline of 20% or more. However, as I noted recently:
“During a bull market, prices trade above the long-term moving average. However, when the trend changes to a bear market prices trade below that moving average. This is shown in the chart below which compares the market to the 75-week moving average. During ‘bullish trends’ the market tends to trade above the long-term moving average and below it during ‘bearish trends.’”
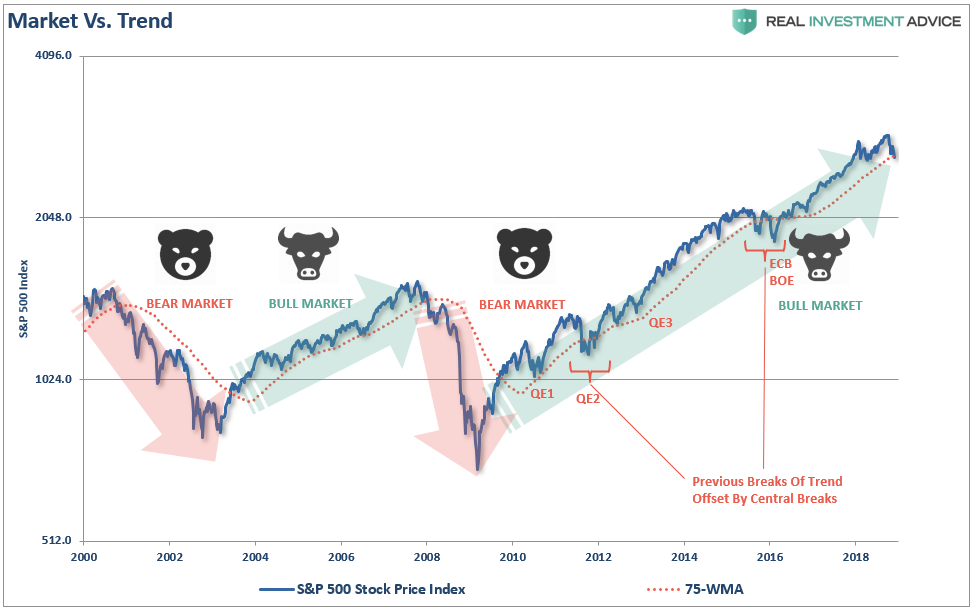
In other words, at least for me, it is the overall TREND of the market which determines a bull or bear market. Currently, that trend is still rising. But such will not always be the case, and we may be in the process of the “trend change” now.
The Collision Of Risks
Of course, after a decade of Central Bank interventions, it has become a commonly held belief the Fed will quickly jump in to forestall a market decline at every turn. While such may have indeed been the case previously, the problem for the Fed is their ability to “bail out” markets in the event of a “credit related” crisis. Take a look at the chart below.

In 2008, when the Fed launched into their “accommodative policy” emergency strategy to bail out the financial markets, the Fed’s balance sheet was only about $915 Billion. The Fed Funds rate was at 4.2%.
If the market fell into a recession tomorrow, the Fed would be starting with roughly a $4 Trillion dollar balance sheet with interest rates 2% lower than they were in 2009. In other words, the ability of the Fed to “bail out” the markets today, is much more limited than it was in 2008.
But it isn’t just the issue of the Fed’s toolbox. It is the combination of other issues which have all coalesced which present the biggest risk to a substantial decline in the markets.
Valuations
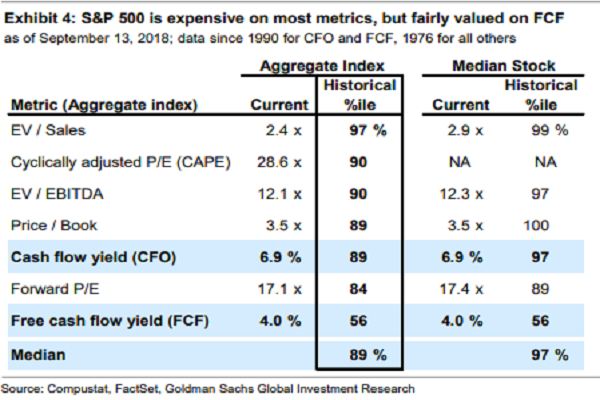
One of the most important issues overhanging the market is simply that of valuations. As Goldman Sachs pointed out recently, the market is pushing the 89% percentile or higher in 6 out of 7 valuation metrics.
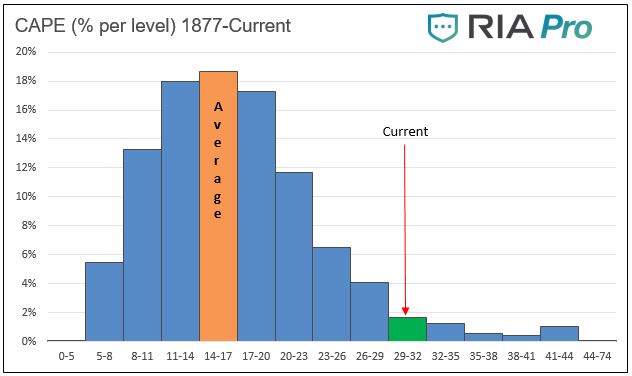
So, just how big of a correction would be required to revert valuations back to long-term means? Michael Lebowitz recently did some analysis for RIA PRO:
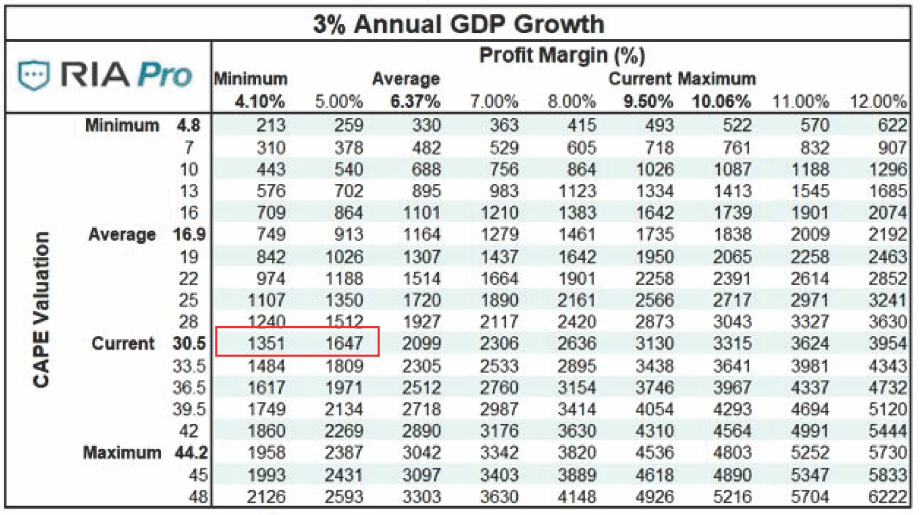
“Since 1877 there are 1654 monthly measurements of Cyclically Adjusted Price -to- Earnings (CAPE 10). Of these 82, only about 5%, have been the same or greater than current CAPE levels (30.5). Other than a few instances over the last two years and two others which occurred in 1929, the rest occurred during the late 1990’s tech boom. The graph below charts the percentage of time the market has traded at various ranges of CAPE levels.”
Given that valuations are at 30.5x earnings, and that profit growth tracks closely with economic growth, a reversion in valuations would entail a decline in asset prices from current levels to somewhere between 1350 and 1650 on the S&P (See table below). From the recent market highs, such would entail a 54% to 44% decline respectively. To learn how to use the table below to create your own S&P 500 forecast give RIA Pro a 14-day free trial run.
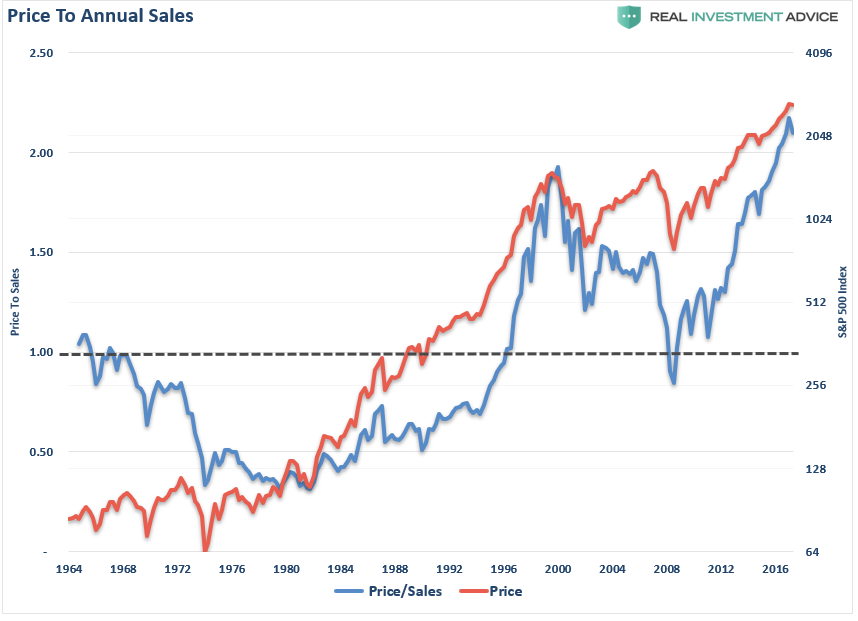
This also corresponds with the currently elevated “Price to Revenue” levels which are currently higher than at any point in previous market history. Given that the longer-term norm for the S&P 500 price/sales ratio is roughly 1.0, a retreat back towards those levels, as was seen in 2000 and 2008, each required a price decline of 50% or more.
Demographics
One of the bigger concerns for the market going forward is the simple function of demographics. Famed demographer, Harry Dent, discussed the impact of the trends within the economy as the mass wave of “baby boomers” become net-distributors from the financial markets (most importantly draining underfunded pension funds) in the future. To wit:
“At heart, I’m a cycle guy. Demographics just happens to be the most important cycle in this modern era since the middle class only formed recently — its only been since World War 2 that the everyday person mattered so much; because now they have $50,000-$60,000 in income and can buy homes over 30 years and borrow a lot of money. This was not the case before the Great Depression and World War 2.
And based on demographics, we predicted that the U.S. Baby Boom wouldn’t peak until 2007, and then our economy will weaken — as both did in 2008. We’ve lived off of QE ever since.”
The issue with the demographics is that they have only gotten markedly worse. Furthermore, the strain on pension funds has only mounted as required returns to sustain their viability have failed to appear. As I discussed previously:
“An April 2016 Moody’s analysis pegged the total 75-year unfunded liability for all state and local pension plans at $3.5 trillion. That’s the amount not covered by current fund assets, future expected contributions, and investment returns at assumed rates ranging from 3.7% to 4.1%. Another calculation from the American Enterprise Institute comes up with $5.2 trillion, presuming that long-term bond yields average 2.6%.
With employee contribution requirements extremely low, averaging about 15% of payroll, the need to stretch for higher rates of return have put pensions in a precarious position and increases the underfunded status of pensions.”
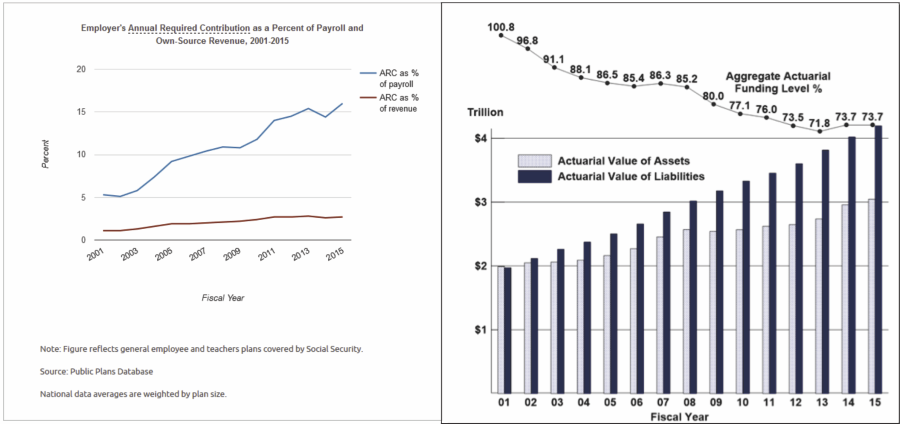
“With pension funds already wrestling with largely underfunded liabilities, the shifting demographics are further complicating funding problems.”
George Will summed it up best:
“The problems of state and local pensions are cumulatively huge. The problems of Social Security and Medicare are each huge, but in 2016 neither candidate addressed them, and today’s White House chief of staff vows that the administration will not ‘meddle’ with either program. Demography, however, is destiny for entitlements, so arithmetic will do the meddling.”
Leverage
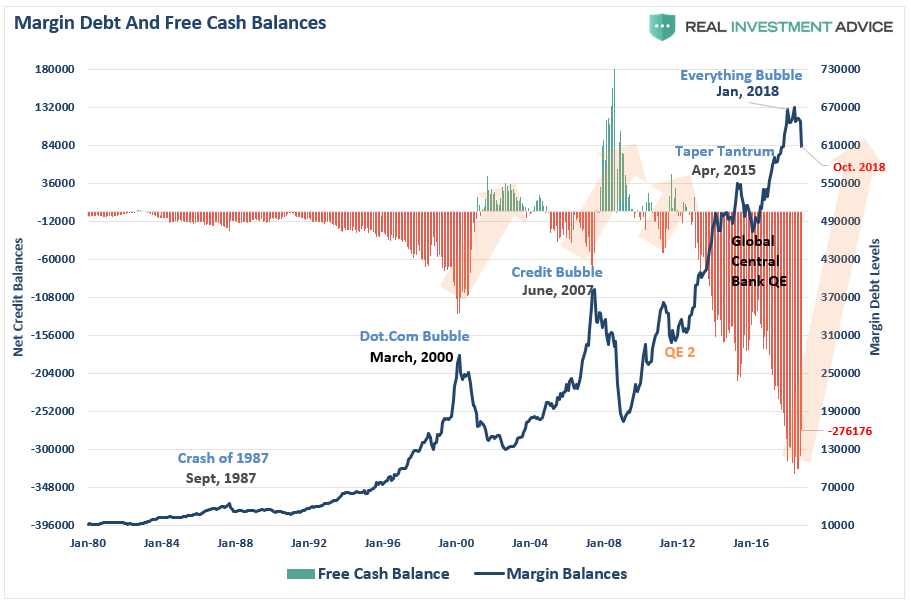
Of course, what fuels corrections is not just a change in investor sentiment, but an ignition of the leverage that exists through the extension of debt. Currently, leverage is near the highest levels on record which is the equivalent of a tank of gasoline waiting on a match. As I discussed last week:
“What is immediately recognizable is that reversions of negative ‘free cash’ balances have led to serious implications for the stock market. With negative free cash balances still at historically high levels, a full mean reverting event would coincide with a potentially disastrous decline in asset prices as investors are forced to liquidate holdings to meet ‘margin calls.’”
Of course, the key ingredient is ownership. High valuations, bullish sentiment, and leverage are completely meaningless if there is no ownership of the underlying equities. The two charts below show both household and corporate levels of equity ownership relative to previous points in history.
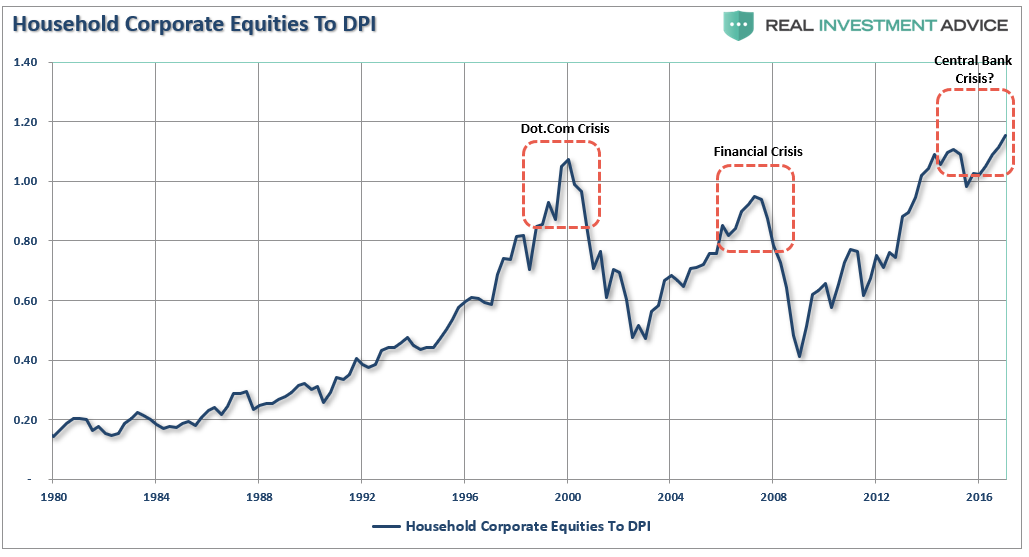
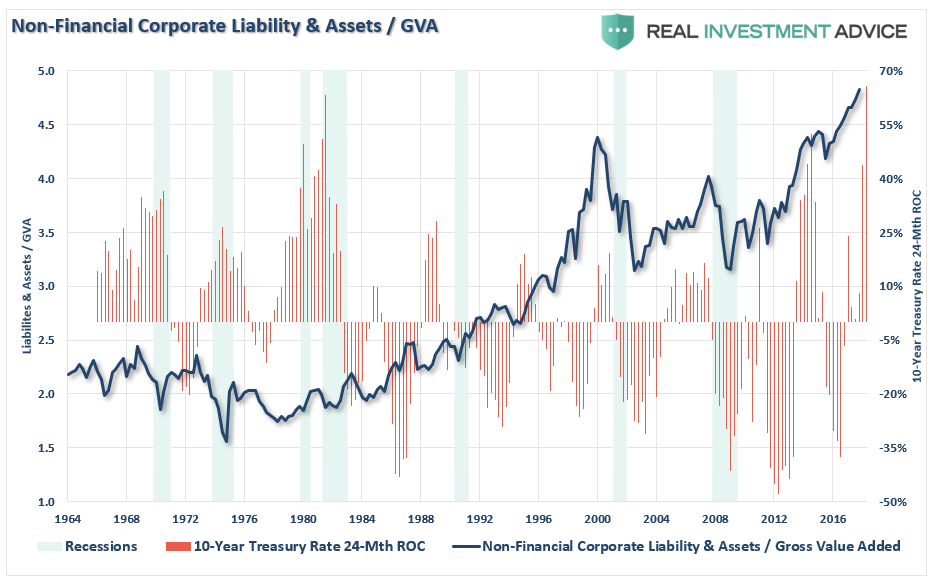
As can be clearly seen, leverage fuels both halves of the full market cycle. On the way up, increases in leverage provide the capital necessary for accelerated share buybacks and increased speculation in the markets. Leverage, like gasoline, is inert until a catalyst is applied. It is the unwinding of that leverage that accelerates the liquidation of assets in the markets causes prices to plunge faster and further than most can possibly imagine.
It has only happened twice already since the turn of the century, and both reversions of that leverage resulted in 50% declines. Yet, less than a decade from the last crash, with margin debt at near historic records, investors have once again fallen prey to excessive exuberance and the belief that somehow this time will most assuredly be different.
Momentum
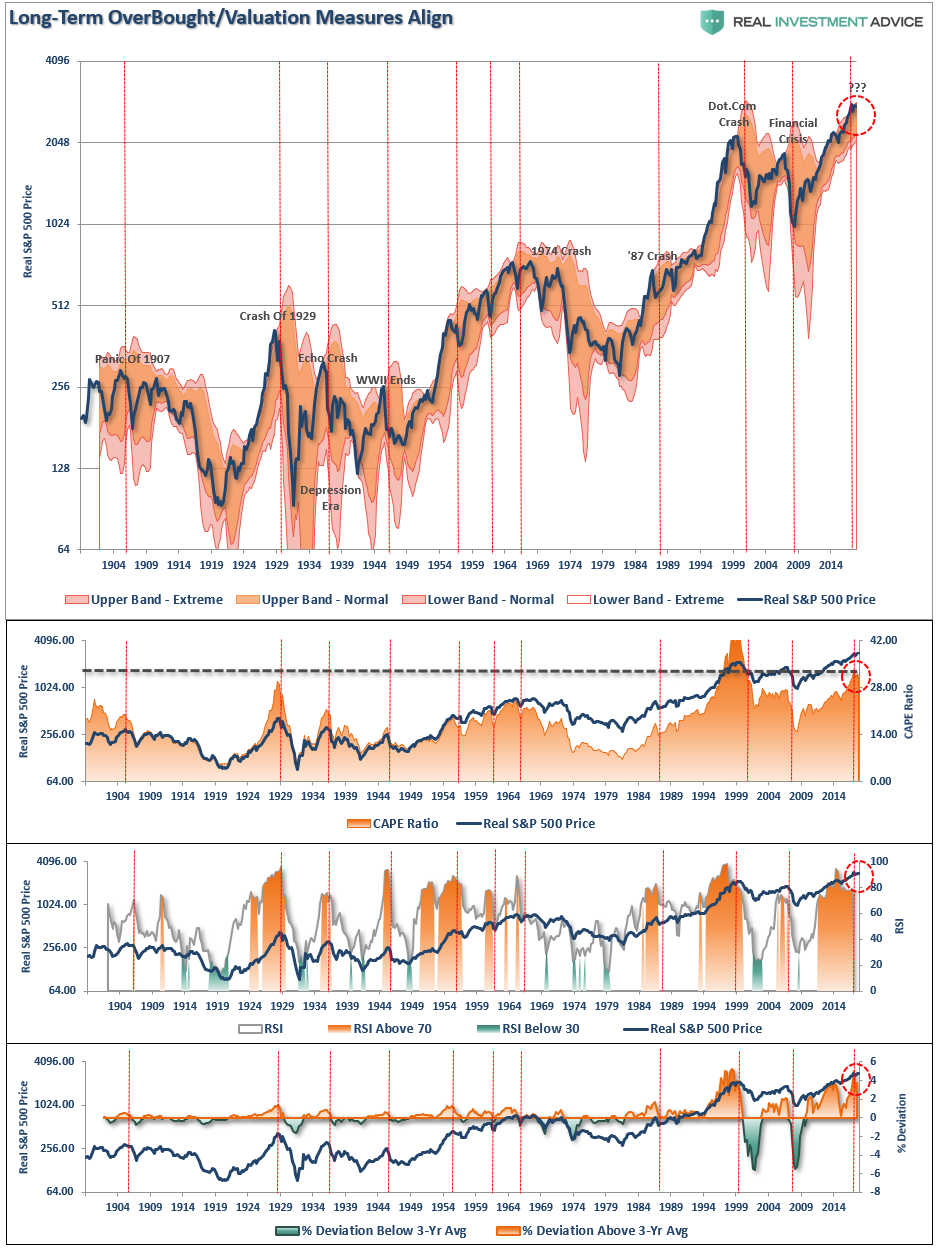
Another key ingredient to rising asset prices is momentum. As prices rise, demand for rising assets also rises which creates a further demand on a limited supply of assets increasing prices of those assets at a faster pace. Rising momentum is supportive of higher asset prices in the short-term. However, the opposite is also true.
The chart below shows the real price of the S&P 500 index versus its long-term Bollinger-bands, valuations, relative-strength, and its deviation above the 3-year moving average. The red vertical lines show where the peaks in these measures were historically located.
The Fed’s Got It Under Control
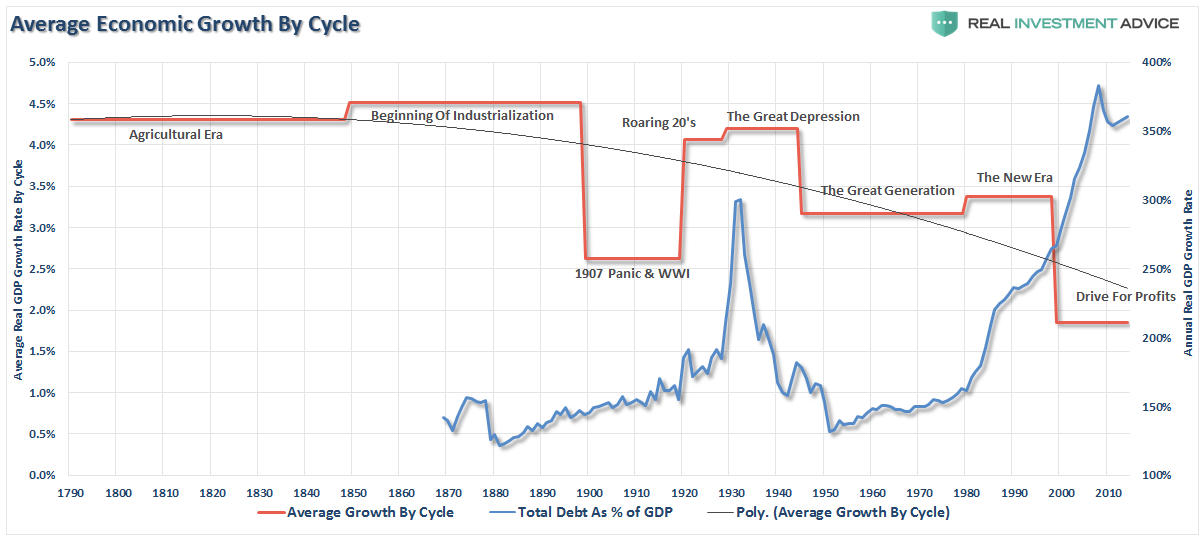
This “Utopian” belief of infinite stability within the financial markets is due to ongoing Central Bank interventions and is a most dangerous concept. This is particularly the case given the structural and economic shifts in the economy due to the rise in debt which has derailed the efficient allocation of capital. As shown below, the economy is currently mired at the lowest average annual growth rate since 1790. (Data courtesy of Measuring Worth)
As a portfolio strategist, what concerns me most is NOT what could cause the markets rise, as we are still somewhat invested, but what could lead to a sharp decline that would negatively impact investment capital.
[Important Note: It is worth remembering that winning the long-term investment game has more to do with avoidance of losses than the capturing of gains. It is a function of math.]
What causes the next correction is always unknown until after the fact. However, there are ample warnings that suggest the current cycle may be closer to its inevitable conclusion than many currently believe. There are many factors that can, and will, contribute to the eventual correction which will “feed” on the unwinding of excessive exuberance, valuations, leverage, and deviations from long-term averages.
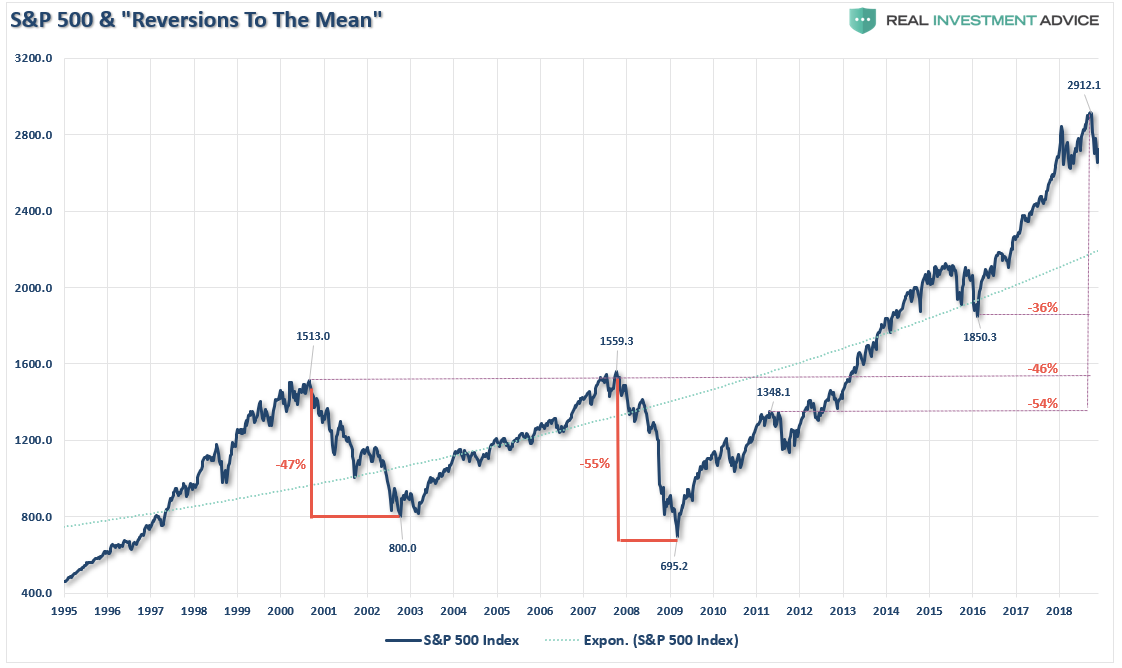
The biggest risk to investors currently is the magnitude of the next retracement. As shown below the range of potential reversions runs from 36% to more than 54%.
That can’t happen you say?
It’s happened twice before in the last 20 years and with less debt, less leverage, and better funded pension plans.
More importantly, notice all three previous corrections, including the 2015-2016 correction which was stopped short by Central Banks, all started from deviations above the long-term exponential trend line. The current deviation above that long-term trend is the largest in history which suggests that a mean reversion will be large as well.
It is unlikely that a 50-61.8% correction would happen outside of the onset of a recession. But considering we are already pushing the longest economic growth cycle in modern American history, such a risk which should not be ignored.
There is one important truth that is indisputable, irrefutable, and absolutely undeniable: “mean reversions” are the only constant in the financial markets over time. The problem is that the next “mean reverting” event will remove most, if not all, of the gains investors have made over the last five years.
Still don’t think it can happen?
“Stock prices have reached what looks like a permanently high plateau. I do not feel there will be soon if ever a 50 or 60 point break from present levels, such as they have predicted. I expect to see the stock market a good deal higher within a few months.” – Dr. Irving Fisher, Economist at Yale University 1929


Lance Roberts is a Chief Portfolio Strategist/Economist for Clarity Financial. He is also the host of “The Lance Roberts Podcast” and Chief Editor of the “Real Investment Advice” website and author of “Real Investment Daily” blog and “Real Investment Report“. Follow Lance on Facebook, Twitter, Linked-In and YouTube


