Although the EIA weekly report showed that crude oil inventories dropped for a ninth straight week and distillate stockpiles fell more than expected, U.S. production outweighed positive news. But did yesterday price action change anything in the technical picture of black gold?
Yesterday’s report showed that crude inventories dropped by 6.9 million barrels easily beating expectations for a decrease of 3.5 million barrels. This significant decline was mainly led by a record drawdown of 4.2 million barrels at the U.S. storage hub in Cushing, Oklahoma. What’s interesting, it was the largest weekly draw since 2004. Despite this bullish fact and a decline in distillate stockpiles, U.S. crude oil production rose 258,000 barrels per day to 9.75 million bpd last week, which means that the barrier of 10 million bpd could be broke quite easily in the coming week.
This also suggests that we may see short-lived moves in both directions before the release of another government report as investors may want to wait for a significant fundamental factor that would sink the price of black gold before opening big short positions.
Nevertheless, such a pro-bearish signal that could trigger a move to the downside may also be today’s Baker Hughes report. If it shows a bigger increase in the number of oil rigs, oil bears will likely react before today’s market closure or on Monday – similarly to what we saw in the past.
Before we see how the number of oil rigs changed in the recent week, let’s check how yesterday’s price action influenced the technical picture of crude oil.

Crude Oil’s Technical Picture
The long-term hasn’t changed much since our Wednesday alert was posted, therefore, if you haven’t had the chance to read about the broader perspective, we encourage you to do so today. Today, just like yesterday, we’ll focus on the daily chart (charts courtesy of http://stockcharts.com).
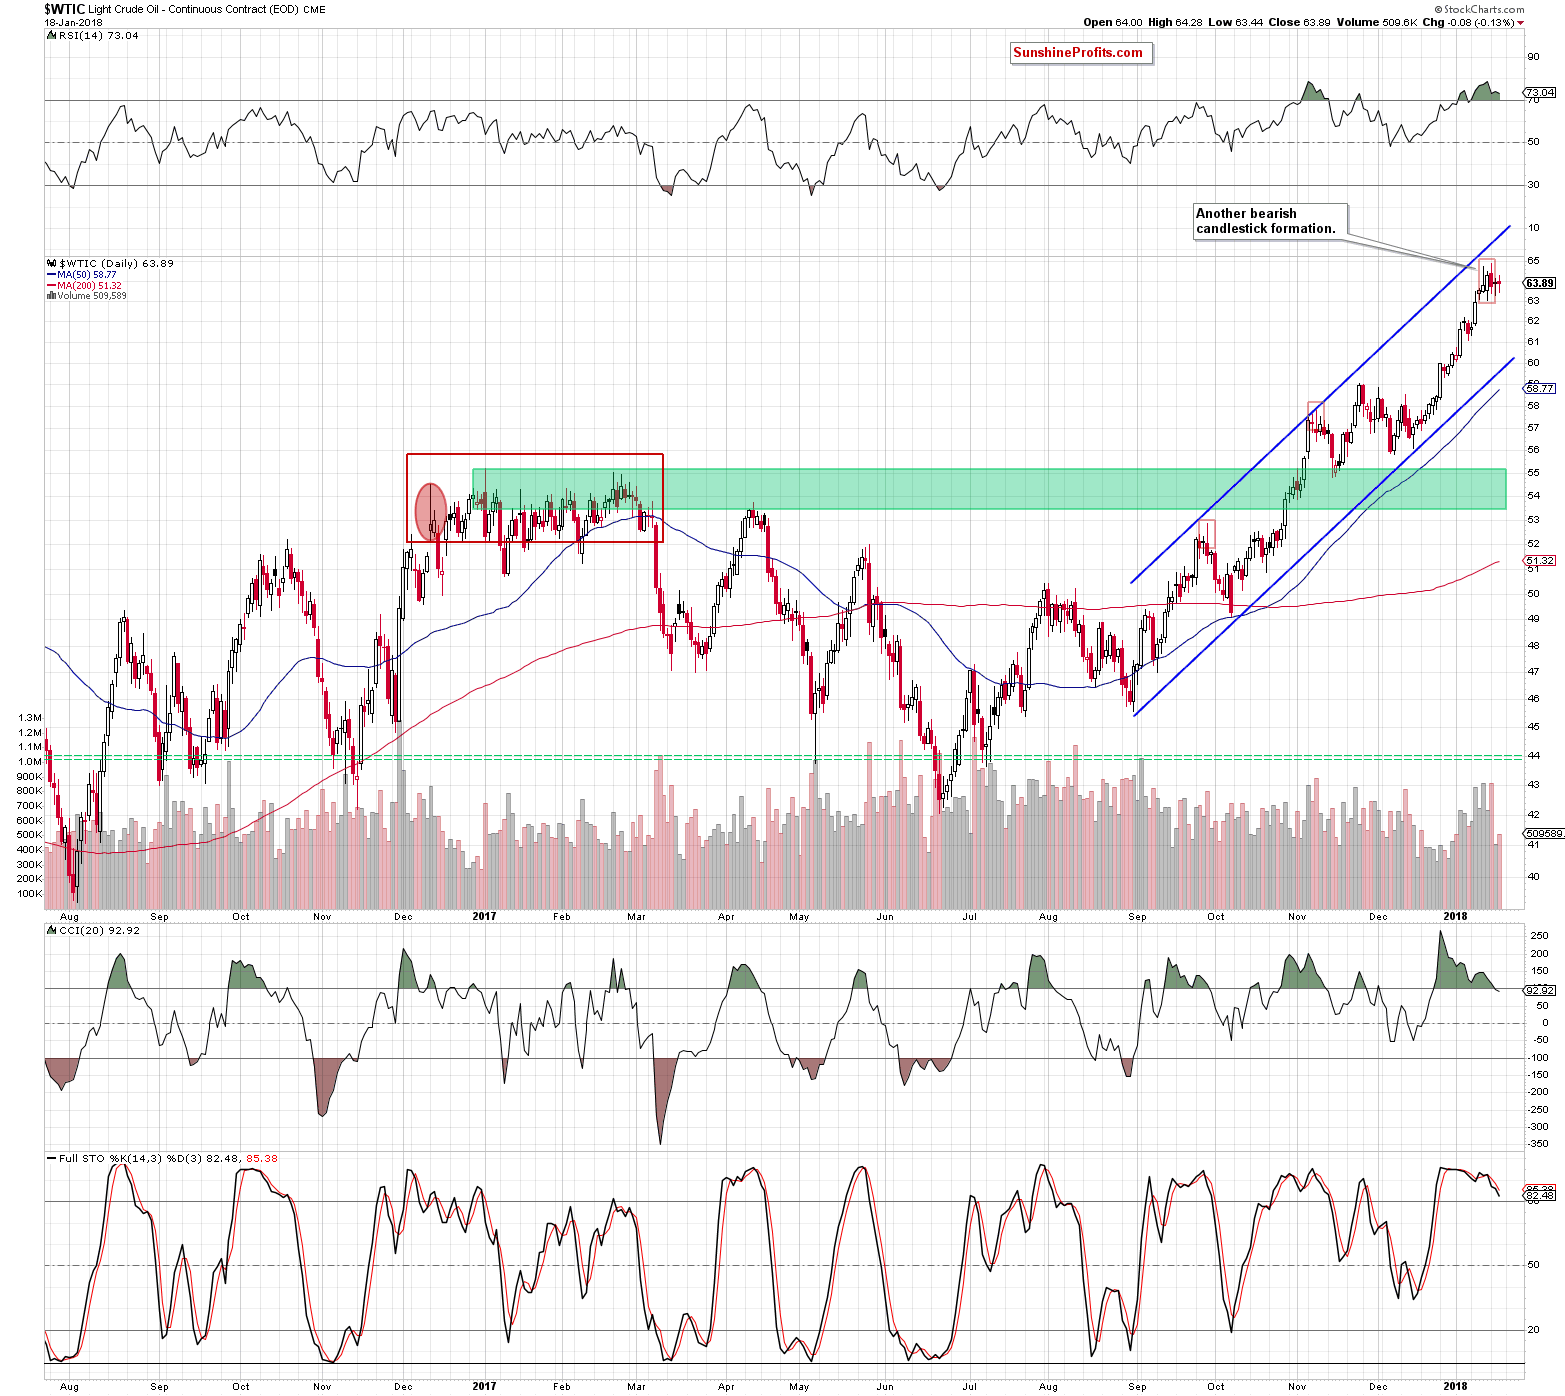
From today’s point of view, we clearly see that the overall situation in the very short term also hasn’t changed much, because crude oil wavered the second day in a row, which resulted in another doji candle. Taking this fact into account, we believe that what we wrote yesterday remains up-to-date also today:
(…) Although neither oil bulls nor oil bears show an advantage yesterday, two bearish candlestick formations remain in the cards, strengthening the resistance zone created by the 200-month moving average at $65.09. Additionally, the CCI joined the Stochastic Oscillator and generated a sale signal, giving oil bears another reason to act.
On top of that, volume was tiny compared to what we saw in the previous days, which confirms oil investors’ indecision regarding the direction of the next move. Therefore, waiting at the sidelines for more clear signals without open positions seems to be the best decision (…)
Taking into account the technical picture of crude oil, we think that oil bears have more arguments on their side to take control on the market. Nevertheless, it seems to us that as long as investors do not see a strong bearish fundamental factor (…), the price of black gold will be wavering in a narrow range under the 200-month moving average.
Finishing today’s alert, we would like to add two more comments to the technical picture of the commodity after yesterday’s session.
Firstly, the size of volume that accompanied yesterday’s price action was slightly higher than the day before, which suggests that investors could return to the market to start closing their long positions. It was not a hard sell off, because crude oil lost only 0.13% compared to the previous session, however, such price action raises doubts about the continuation of the upward move in the coming week.
Secondly, we would like to share a short note about the doji candle with you. If the market moves in a horizontal trend or potential decreases (just like in our case) are only in the initial phase, the doji candle is not very important. However, if the doji appears on the chart after a long upward or downward trend, there is a high probability that we will see a pullback or even a reversal of the current trend in the near future.
If you enjoyed the above analysis and would like to receive daily premium follow-ups, we encourage you to sign up for our Oil Trading Alerts. Sign up today.
Thank you.
Nadia Simmons
Forex & Oil Trading Strategist
Przemyslaw Radomski, CFA
Founder, Editor-in-chief, Gold & Silver Fund Manager
Gold & Silver Trading Alerts
Forex Trading Alerts
Oil Investment Updates
Oil Trading Alerts


