Oil Stocks – For the Bulls or Bears?
Based on Oil Investment Update originally published on Apr 3, 2017, 2:26 PM
Without a doubt, the previous week was the best week of 2017 for oil bulls. In that time, the black gold gained 5.48% and invalidated the earlier breakdown under the psychologically important barrier of $50. What happened at the same time with oil stocks? What’s next for the XOI? Let’s jump right into charts (chart courtesy of http://stockcharts.com) and find out what can we infer from them about future moves.
Let’s start today’s article with the long-term chart of oil stocks.

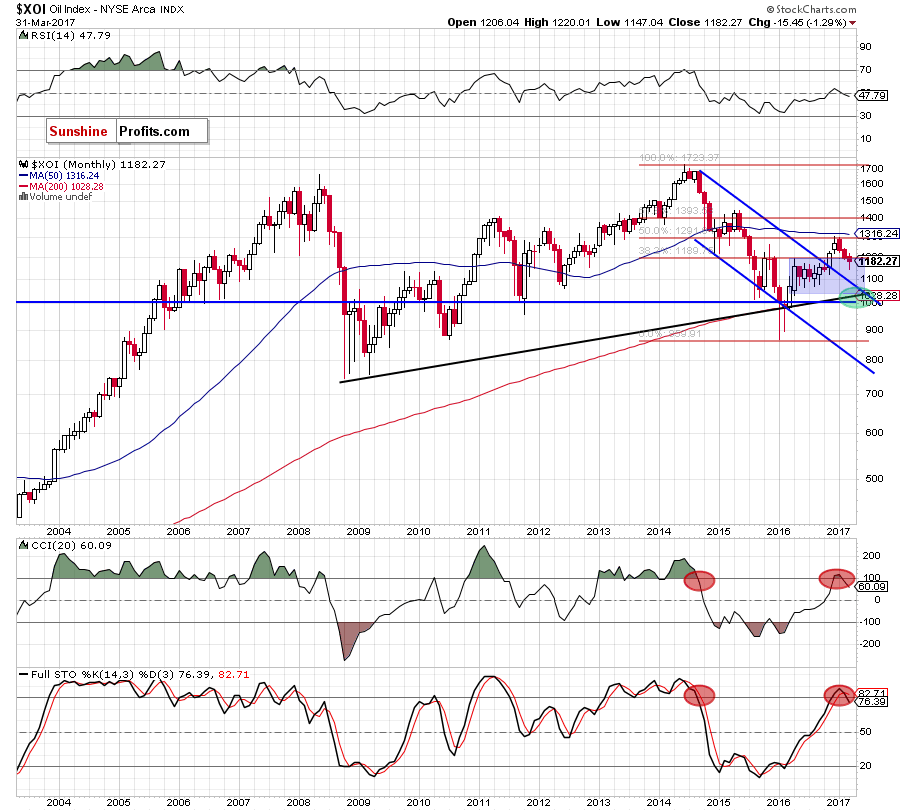
On the long-term chart, we see that oil stocks moved lower in the previous month, which resulted in a drop below the previously-broken upper border of the clue consolidation. This is a negative development, which suggests further deterioration – especially when we factor in the sell signals generated by the CCI and the Stochastic Oscillator.
How did this drop affect the medium-term picture? Let’s check.
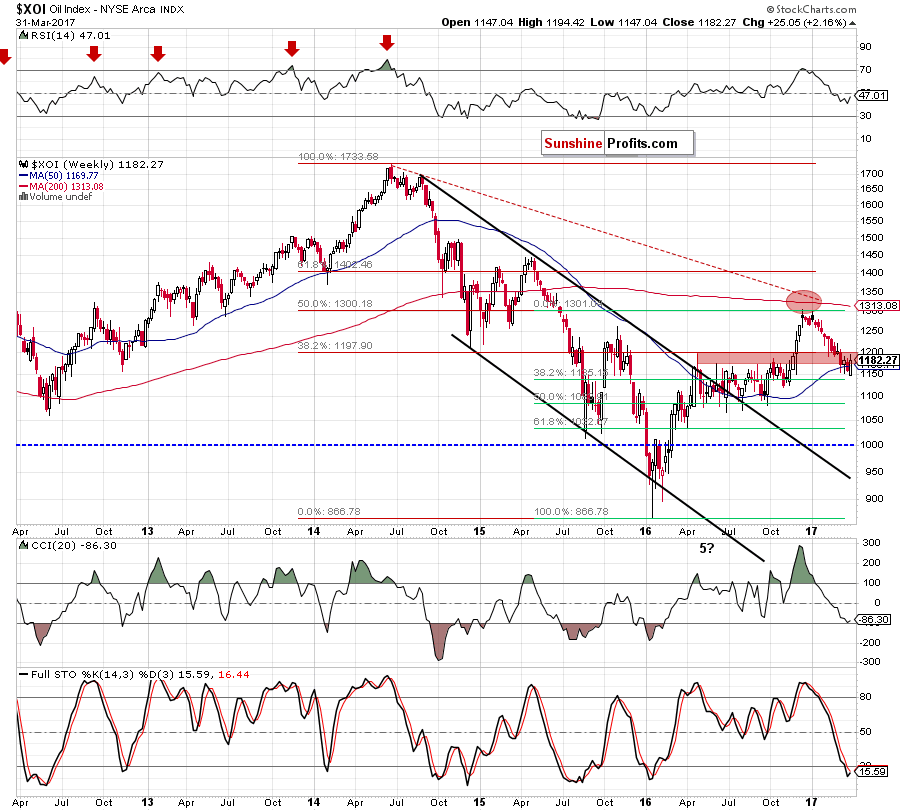
From this perspective, we see that the last month’s decline took the XOI below the April 2016 high and the previously-broken red zone, which serves now as resistance. This suggests that as long as there is no breakout (and a weekly closure) above this area further improvement is questionable.
Will we see another increase in the coming month? Let’s examine the daily chart and look for more clues about future moves.
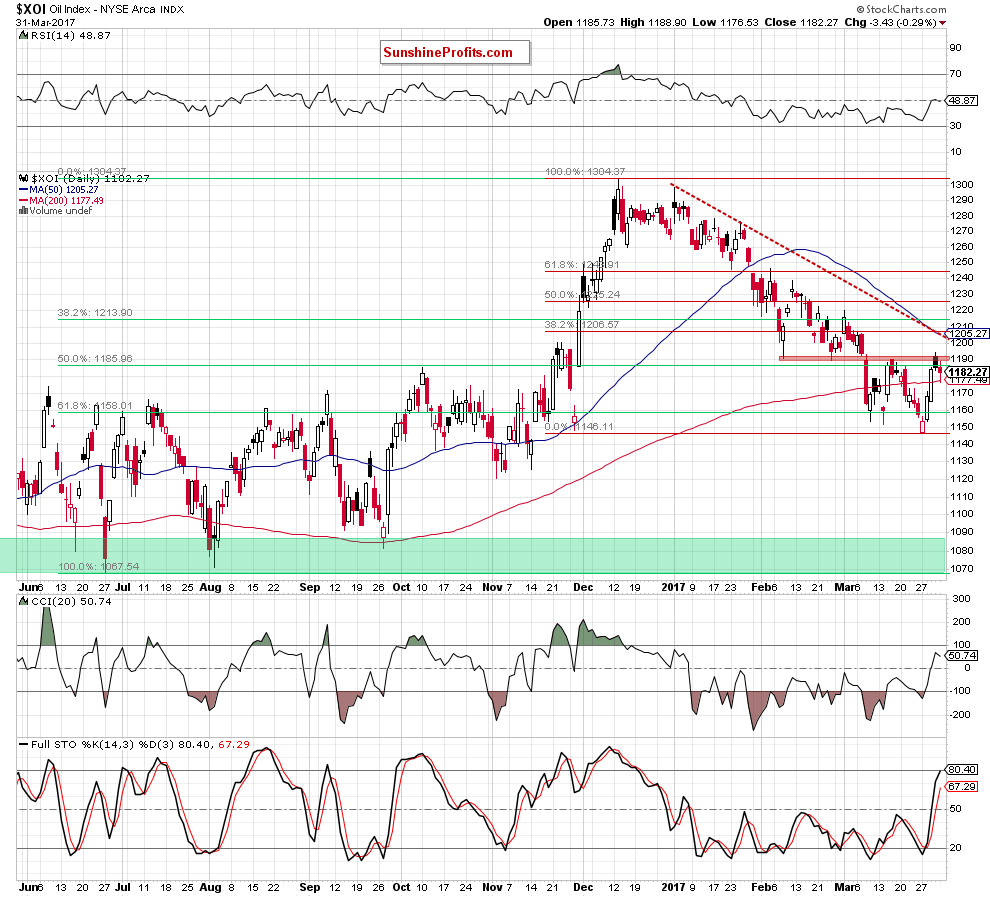
On the daily chart, we see that oil stocks rebounded in the previous week, which resulted in a climb to the red resistance zone based on the February lows. As you see, this area stopped oil bulls in two times in March, which suggests that may see a similar price action in the coming days.
Nevertheless, even if the XOI moves a bit higher, the space for increases seems limited as quite close from current levels we can notice the 38.2% Fibonacci retracement based on the entire December – March downward move and the red declining dashed line based on the January highs, which together could encourage oil bears to act.
If this is the case, we’ll see a re-test of the 61.8% Fibonacci retracement and the recent lows in the coming days. If this area is broken, the next downside target will be around 1,120-1,125, (the November lows) or even around 1,067-1,100, where the next psychologically important barrier, the June, July, September 2016 lows and the 50% Fibonacci retracement are. It is also worth noting that this support area is currently also reinforced by the previously-broken upper border of the blue declining trend channel seen on the monthly chart.
Summing up, the outlook for oil stocks is currently bearish as the XOI invalidated the earlier breakout above the upper border of the blue consolidation (seen on the monthly chart) and the red resistance zone (marked on the weekly chart), which suggests another attempt to move lower and a test of the recent lows in the coming days. If you would like to know more about oil market and our interesting ratios, we encourage you to sign up for Oil Investment Update, Oil Trading Alerts or the All-Inclusive Package that includes them.
Thank you.
Nadia Simmons
Forex & Oil Trading Strategist
Oil Investment Updates
Oil Trading Alerts


