One month after the February stock market rout is an excellent time to step back and review all the facts – and their implications for the gold market. Here’s exactly what happened – and what it implies for your capital allocation.
- After more than a year of continuously advancing, the S&P 500 fell nearly 10 percent in five days.
- The sell-off was allegedly triggered by the surprisingly strong January jobs report, showing the acceleration in wage growth. That released fears of higher inflation, which could prompt the Fed to tighten its stance further. As President Trump rightly pointed out (on Twitter, of course):
in the “old days,” when good news was reported, the Stock Market would go up. Today, when good news is reported, the Stock Market goes down.
- The stock market correction came on top of bond market tumble. The 10-year Treasury yield jumped from 2.72 percent on January 31 to 2.84 percent on February 2. Analysts claim that bond yields also spiked due to inflation concerns.
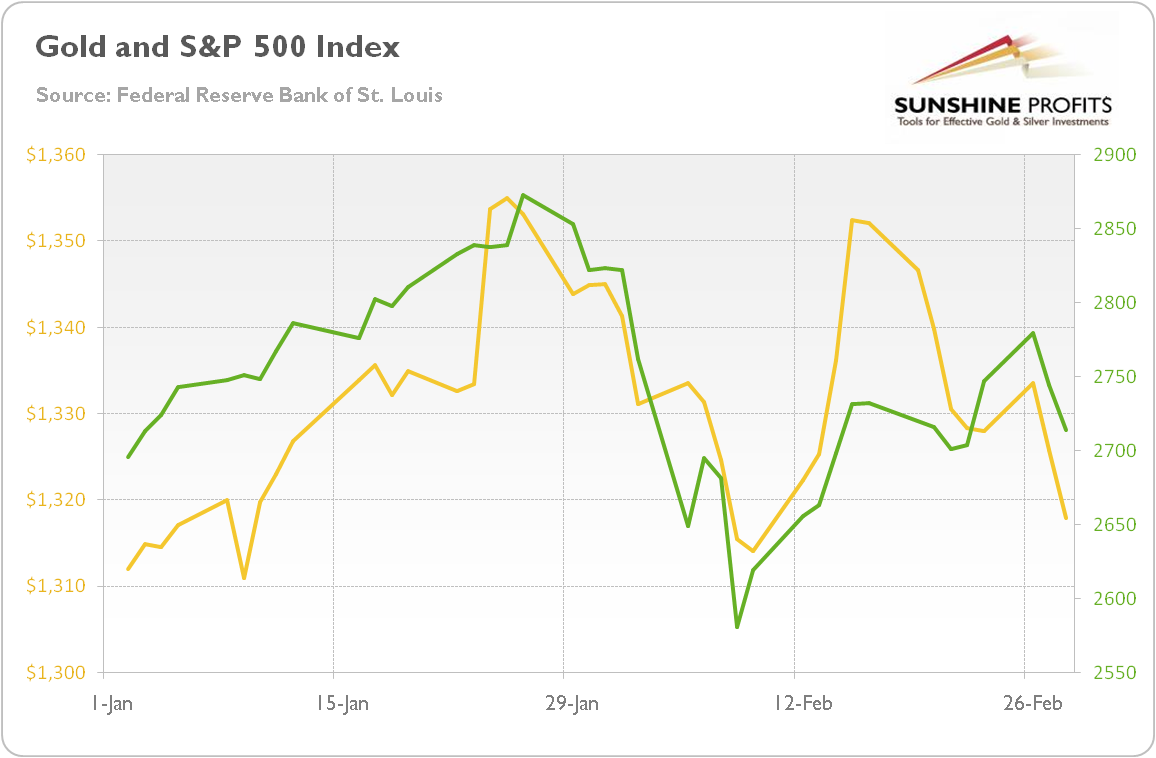
- Gold didn’t offer a hedge against stock market turmoil. Instead, it shared with equities the fears against a more hawkish Fed and moved in tandem with stocks, as one can see in the chart below. The correlation between these two assets this year is about 0.6, which is pretty high.
Chart 1: Gold prices (yellow line, left axis, London P.M. Fix, in $) and S&P 500 Index (green line, right axis) from January 1, 2018 to February 28, 2018.

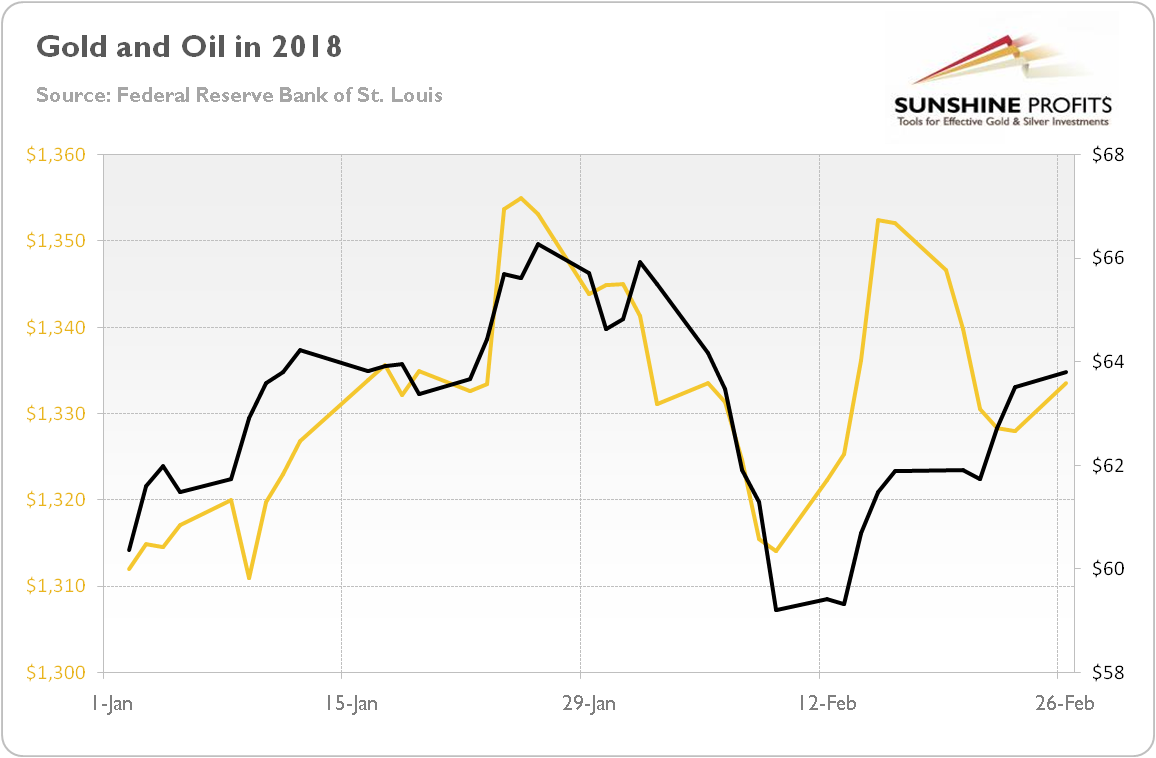
These are facts. But what do they imply for the future? Are they changing the economic outlook? Not really. First of all, fears of inflation are clearly exacerbated. Just look what happened to the oil prices in February. It doesn’t suggest that enormous inflation is coming. And it doesn’t bode well for bullion, given the strong correlation (almost 0.6 – see also the chart below) between the yellow and black gold in 2018.
Chart 2: Gold prices (yellow line, left axis, London P.M. Fix, in $) and oil prices (black line, right axis, WTI, in $) from January 1, 2018 to February 26, 2018.
And the basic rule of fundamental investing is to not overreacting to a single government report (or any statistics), especially to January data, as they are often revised later.
Second, we don’t deny that yields increased. This is a hard fact. But what really matters is why they rose. As a reminder, the nominal interest rates can be split into real interest rates and inflation premium. The data clearly says that inflation expectations weren’t the key driver lifting the 10-Treasury yields. Actually, they dropped, as one can see in the chart below, which paints the 10-year breakeven inflation rate, i.e. the difference between 10-year Treasury yields and 10-year Treasury yields indexed by inflation).
Chart 3: 10-year breakeven inflation rate (the difference between 10-Year Treasury Constant Maturity Securities and 10-Year Treasury Inflation-Indexed Constant Maturity Securities, in %) from January 1, 2018 to February 14, 2018.
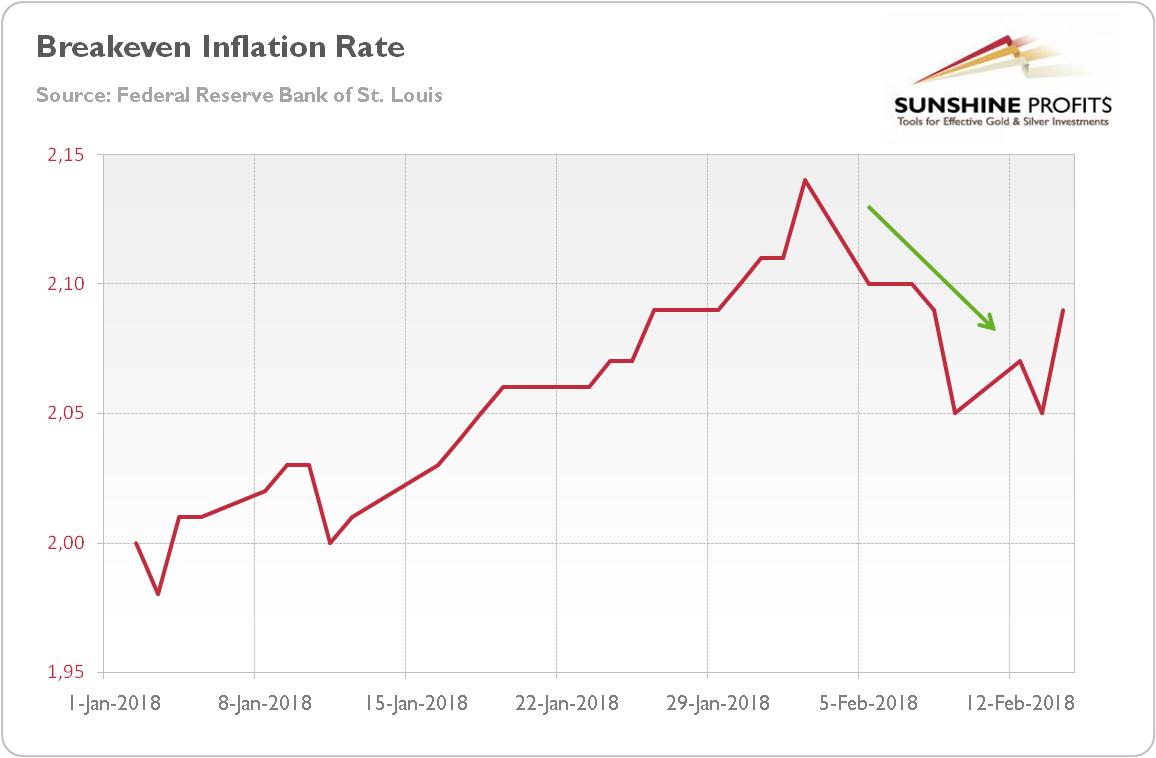
It means that, contrary to popular narrations, the bond yields didn’t jump because of inflation fears. Instead, the real interest rates soared, pulling nominal yields higher. Now, the question is: why did the real rates increase?
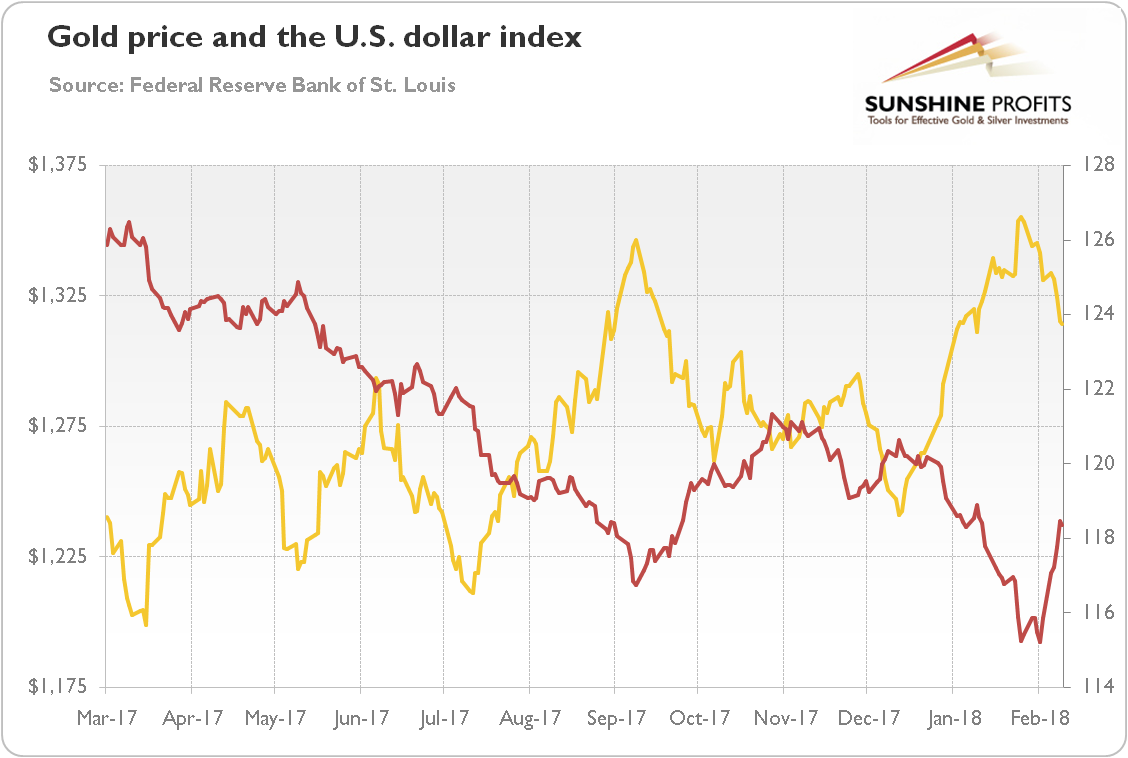
Some analysts believe that they rose, as investors expected acceleration in the economic growth. It might be the case, as the U.S. dollar strengthened during the bond market turmoil and the stock market rout, as the next chart shows. If true, bad times are approaching for gold, as higher yields are not worrying if they signal global growth and a return to normalcy.
Chart 4: Gold prices (yellow line, left axis, London P.M. Fix, in $) and the Broad Trade Weighted U.S. Dollar Index (red line, right axis) from March 2017 to February 2018.
However, there might be another explanation. You see, tectonic shifts in the supply and demand for Treasuries are unfolding. The Fed unwinds its purchases, while the Congress unwisely widens the fiscal deficit (tax cuts and higher expenditure do the job), boosting issuance of bonds. The combination of weaker demand and stronger supply implies higher yields. In this scenario, gold could shine – despite the higher real interest rates. The fears of higher fiscal deficit – or even a twin deficit – may explain the recent breakdown of the well-established highly negative correlation between gold and real interest rates. Adding to the deficit when the economy is growing above the trend isn’t the smartest fiscal policy – but, hey, this is when gold enters the scene, as a hedge against policymakers’ foolishness.
Summing up, a few weeks have passed since the stock market sell-off. It is a good time to look from the distance. Contrary to many alarmist opinions, the sky is not falling. Inflation is not skyrocketing. The interest rates have been rising, but together with corporate earnings. Hence, the correction was needed, but the fundamentals remain healthy – and the stock market has more upside laying out before itself. It means that neither inflation nor the stock market bear market is likely to support the price of the yellow metal. Luckily, the unsound U.S. fiscal policy and the greenback are now doing both doing a good job. Two real friends of gold.
If you enjoyed the above analysis and would you like to know more about the most important macroeconomic trends influencing the price of gold, we invite you to read the March Market Overview report. If you’re interested in the detailed price analysis and price projections with targets, we invite you to sign up for our Gold & Silver Trading Alerts. If you’re not ready to subscribe yet and are not on our gold mailing list yet, we urge you to sign up. It’s free and if you don’t like it, you can easily unsubscribe. Sign me up!
Thank you.
Arkadiusz Sieron, Ph.D.
Sunshine Profits‘ Gold News Monitor and Market Overview Editor
Gold News Monitor
Gold Trading Alerts
Gold Market Overview


