Investors can’t rely on the income statement and balance sheet alone to tell the whole story of a company’s profitability. Too often, these financial statements can be distorted by accounting rule changes, non-operating items, and other red flags buried in the footnotes. Investors need to analyze the footnotes and management discussion and analysis (MD&A) in order to truly understand the economics of a company.
We first put this stock in the Danger Zone in April 2017. Since then, the stock has outperformed the S&P 500 based, primarily, on the market’s optimism over the company’s transition to the cloud. However, our research shows that the company’s earnings growth is an accounting mirage, its cloud prospects are overhyped, and its valuation implies an unrealistic level of growth. Verint Systems (VRNT) is back in the Danger Zone.
Profit Growth Is a Mirage
Verint operates in a number of IT and software segments, but its key business is workforce engagement solutions, i.e. call center software. In recent years, this business shifted from primarily on-premise – where Verint had a virtual duopoly along with Nice Systems (NICE) – to a cloud-based model that has opened up significant new competition.
As a result of this increased competition, the company’s after-tax operating profit (NOPAT) margin declined from 12% in 2013 to 3% in 2017. NOPAT declined from $111 million to $29 million over the same timeframe.
Profits and margins appeared to rebound significantly in 2018. VRNT’s NOPAT in 2018 was $91 million, and its margin was 7%. However, buried on page 83, the company acknowledged that its profit was boosted by $51 million due from the change in revenue recognition standards, ASU 2014-09. Figure 1 shows that NOPAT growth was minimal without this accounting boost.

Figure 1: VRNT NOPAT With and Without Accounting Rule Change: 2013-TTM
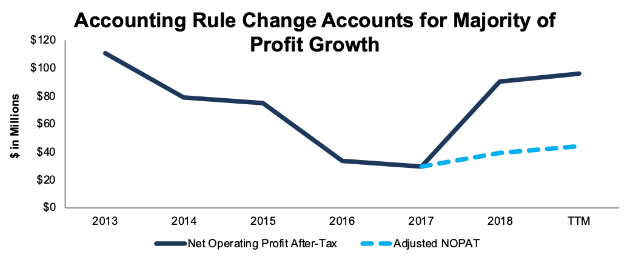
Sources: New Constructs, LLC and company filings.
The adoption of ASU 2014-09 increased Verint’s reported profits in two key ways:
- The company accelerated the recognition of $48 million in additional revenue.
- The company capitalized commissions paid for obtaining long-term contracts, which reduced SG&A expense by $14 million compared to the previous standard.
These benefits were partially offset by higher cost of sales and income tax expense.
Normally, we would make an adjustment to account for the impact of a new accounting rule change. However, ASU 2014-09 represents a complete overhaul of the revenue recognition process, to the point where there’s no way for us to fully disaggregate and adjust for its impact across all companies. Our only choice is to accept this new standard as the default going forward and study disclosures to see where it distorts profits. Clearly, investors need to be on the lookout for companies – like Verint – with unusual changes to their income statement in 2018 based on this new rule.
Management Focused on the Wrong Targets
In the section of Verint’s 10-K regarding the new standard, one item, apart from the impact on revenue and profits, stood out. On page 82, Verint wrote:
“While the table below indicates that calculated revenue for the year ended January 31, 2019 without the adoption of ASU No. 2014-09 would have been lower than the revenue we are reporting under the new accounting guidance, this lower calculated revenue results not only from the impact of the new accounting guidance, but also from changes we made to our business practices in anticipation and as a result of the new accounting guidance.”
The company admitted they modified their business practices solely for the purpose of hitting accounting targets and not for the purpose of maximizing cash flows. When management is focused on accounting numbers rather than on the actual underlying business, bad things happen (see: Valeant and Enron).
Verint’s use of one of our least-favorite metrics – Adjusted EBITDA – as the basis for long-term executive compensation adds further concern to a clearly mis-incentivized management team. By excluding balance sheet costs, Adjusted EBITDA incentivizes companies to grow through overpriced acquisitions that destroy value for shareholders. Verint has carried out ~$1 billion (47% of invested capital) in acquisitions over the past five years. Figure 2 shows that these acquisitions increased Adjusted EBITDA from $268 million in 2015 to $297 million in 2018. On the other hand, economic earnings, the true cash flows of the business, declined from -$38 million to -$62 million over the same time.
Figure 2: Economic Earnings vs. Adjusted EBITDA: 2015-2018
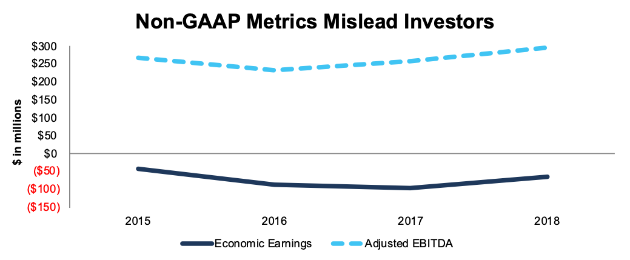 Sources: New Constructs, LLC and company filings.
Verint’s Adjusted EBITDA is especially misleading because it includes non-operating income from acquisitions while excluding their costs. In 2018, Verint excluded $10 million in acquisition costs from its Adjusted EBITDA calculation, but made no adjustment for the $4 million in non-operating income earned from changes in the value of contingent considerations.
Lagging Behind Key Peers
Verint’s gaming of accounting rule changes and its reliance on non-GAAP metrics allows the company to maintain the illusion that it is still a leader in its industry when in fact it has fallen behind the competition. Figure 3 shows that Verint used to earn a similar return on invested capital (ROIC) to Nice, but since 2014 a significant gap has emerged between the two companies. Over the trailing twelve months (TTM) period, Verint earned an ROIC of 4%, less than half of Nice’s 9% ROIC.
Figure 3: ROIC Since 2011: VRNT vs. NICE
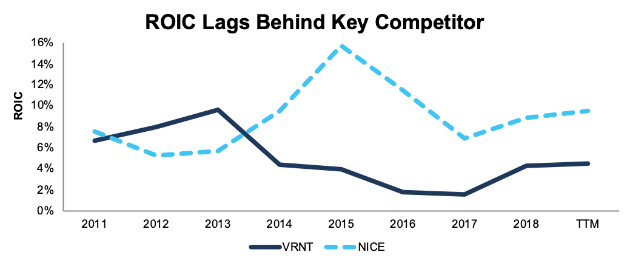
Sources: New Constructs, LLC and company filings.
Data from Gartner Peer Insights also shows that Verint trails Nice in terms of customer satisfaction for its core workforce engagement management solution. Nice has also been taking market share from Verint. Over the past five years, Nice has grown revenue by 9% compounded annually compared to 6% for Verint. Nice’s revenue is up 9% TTM compared to 8% for Verint.
In the larger field of CRM customer engagement, Verint only ranks as a “Niche Player” behind established names such as Oracle (ORCL) and Salesforce (CRM), as well as smaller companies like Zendesk (ZEN). See Figure 4.
Figure 4: Verint Ranks Far Behind the Leaders in Customer Engagement
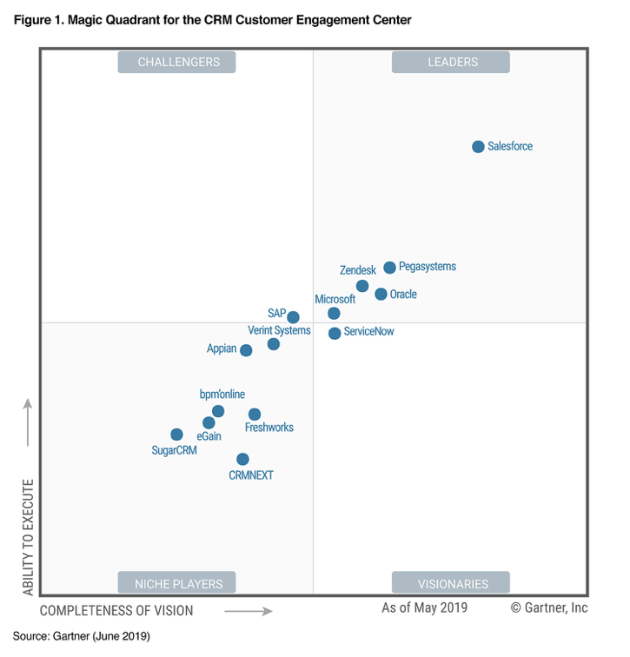
Sources: Gartner Insights
Verint has the unfortunate distinction of being in 2nd place in its core business, and it’s one of many niche competitors in its other business lines.
Management’s Resistance to Change Adds Risk
Despite the company’s declining cash flows and trailing position in its industry, Verint’s management team has resisted calls for change. Earlier this year, major shareholder Neuberger Berman initiated a proxy fight to get three new directors on the board. Verint rejected the proposal and ultimately resolved the dispute by promising to add one new director later this year, without making any material commitments to change its business practices.
In addition, the company rejected a call from shareholders to add ROIC as a performance metric in is most recent proxy statement. The company’s official response to this proposal was:
“We recognize that ROI and ROIC have a strong correlation to TSR, however we do not currently use ROI as an internal performance management measurement and believe that where possible compensation metrics should match the day to day metrics used to run the business.”
The management team admits that ROIC is a key driver of long-term shareholder value, but they don’t give any reason for deciding not to use it as either an internal or external performance metric. Most likely, they don’t want to use ROIC because it’s harder to manipulate, or improve through acquisitions, than their existing metrics.
Management can get away with this lack of shareholder engagement in part due to the backing of Wall Street. All five sell-side analysts covering the stock rate it a “Strong Buy”, and they have a consensus price target of $72/share – a 32% upside from the current stock price.
It’s no wonder Wall Street loves Verint. Acquisitions generate plenty of fees for investment bankers. Investors need to look beyond conflicted sell-side research to understand the real struggles this company faces.
Lack of Disclosure Harms Investors
In addition to its declining profitability, Verint has faced criticism for its lack of adequate disclosure. The company has made some improvements on this front, but it still fails to disclose a number of important metrics, including:
- Organic revenue growth
- Cloud-based revenue margins
- Customer renewal rate
The lack of disclosure for this last metric is especially worrisome given that Verint specifically guided to >90% renewal rate going forward in their 4Q earnings call. How are investors supposed to assess whether the company is hitting its targets if it doesn’t disclose this metric? Even if Verint does begin disclosing this metric going forward, investors won’t be able to tell if trends in renewal rates are improving or getting worse.
Overall, the lack of disclosure makes it difficult to believe the company’s claims about its turnaround and success of the transition to the cloud.
Bull Case: Cloud Transformation Overhyped
The bull case for Verint rests on the shift to a cloud-based model. Bulls believe that this shift will improve margins and lead to a more stable business as the company develops a recurring revenue base.
If one just looks at the income statement, it might seem as if this transition is on the right track. “Service and Support” revenue, which investors usually interpret as recurring, represented 63% of sales in 2018, up from 54% in 2014. However, the footnotes show that only 51% of total revenue is actually recurring. In the core Customer Engagement segment, just 19% of revenue is classified as “Cloud” revenue.
Verint only added the disclosures for recurring revenue and cloud revenue last year, so we have no way to evaluate the trend in these numbers over time. We don’t think many investors would be impressed with just half of revenue being recurring and just 1/5th of revenue in the core segment coming from the cloud, though.
Bulls will also point to gross margins, which improved from 61% in Q1 2018 to 64% in Q1 2019, as evidence for the success of the cloud shift. A look at the footnotes, though, shows that this gross margin improvement has nothing to do with the cloud. Instead, the primary driver was rising product gross margins in the Cyber Intelligence segment, which increased from 57% in Q1 2018 to 64% in Q1 2019, “primarily due to a change in product mix and the timing of hardware deliveries related to certain long-term projects.”
Overall, there’s little evidence to support the bull case that Verint is successfully executing its shift to a cloud-based model. The company fails to provide much of the disclosure needed to back up that claim, and what disclosure it does provide suggests that it’s struggling to execute this transition as well as it clams.
Significantly Overvalued
Despite the company’s underlying issues, Verint’s Q1 earnings beat helped drive the stock up 30% so far in 2019. At its current valuation, the stock looks expensive by traditional metrics, with a P/E of 53 and a P/B of 2.9.
When we use our reverse DCF model to quantify the expectations baked into the stock price, we see that VRNT’s valuation is, if anything, even more expensive than traditional metrics suggest.
In order to justify its price of $55/share, Verint must achieve 11% NOPAT margins (equal to 2012) and grow NOPAT by 14% compounded annually for the next decade. See the math behind this dynamic DCF scenario. Figure 5 shows the disconnect between Verint’s historic NOPAT trajectory and its projected growth rate.
Figure 5: VRNT Historical vs. Implied NOPAT
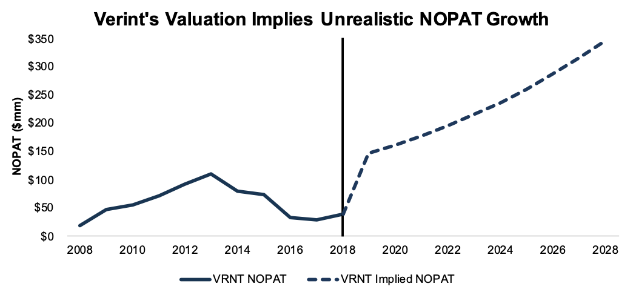 Sources: New Constructs, LLC and company filings.
If Verint can maintain 2018 margins of 7% and grow NOPAT by 6% compounded annually (in-line with projected CRM industry growth rates), the stock is worth $23/share today – a 58% downside to the current stock price. See the math behind this dynamic DCF scenario.
What Noise Traders Miss With VRNT
These days, fewer investors pay attention to fundamentals and the red flags buried in financial filings. Instead, due to the proliferation of noise traders, the focus tends toward technical trading tends while high-quality fundamental research is overlooked. Here’s a quick summary for noise traders when analyzing VRNT:
- Earnings growth over the past year was driven by accounting rule changes, not fundamental improvements
- The shift to a cloud-based model is going poorly and not delivering substantial results
- Verint is not a leader in any of its business lines
- Non-GAAP metrics create flawed incentives for management by ignoring the cost of acquisitions
Catalyst: Earnings Growth is Unsustainable
Verint’s recent revenue and margin improvements have been driven by one-time factors such as the adoption of ASU 2014-09 and shifts in the timing of product deliveries. As a result, it will be difficult for the company to keep up its recent track record of growth and earnings beats.
We would expect to see slower growth and flat margins over the next few quarters as these one-time factors fade. Given the high expectations implied by the stock price, anything less than stellar results should send the stock down sharply.
Longer-term, Verint could be a loser in the consolidation in the CRM software industry. Experts and executives in the industry expect to see a wave of consolidation in the near future, but Verint’s lack of leadership position in any segment could see it left out of this M&A activity. If Verint’s more successful competitors get acquired by tech giants with far superior resources, scale, and customer connections, the company could find itself in an even more disadvantageous position.
Almost No Capital Return
Verint has never offered a dividend in its history as a public company. This lack of capital return should come as no surprise, since the company typically fails to generate positive cash flow. Since 2009, Verint has had an accumulated -$314 million (9% of market cap) in free cash flow.
The company does buy back small amounts of stock, but only to facilitate income tax withholding and other requirements related to equity awards. These equity awards, along with shares used to pay for acquisitions, have significantly diluted existing investors. Verint’s share count has increased from 54 million in the first quarter of 2014 to 66 million currently, an increase of 4% compounded annually.
Insider Trading and Short Interest Are Minimal
Insider activity has been minimal over the past 12 months, with 296 thousand shares purchased and 356 thousand shares sold for a net effect of 60 thousand shares sold. These sales represent less than 1% of shares outstanding.
There are currently 4 million shares sold short, which equates to 6% of shares outstanding and 5 days to cover. The number of shares sold short has doubled since the beginning of the year, so some investors are betting against VRNT as its valuation rises. However, overall short interest remains low.
Critical Details Found in Financial Filings by Our Robo-Analyst Technology
As investors focus more on fundamental research, research automation technology is needed to analyze all the critical financial details in financial filings. Below are specifics on the adjustments we make based on Robo-Analyst[1]findings in Verint’s 2018 10-K:
Income Statement: we made $761 million of adjustments, with a net effect of removing $24 million in non-operating expense (5% of revenue). We removed $36 million in non-operating income and $60 million in non-operating expenses. You can see all the adjustments made to VRNT’s income statement here.
Balance Sheet: we made $518 million of adjustments to calculate invested capital with a net decrease of $48million. You can see all the adjustments made to VRNT’s balance sheet here.
Valuation: we made $1.3 billion of adjustments with a net effect of decreasing shareholder value by $535 million. You can see all the adjustments made to VRNT’s valuation here.
Unattractive Funds That Hold VRNT
The following funds receive our Unattractive-or-worse rating and allocate significantly to Verint.
- Cullen Small Cap Value Fund (CUSCX) – 4.7% allocation and Unattractive rating
- Neuberger Berman Intrinsic Value Fund (NINAX) – 4.2% allocation and Very Unattractive rating
- Meridian Contrarian Fund (MFCAX) – 3.3% allocation and Very Unattractive rating
Disclosure: David Trainer and Sam McBride receive no compensation to write about any specific stock, style, or theme.
[1] Harvard Business School features the powerful impact of our research automation technology in the case New Constructs: Disrupting Fundamental Analysis with Robo-Analysts.


