Although USD/JPY came back above the long-term line, we didn’t notice significant increases in the following days. Will this show of currency bulls’ weakness result in another repetition of what we already saw in the past?
EUR/USD
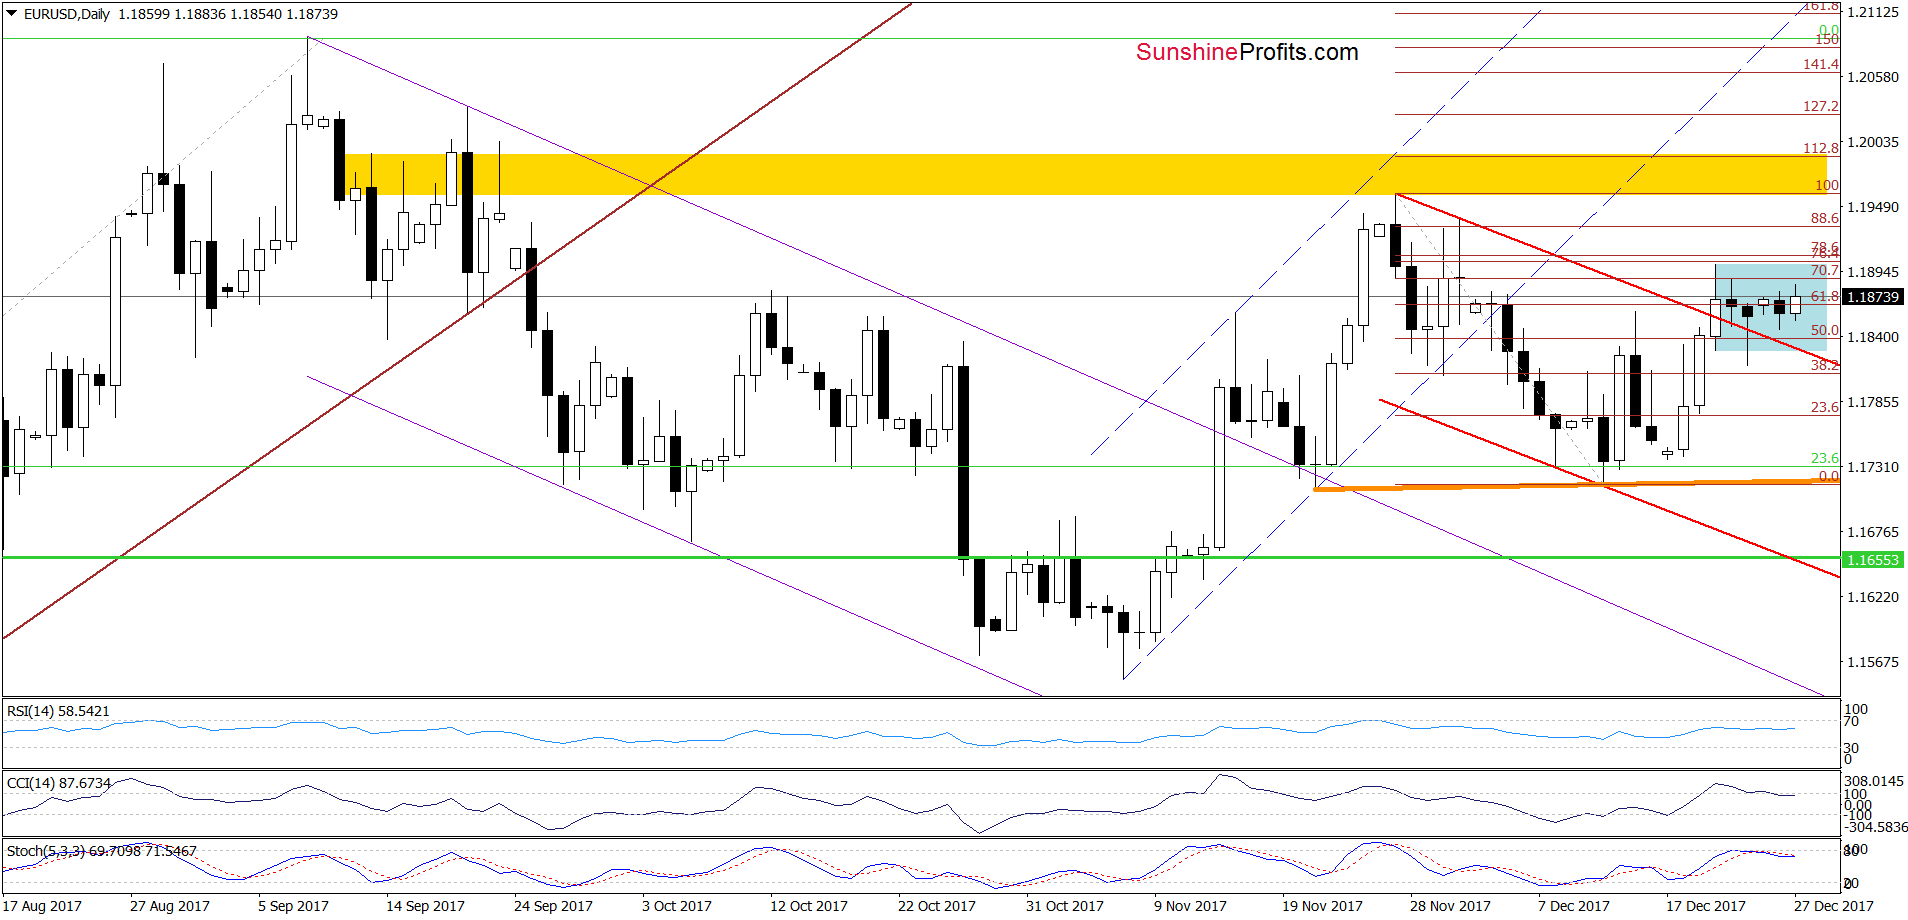
Looking at the daily chart, we see that the overall situation in the short term hasn’t changed much since our last Forex Trading Alert was posted as EUR/USD is trading in the blue consolidation. Such price action makes the picture a bit unclear, however, the CCI and the Stochastic Oscillator generated the sell signals and the exchange rate remains under the resistance zone created by the 76.4% and 78.6% Fibonacci retracements, which suggests that the next move will be to the downside.

Nevertheless, such price action will be more likely and reliable if we see a drop below the previously-broken upper border of the red declining trend channel and the lower line of the blue consolidation.
What could happen if we see such developments? In our opinion, the pair will extend declines and test the orange support line based on the previous lows in the following days. This pro bearish scenario is also reinforced by the broader picture of EUR/USD.
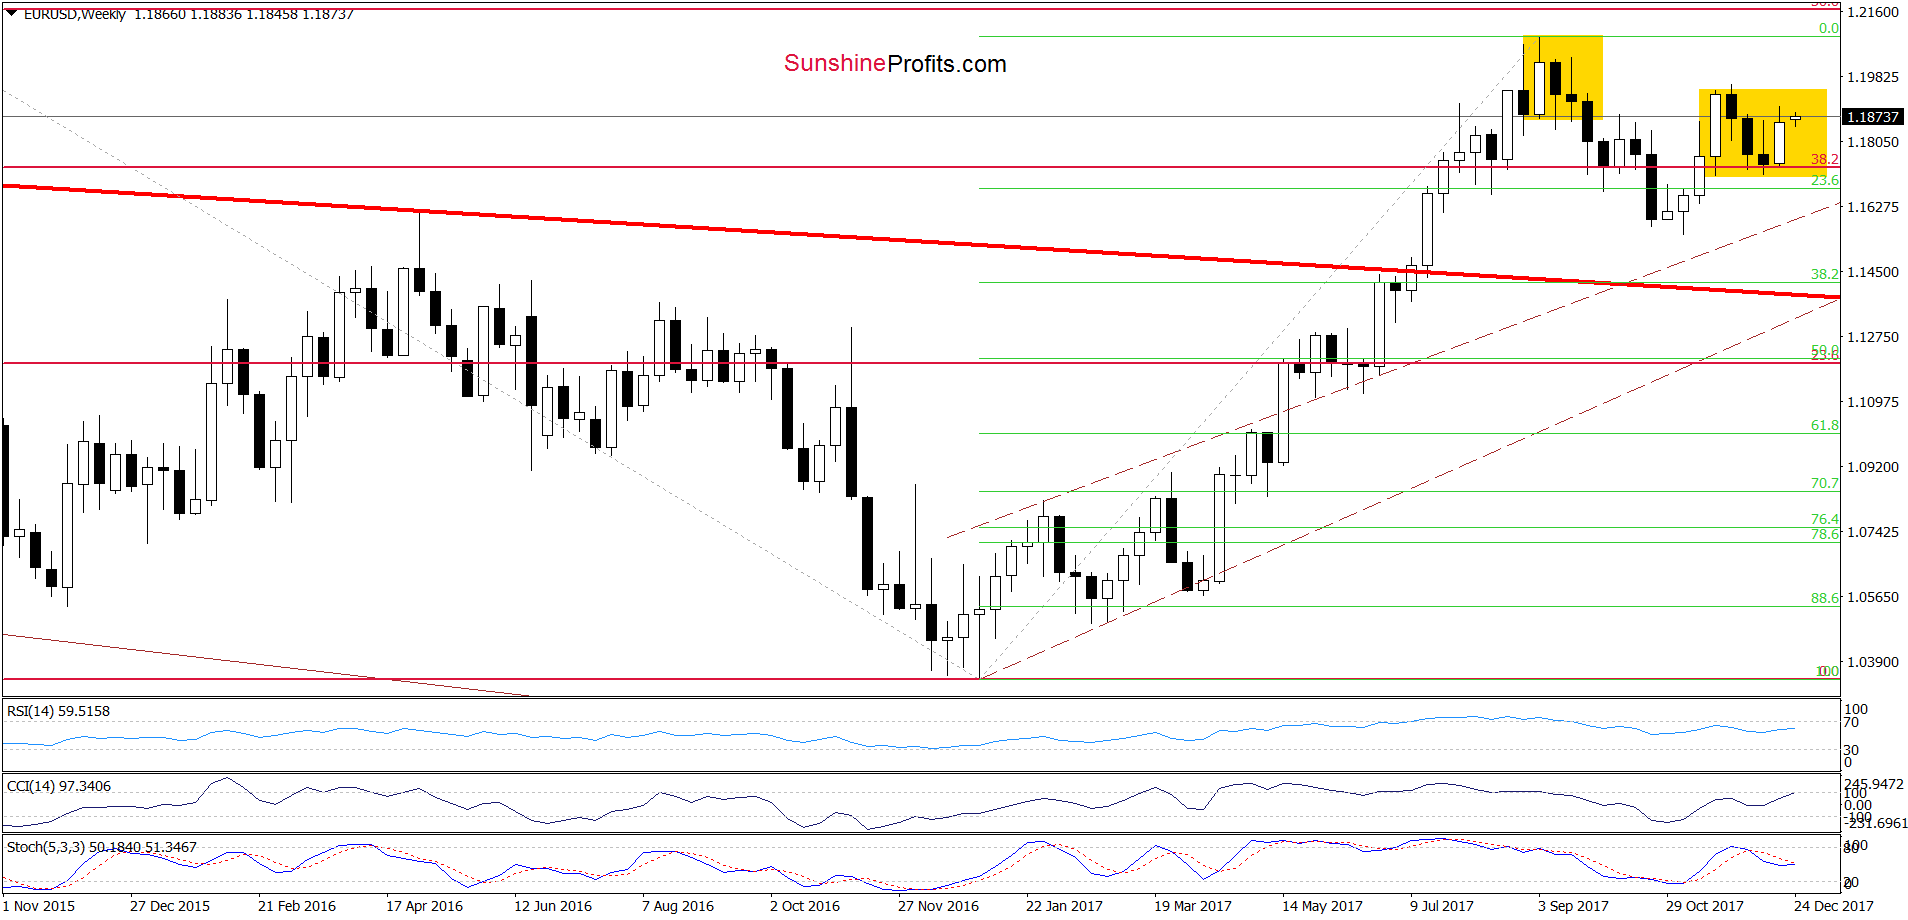
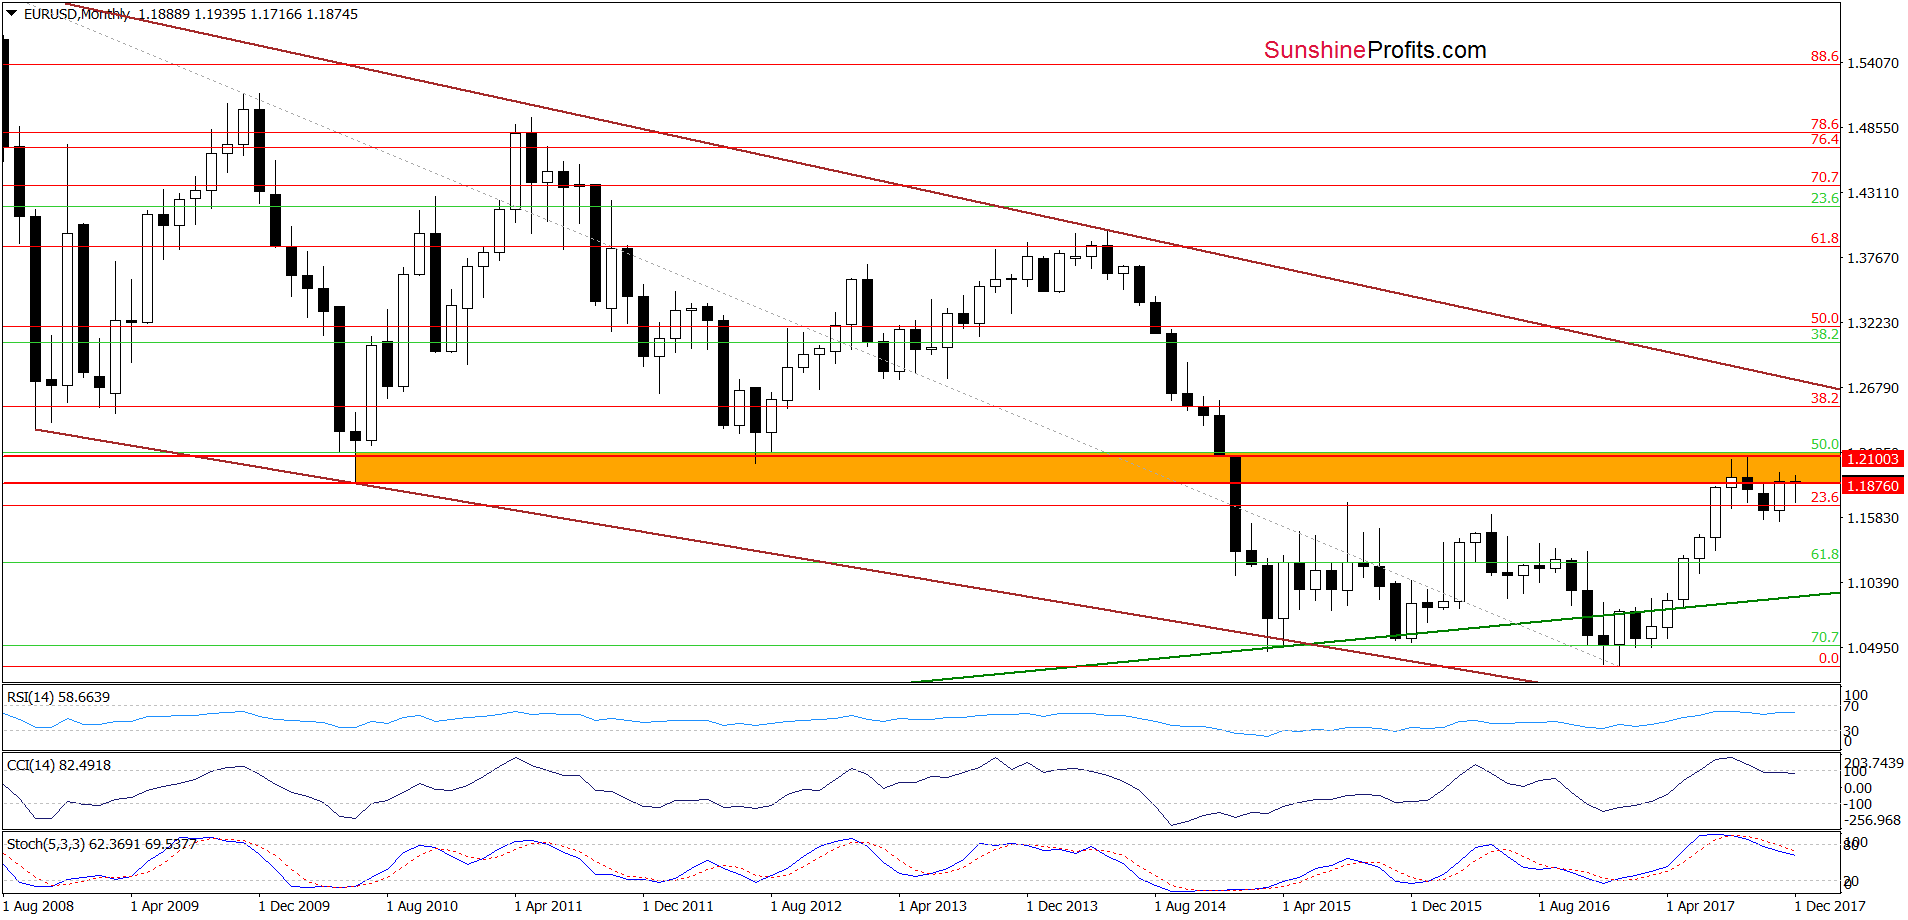
As you see on the charts below, the exchange rate remains in the yellow consolidation under the orange resistance zone, which together with the sell signals generated by the weekly and monthly indicators (marked on the charts below) increase the probability that another move will be to the downside.
USD/JPY
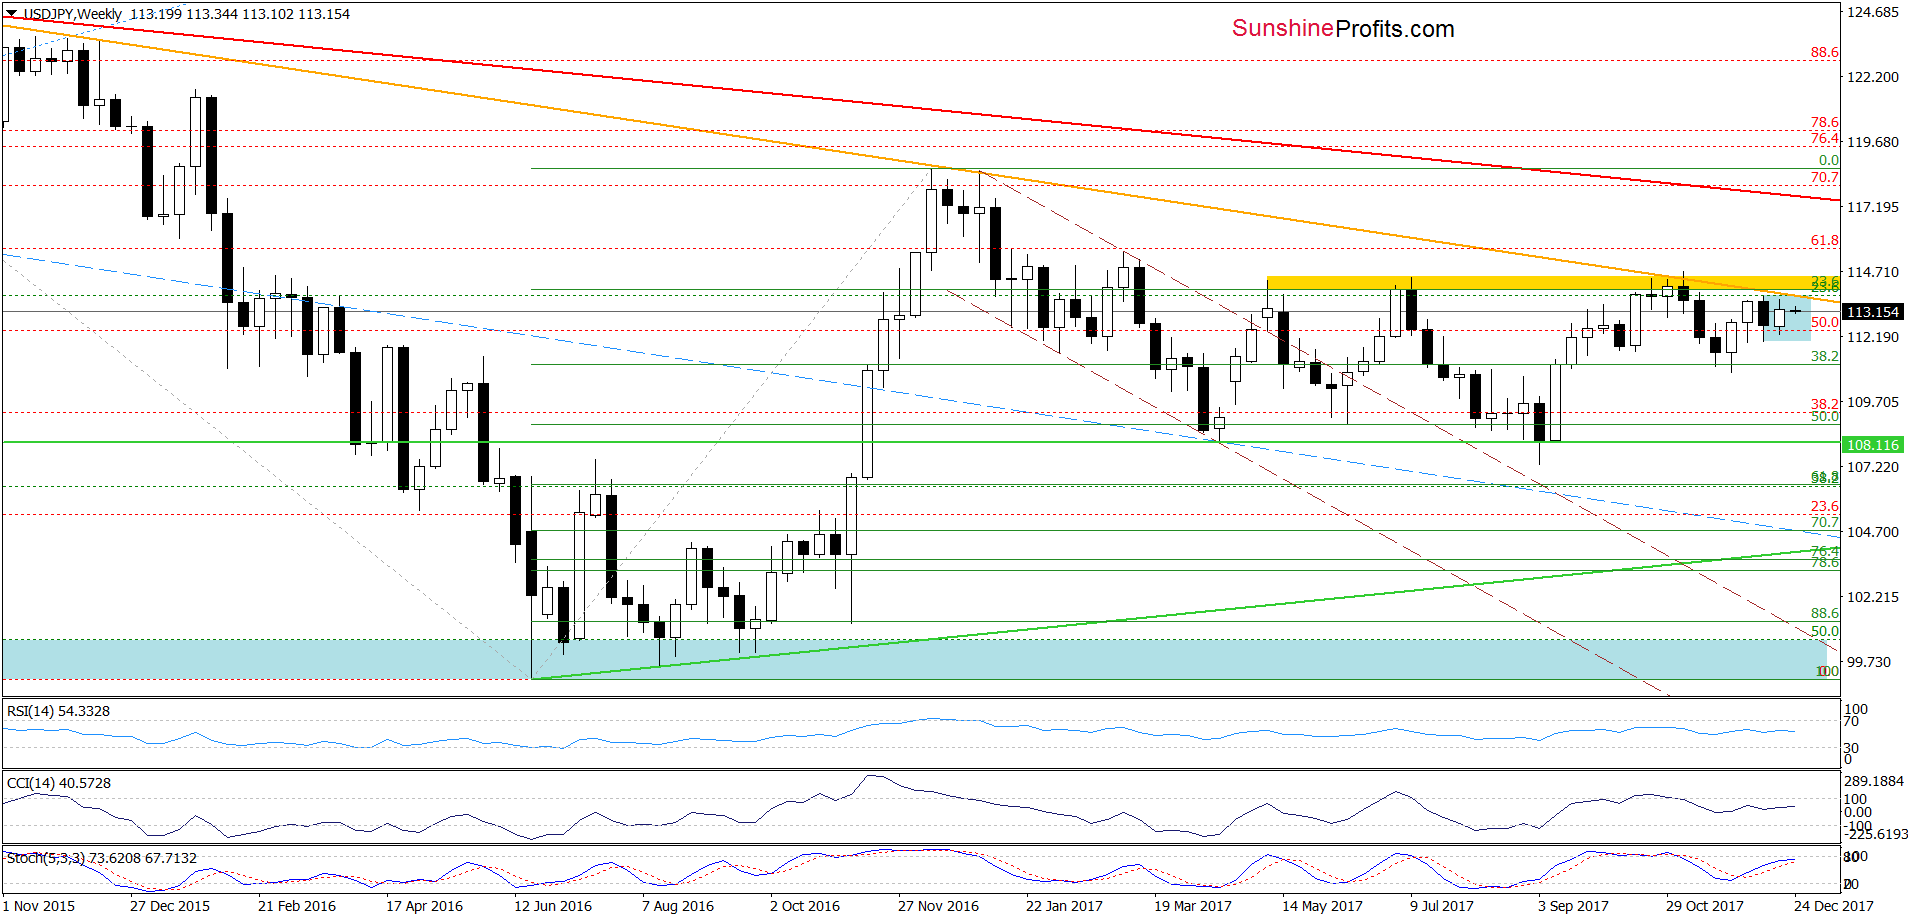
From the medium-term perspective, we see that USD/JPY is trading in the blue consolidation under the yellow resistance zone and the orange declining resistance line, which together continue to block the way to higher levels for many weeks.
Will we see another attempt to break above this resistance area in the coming days? Let’s examine the very short-term chart to find out.
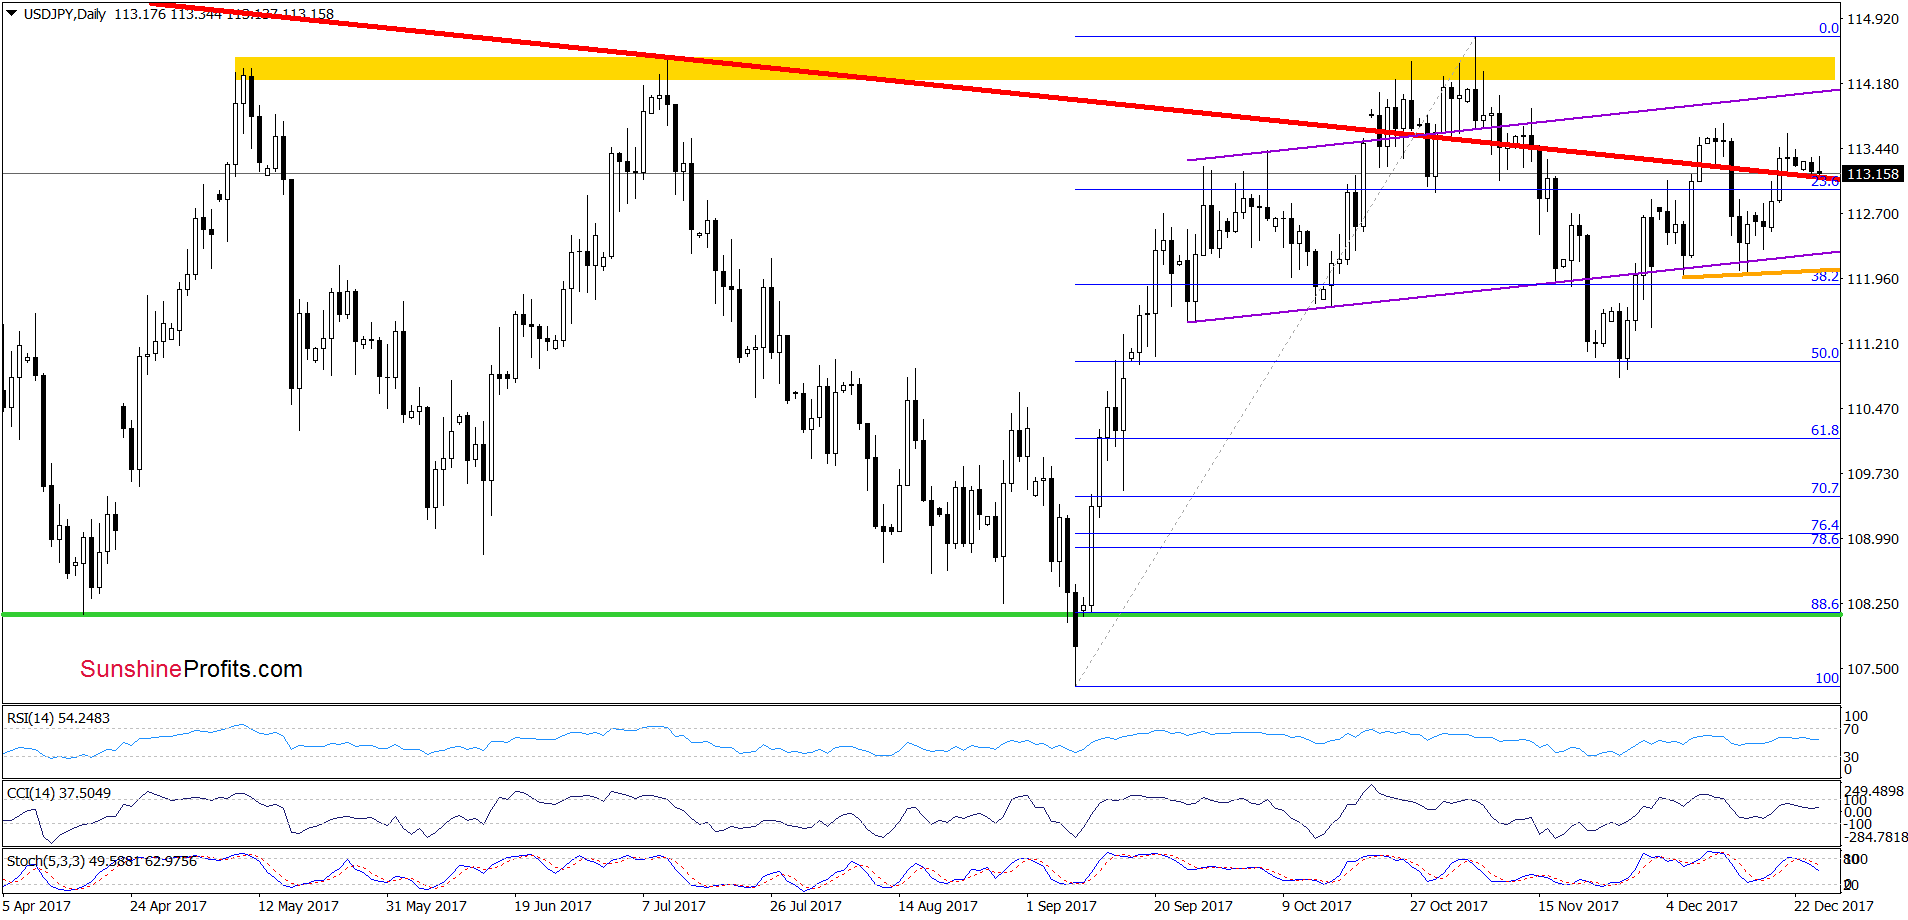
On the daily chart, we see that although USD/JPY came back above the long-term red declining resistance line and invalidated the earlier breakdown, currency bulls didn’t push the pair significantly higher, showing their weakness. We saw similar price action at the end of October, at the beginning of November and at the beginning of this month, which doesn’t bode well for further improvement.
Why? As you see on the above chart, in all previous cases, USD/JPY sooner or later turned south, which resulted in the invalidation of the previous breakouts. Taking this fact into account and combining it with the sell signal generated by the Stochastic Oscillator, we think that we’ll see one more move to the downside in the coming days. Therefore, if the exchange rate closes today’s session (or one of the following) under the red line, we’ll likely see a test of the orange support line based on the previous lows in the following days. However, if this area is broken, the next downside target for currency bears will be around 110.82-111, where the 50% Fibonacci retracement and the November lows are.
USD/CAD
Quoting our last commentary on this currency pair:
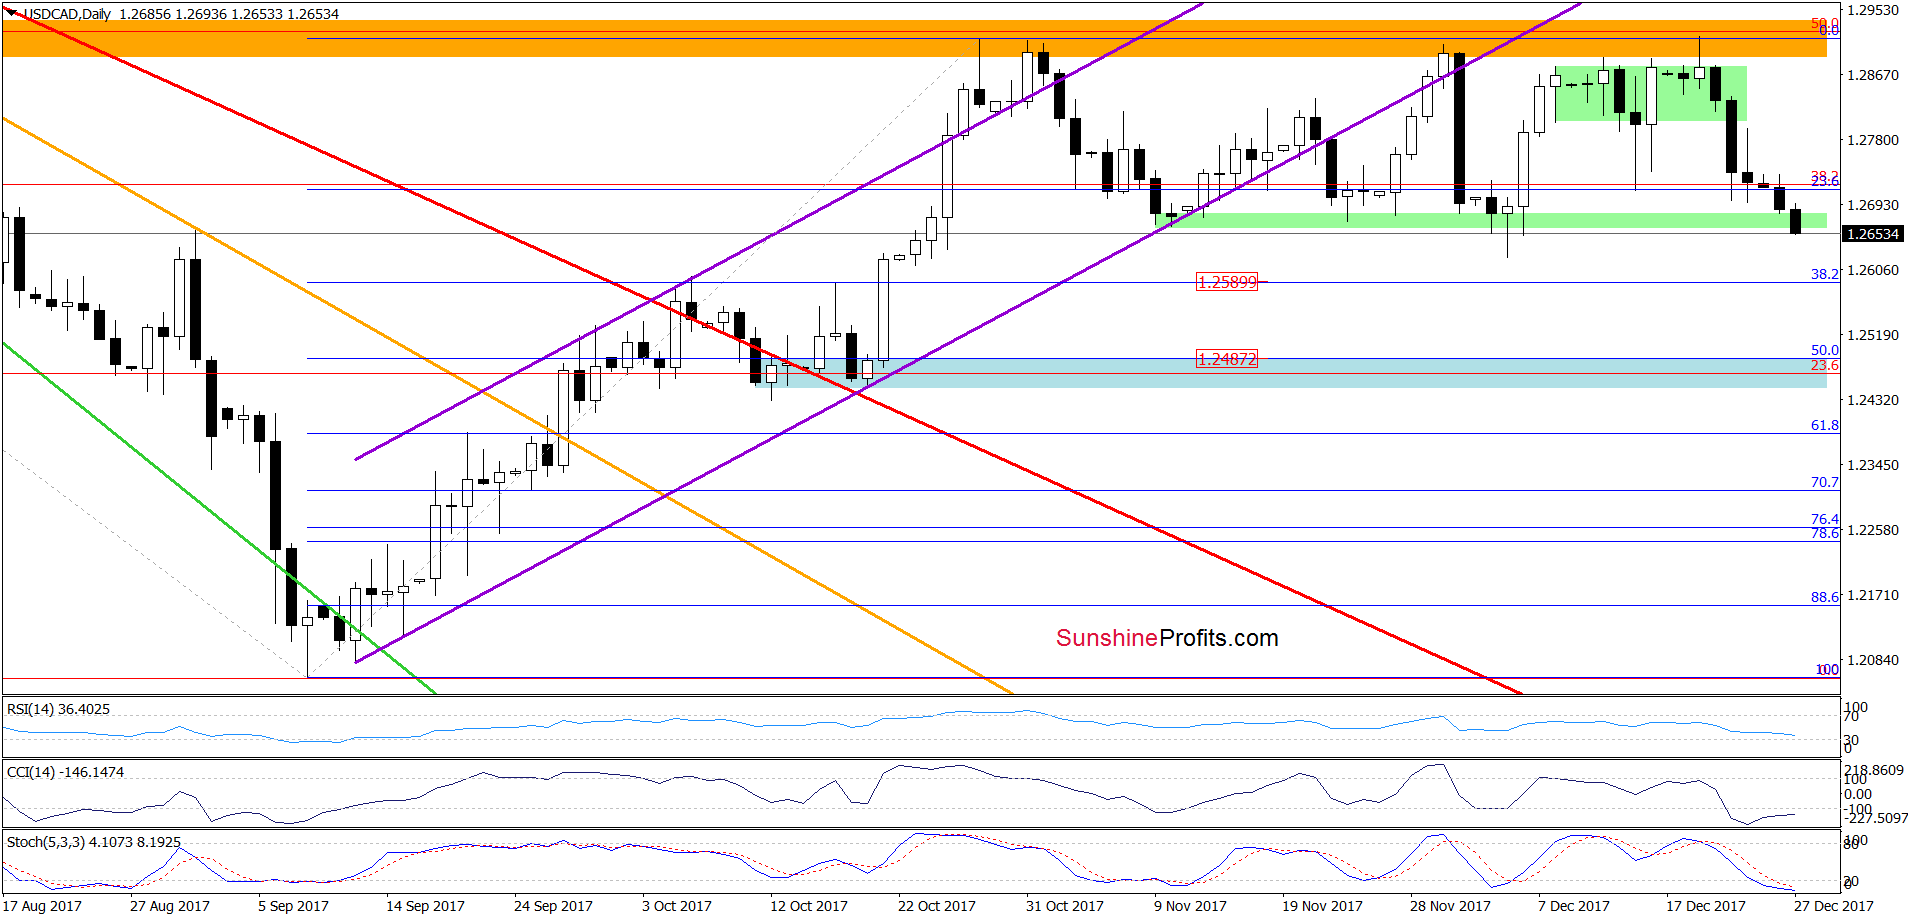
(…) USD/CAD moved lower after an invalidation of the tiny breakout above the upper line of the green consolidation. What does it mean for the exchange rate? (…) If we see a decline from current levels, we think that the pair will test the last week’s lows in the following days.
Looking at the daily chart, we see that the situation developed in tune with our assumptions and USD/CAD extended losses, slipping to our downside target earlier today.
What’s next for the exchange rate? The proximity to the early December low and the current position of the indicators suggest that reversal and rebound are just around the corner. Nevertheless, what could happen if the pair breaks under this month’s low?
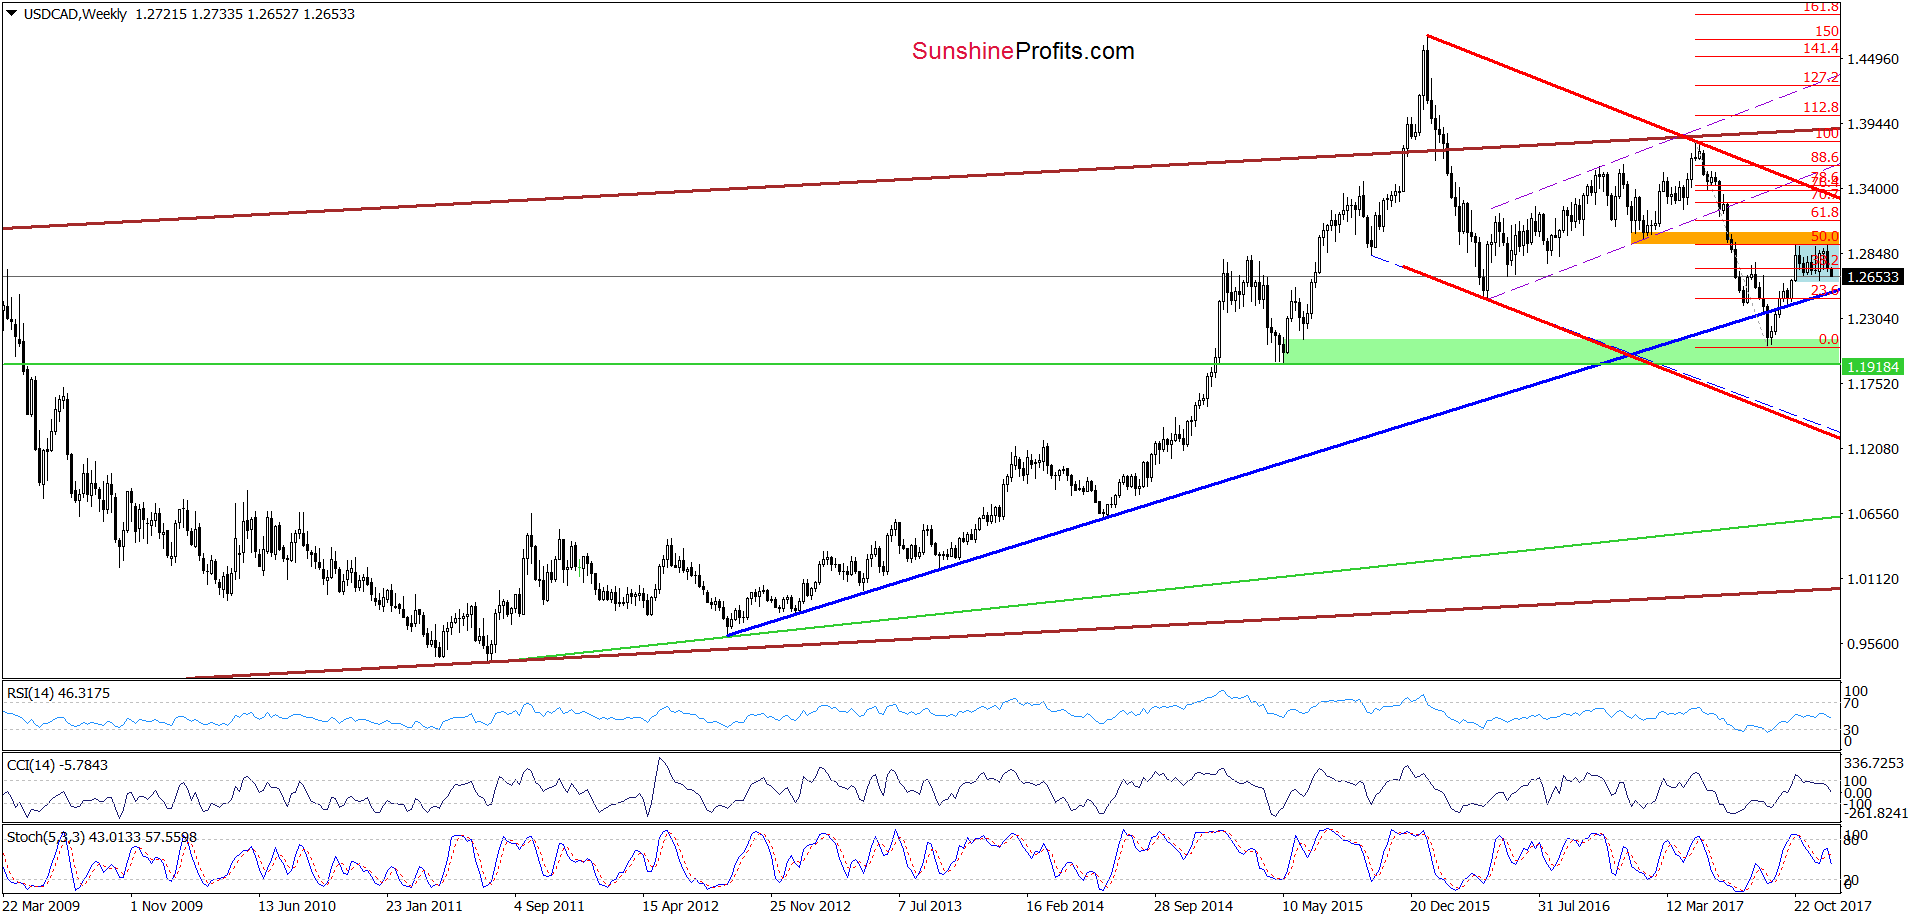
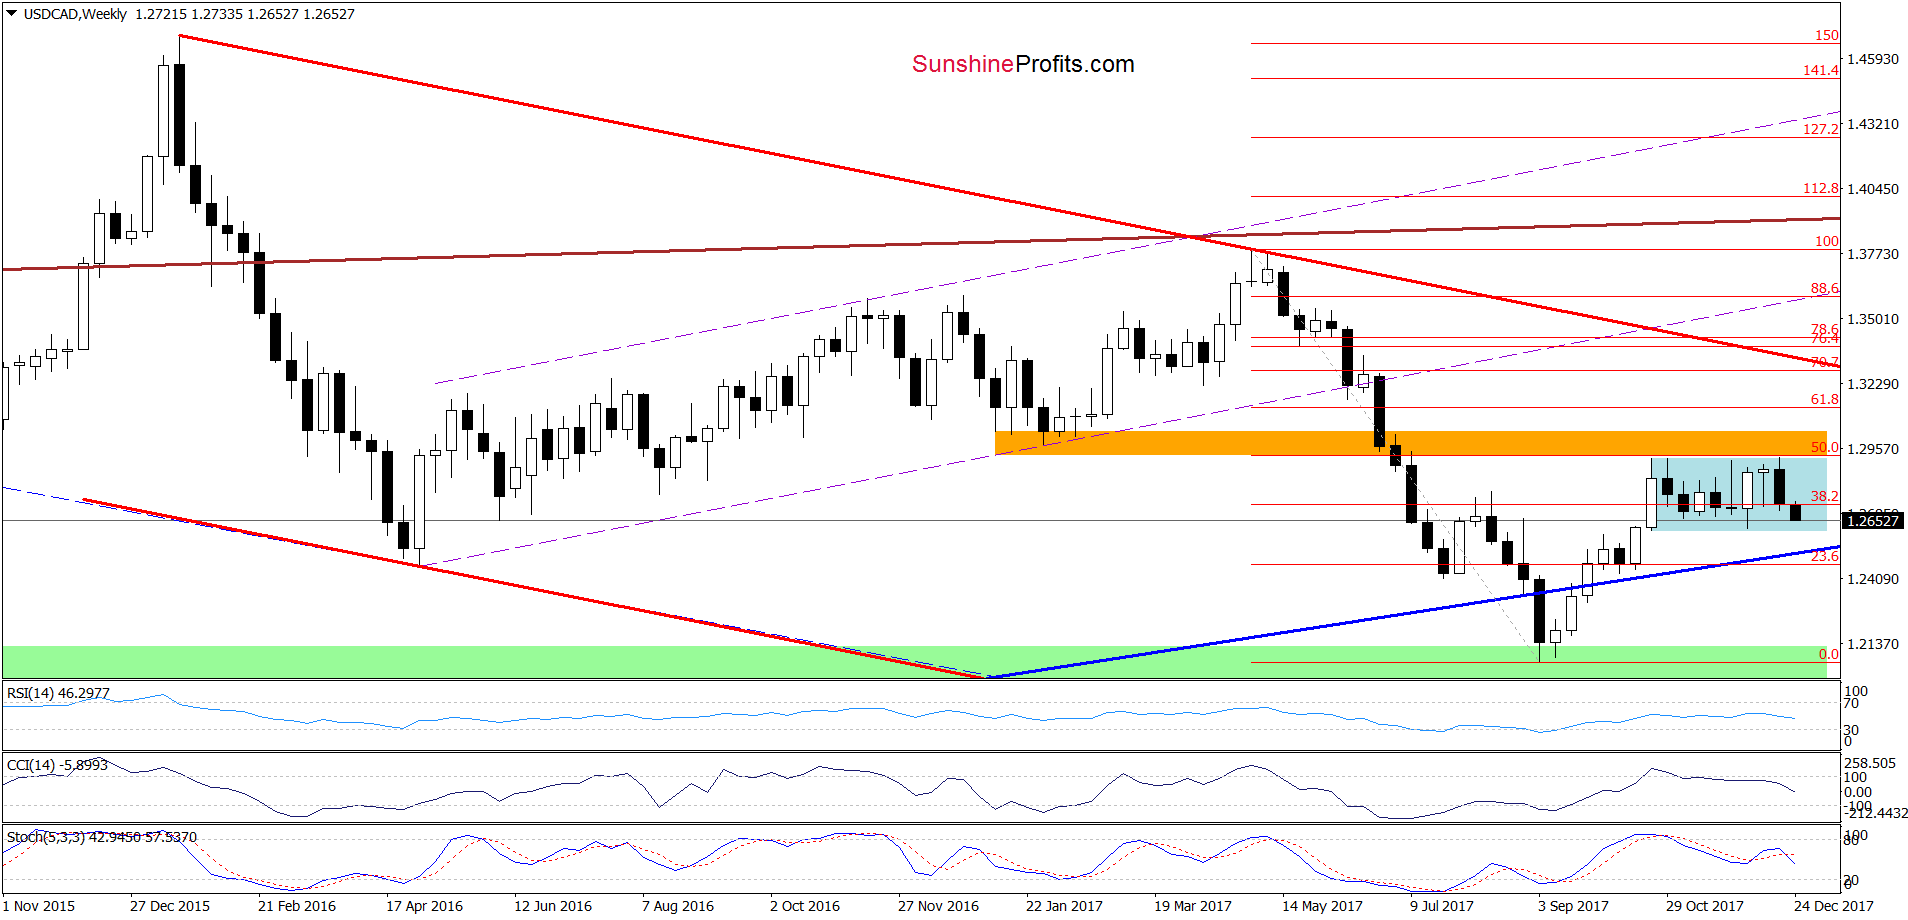
In our opinion, such price action will result in a decline to the 38.2% Fibonacci retracement (around 1.2590) or even to 1.2525, where the long-term blue support line (seen more clearly on the charts below) currently is.
Naturally, the above could change in the coming days and we’ll keep our subscribers informed, but that’s what appears likely based on the data that we have right now. If you enjoyed reading our analysis, we encourage you to subscribe to our daily Forex Trading Alerts.
Thank you.
Nadia Simmons
Forex & Oil Trading Strategist
Przemyslaw Radomski, CFA
Founder, Editor-in-chief, Gold & Silver Fund Manager
Gold & Silver Trading Alerts
Forex Trading Alerts
Oil Investment Updates
Oil Trading Alerts


