At the end of the previous week, the greenback moved lower against the Swiss franc, which resulted in a comeback to the previously-broken support/resistance line. Will we see a verification of the earlier breakout or rather further declines in the coming week?
EUR/USD
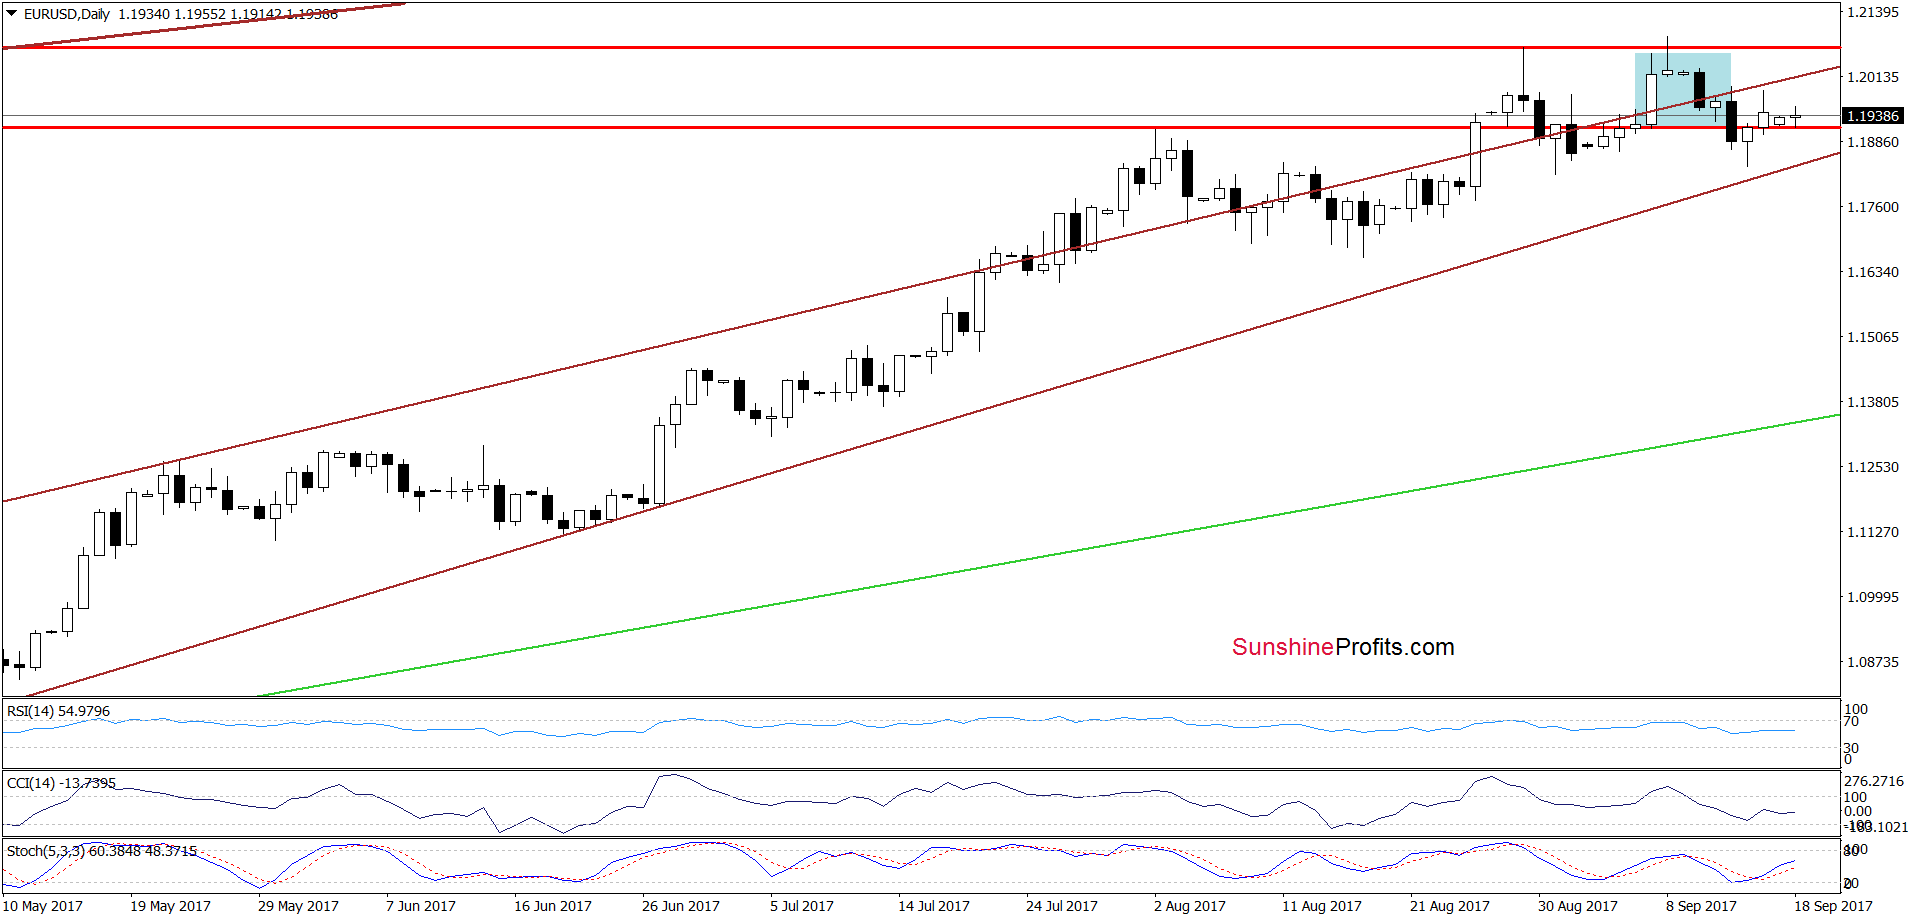
Looking at the daily chart, we see that the overall situation hasn’t changed much as EUR/USD is still trading under the upper border of the brown rising trend channel.

Will the broader perspective give us more clues about future moves? Let’s check.
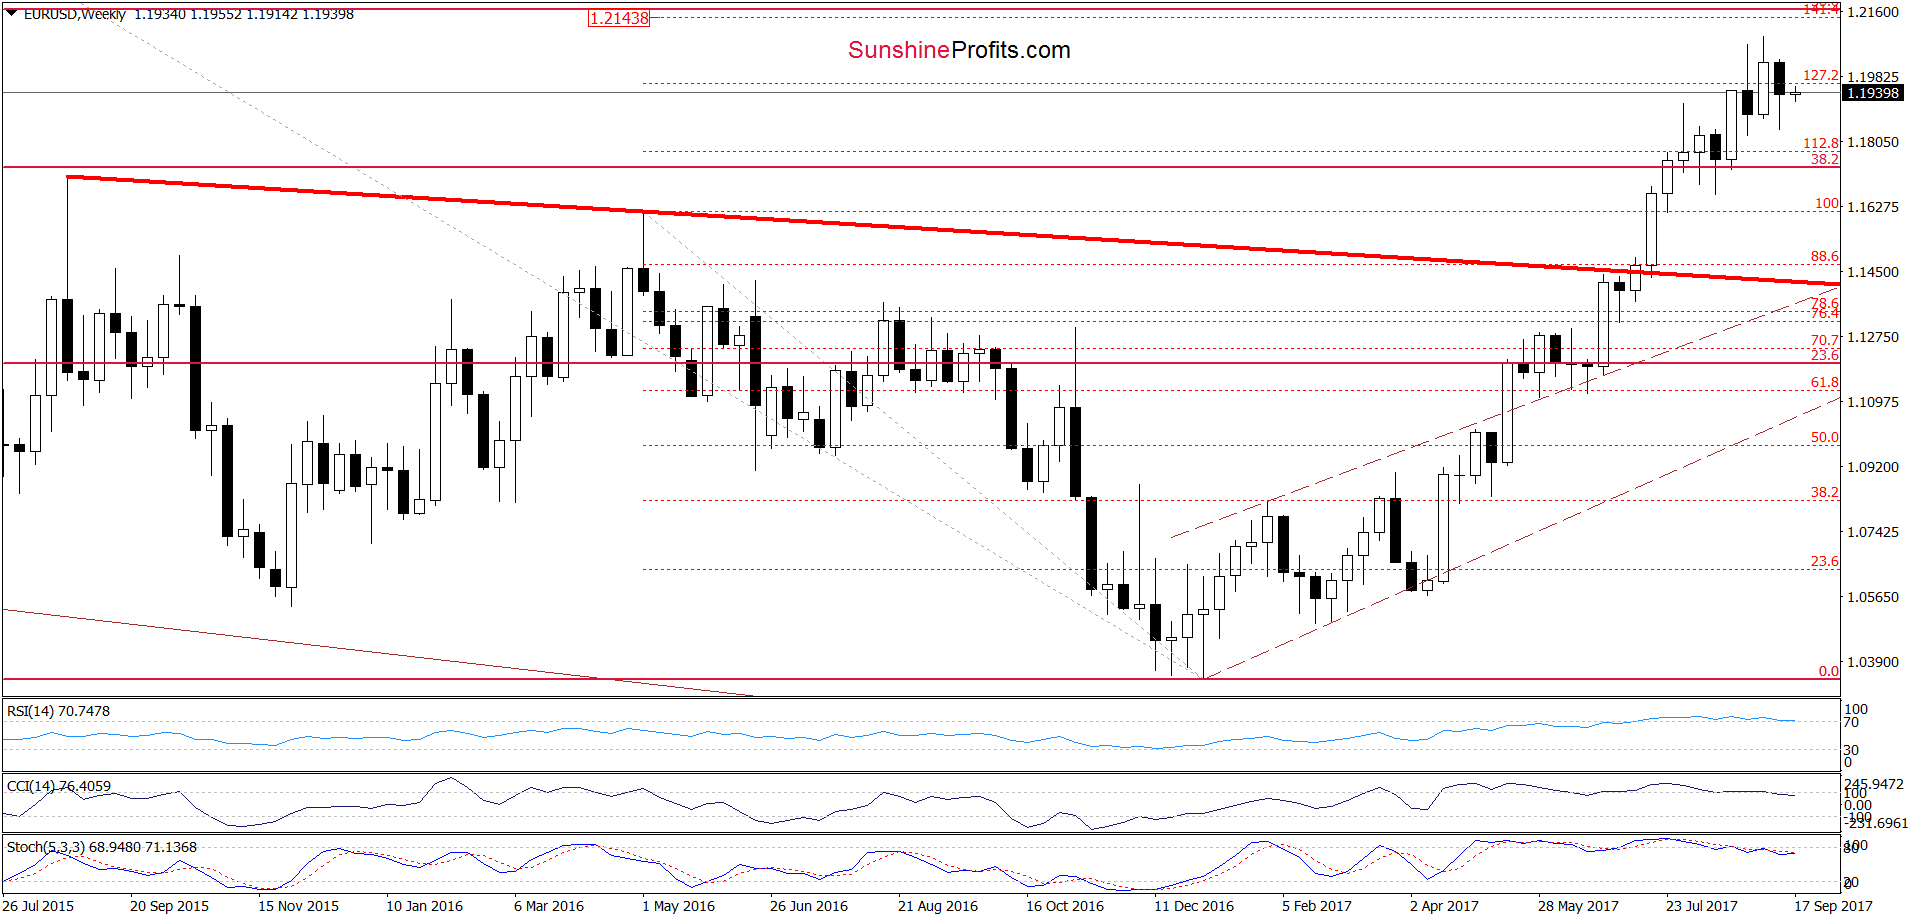
From the medium-term perspective, we see that EUR/USD closed the previous week under the 127.2% Fibonacci extension, which means an invalidation of the earlier breakout above this resistance. Taking this negative development and the sell signals generated by the weekly indicators, we think that further deterioration is just around the corner – especially when we factor in the current situation in the long-term perspective.
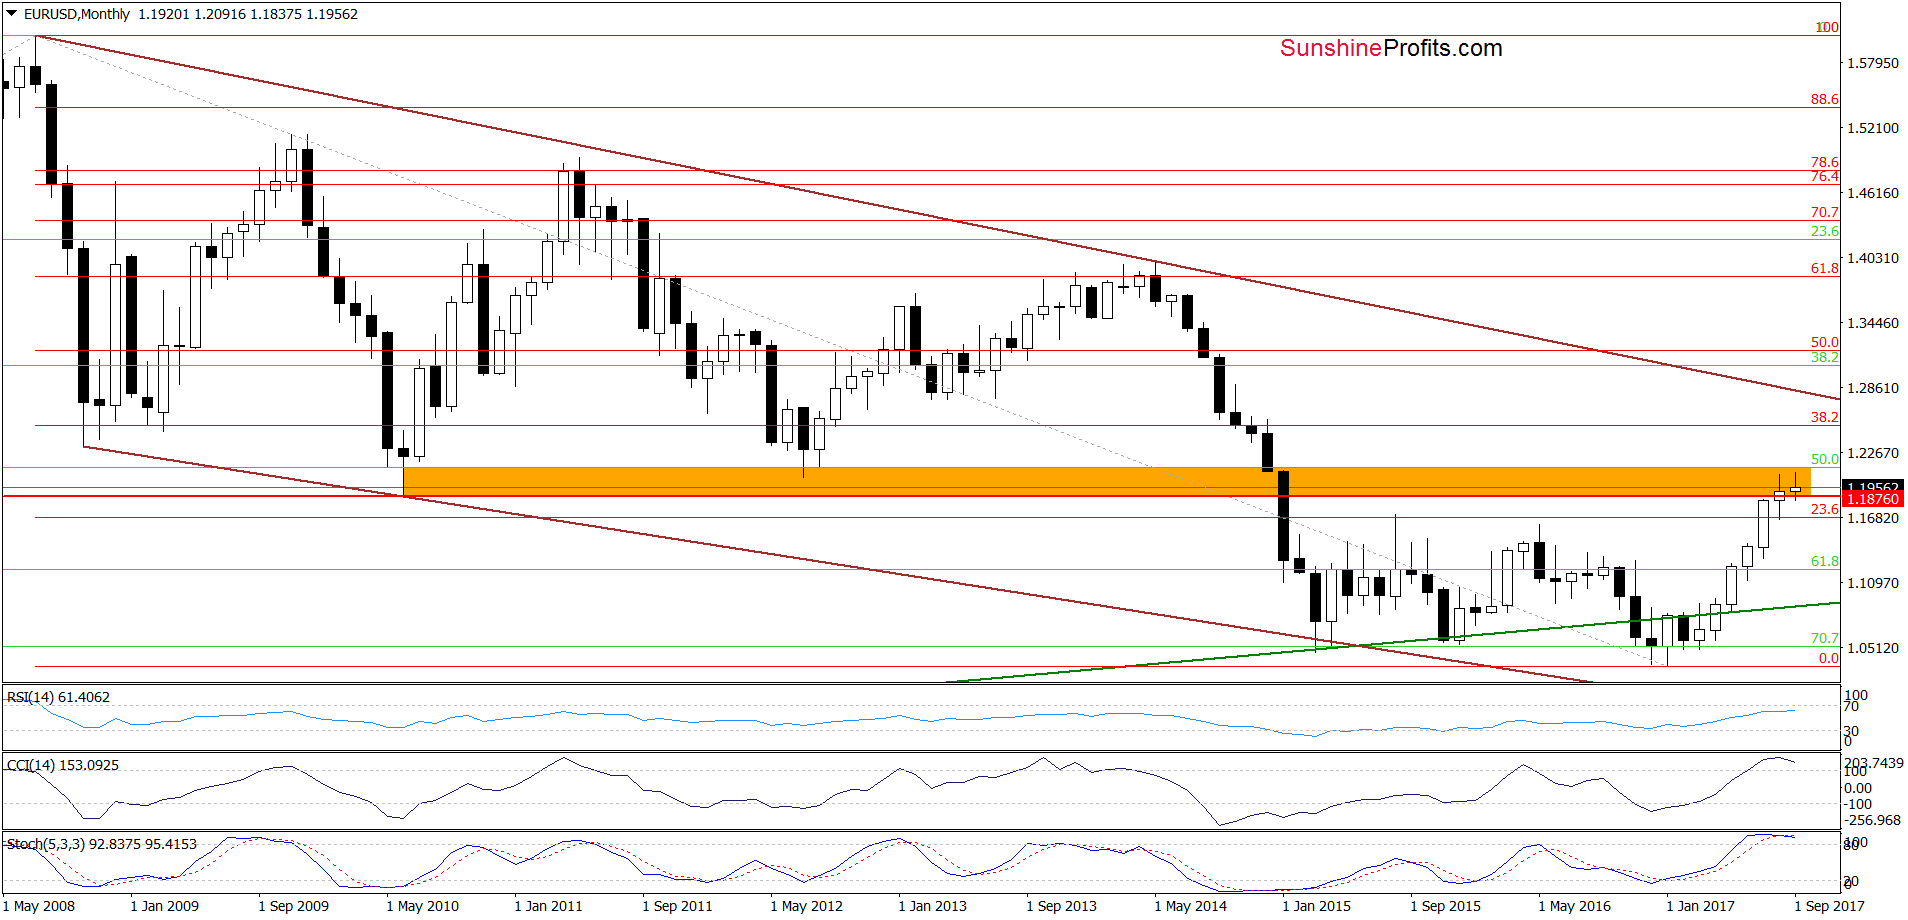
On the monthly chart, we see that EUR/USD is still trading in the orange resistance zone. Additionally, indicators increased to the highest levels since April 2014. Back then, such high readings of the CCI and Stochastic Oscillator preceded bigger move to the downside, which suggests that we may see a similar price action in the coming week(s).
Very short-term outlook: mixed with bearish bias
Short-term outlook: bearish
MT outlook: mixed
LT outlook: mixed
USD/CAD
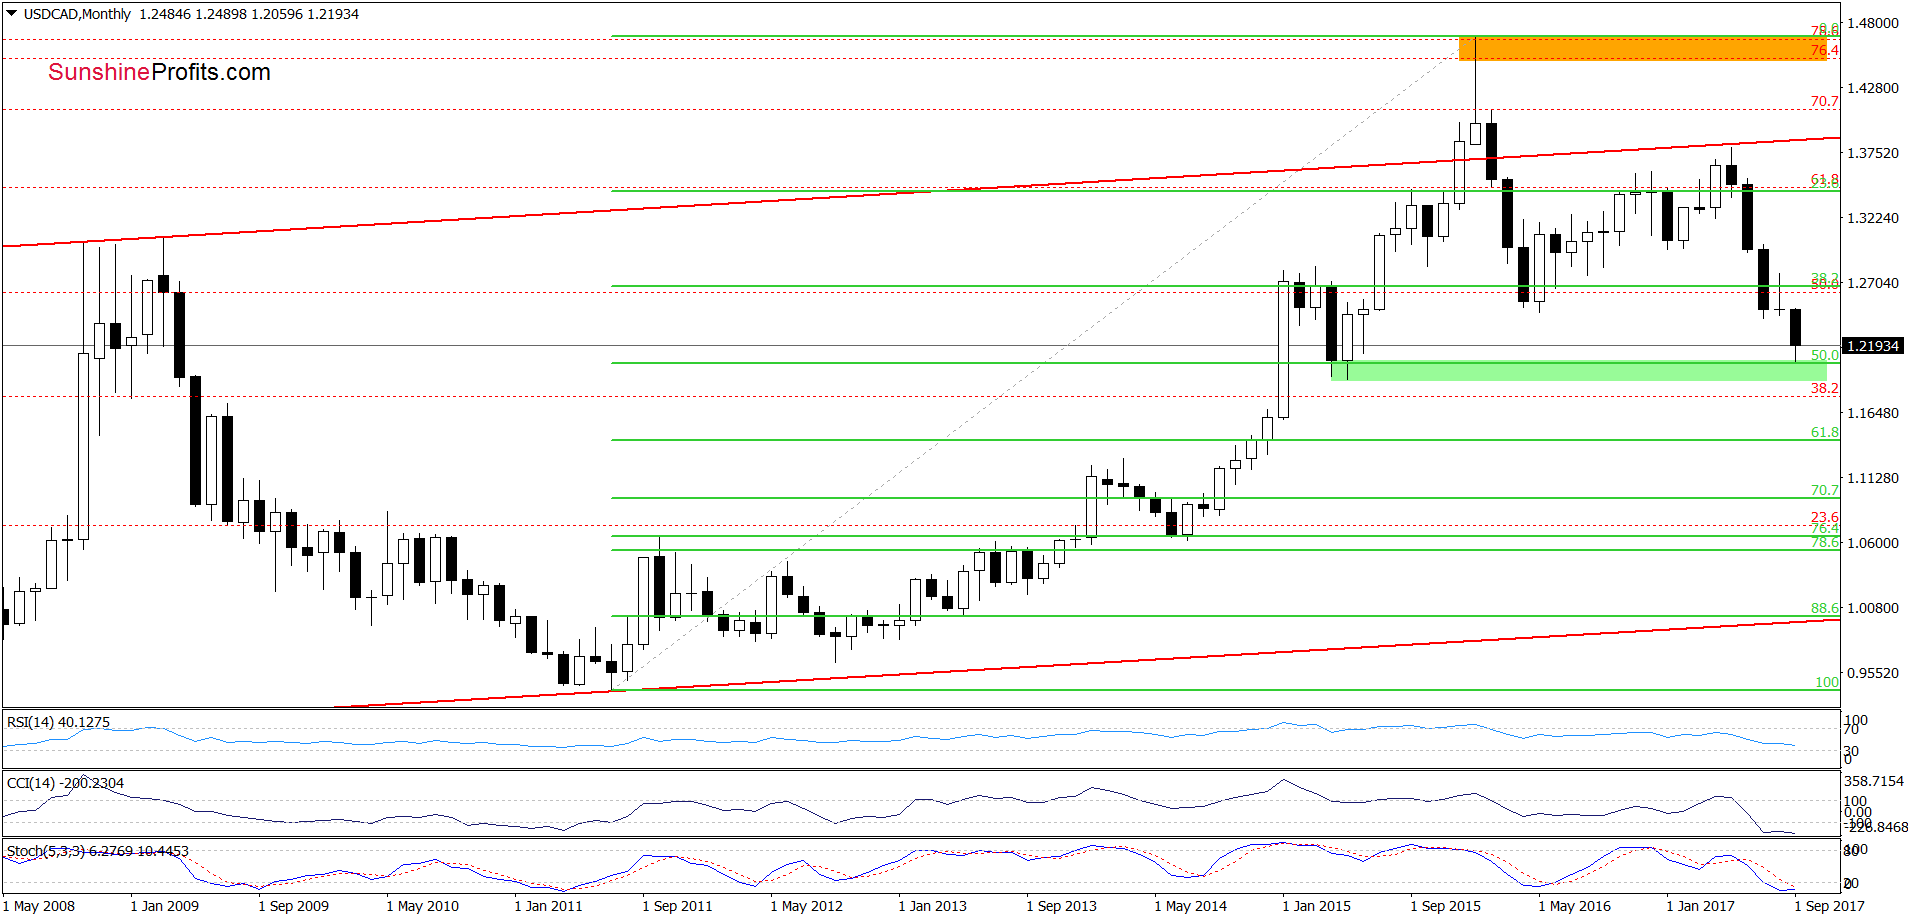
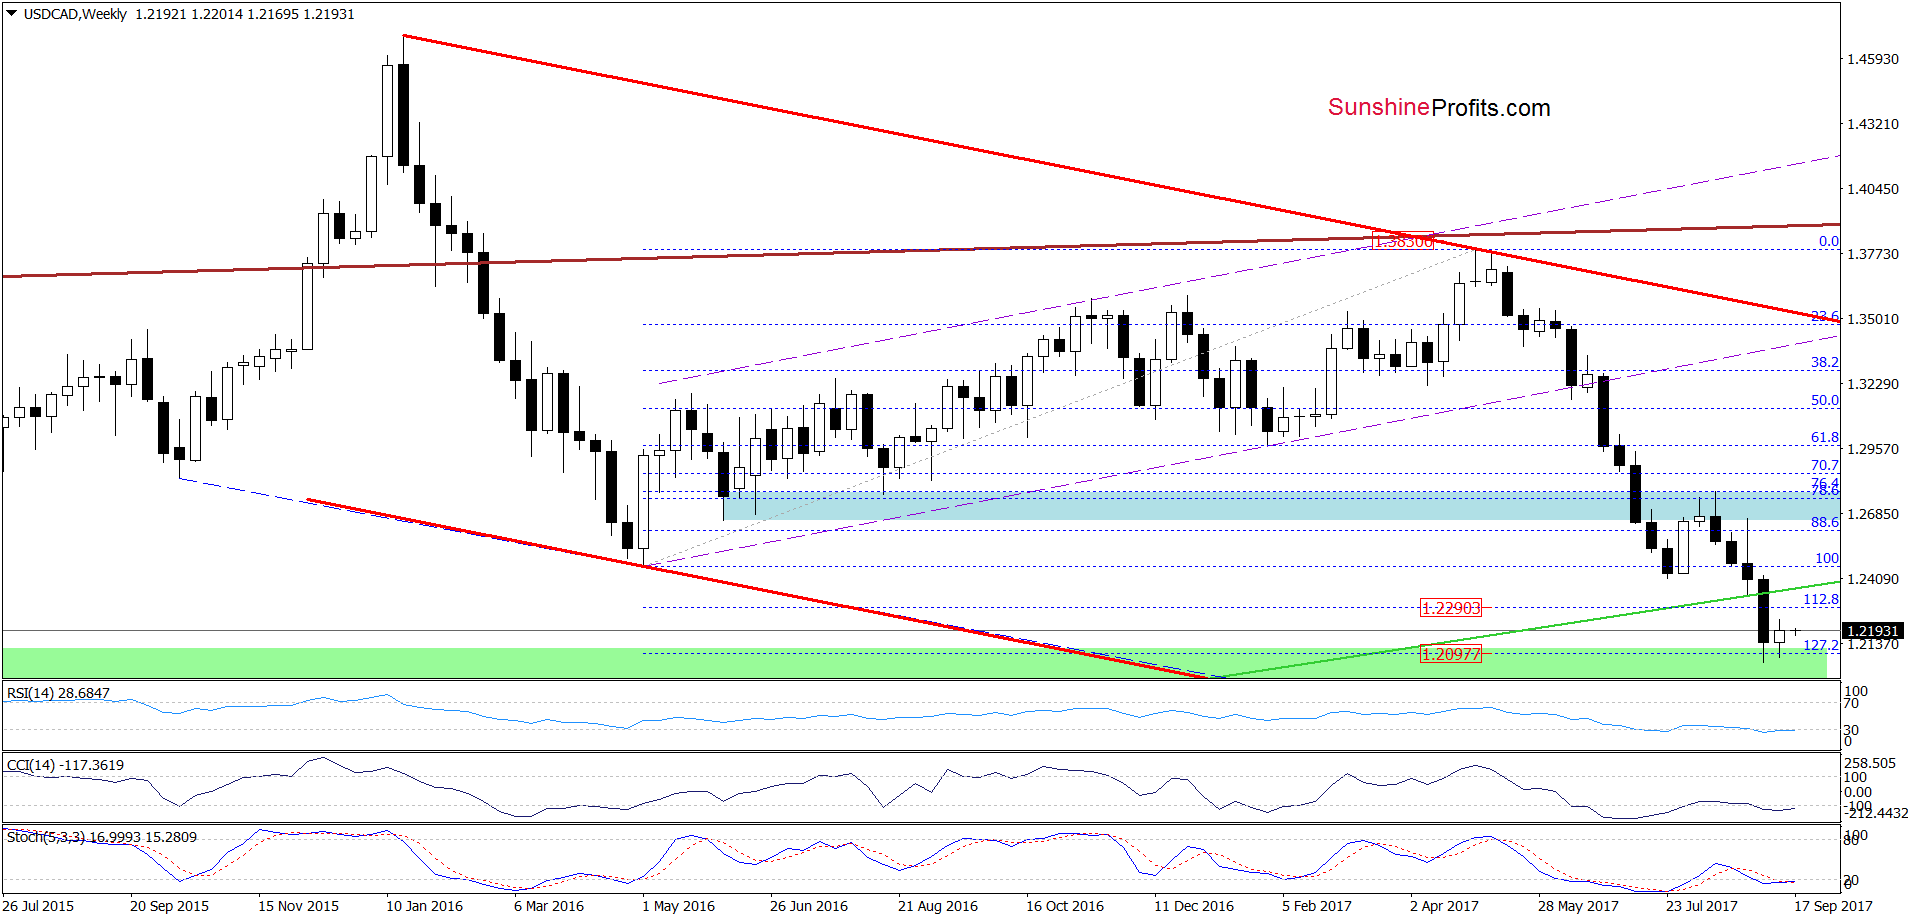
Looking at the above charts, we see that the upper border of the green support zone (created by the 127.2% Fibonacci extension) together with the 50% Fibonacci retracement (based on the entire 2011-2016 upward move and marked on the long-term chart) continue to keep declines in check. But will we see further improvement in the coming week? Let’s examine the daily chart and find out.
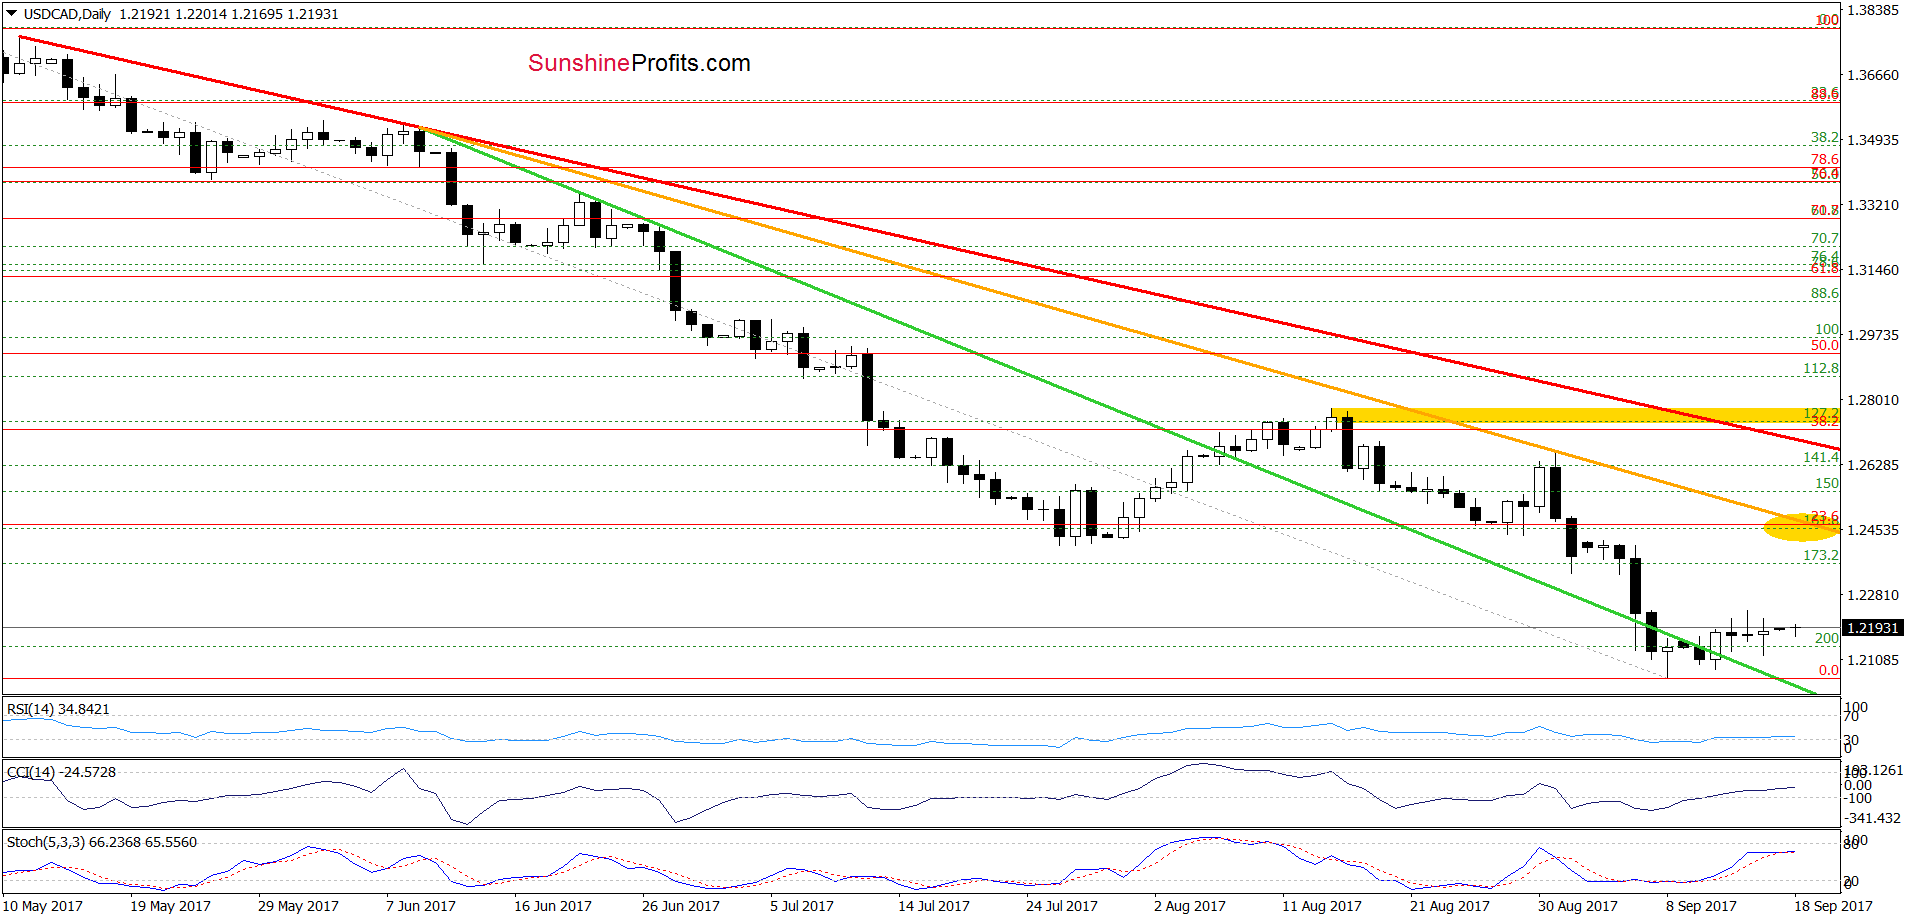
From the very short-term perspective, we see that USD/CAD is still trading above the green support line and the 200% Fibonacci extension, which together with buy signals generated by the daily indicators suggests further improvement.
If this is the case and the exchange rate extends gains from current levels, we’ll likely see an increase to the resistance area (marked with the yellow ellipse) created by the 23.6% Fibonacci retracement (based on the entire May-September downward move), the orange declining resistance line and the July lows in the coming days.
Very short-term outlook: mixed with bullish bias
Short-term outlook: mixed
MT outlook: mixed
LT outlook: mixed
USD/CHF
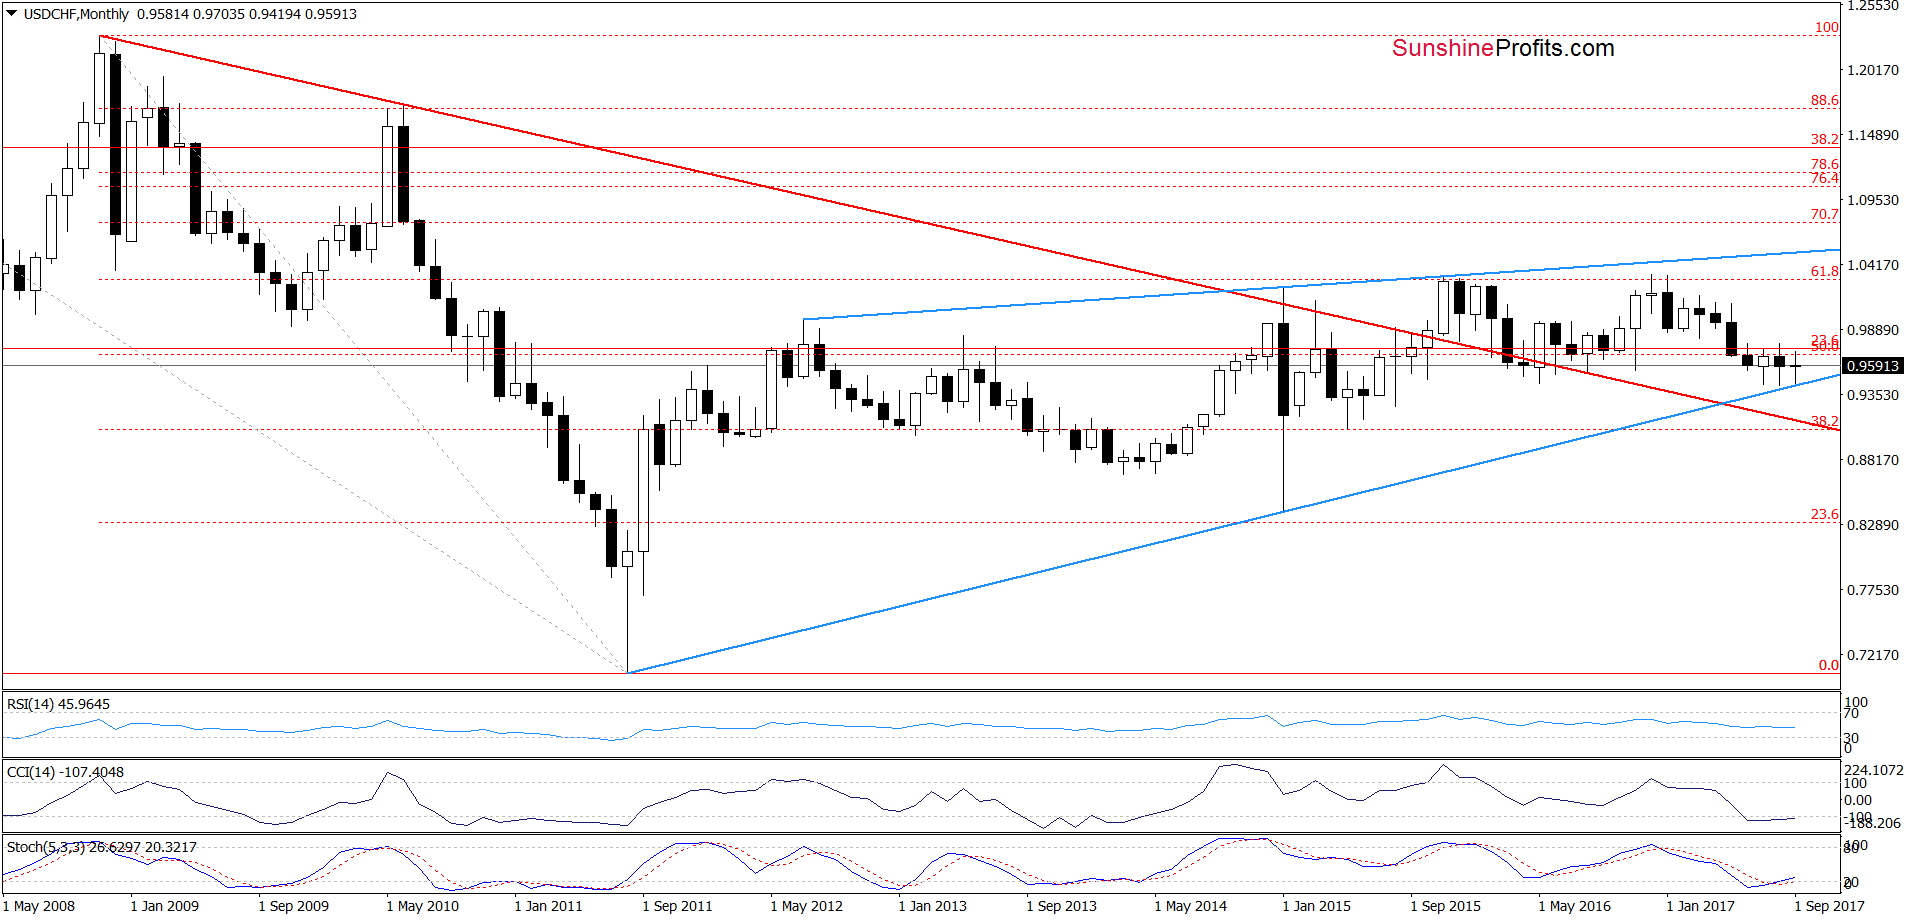
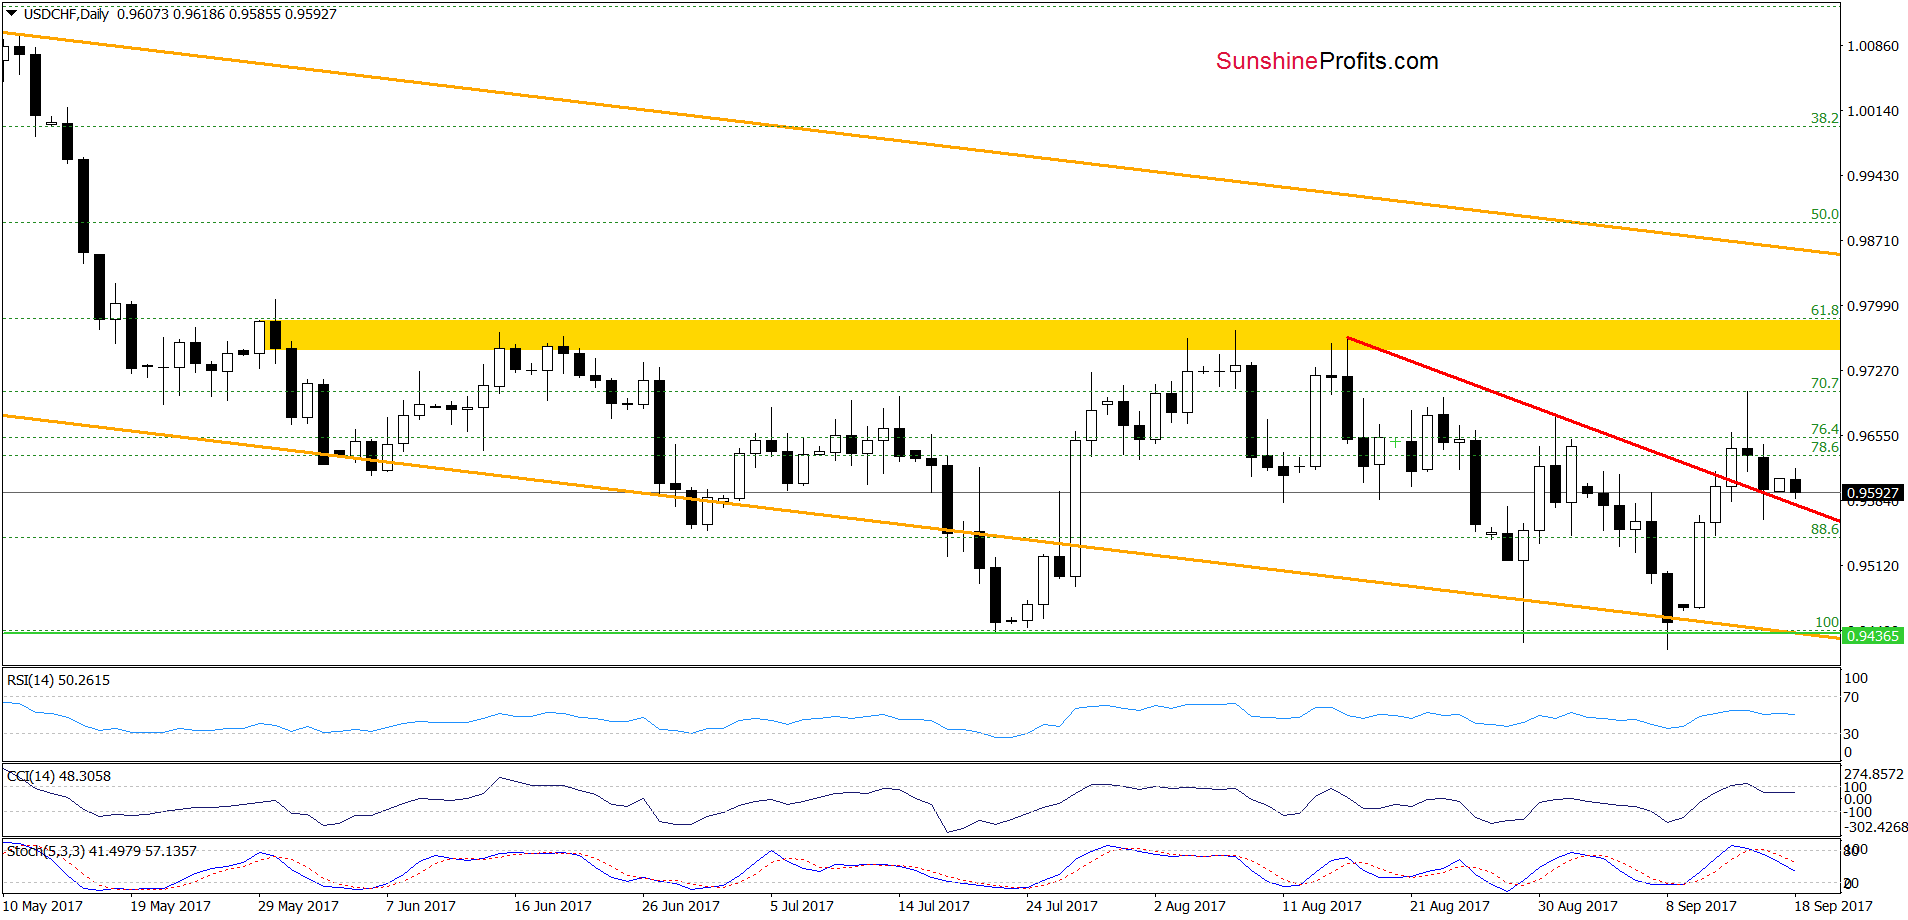
From today’s point of view, we see that although USD/CHF broke above the red declining resistance line based on the previous highs, currency bears stopped further improvement and the exchange rate didn’t even reach the yellow resistance zone. This show of bulls’ weakness triggered a pullback which took USDCHF to the previously-broken red line. Such price action could be a verification of the earlier breakout, but taking into account the sell signals generated by the indicators, it seems to us that that lower values of the exchange rate should not surprise us in the coming week. Therefore, if USD/CHF closes one of this week sessions below the red support line, we could even see a re-test of the long-term blue support line in the following days.
Very short-term outlook: mixed
Short-term outlook: mixed
MT outlook: mixed
LT outlook: mixed
Naturally, the above could change in the coming days and we’ll keep our subscribers informed, but that’s what appears likely based on the data that we have right now. If you enjoyed reading our analysis, we encourage you to subscribe to our daily Forex Trading Alerts.
Thank you.
Nadia Simmons
Forex & Oil Trading Strategist
Przemyslaw Radomski, CFA
Founder, Editor-in-chief, Gold & Silver Fund Manager
Gold & Silver Trading Alerts
Forex Trading Alerts
Oil Investment Updates
Oil Trading Alerts


