Yesterday, the U.S. dollar moved sharply lower against the Swiss franc, which resulted in a fresh weekly low. Earlier today, USD/CHF rebounded slightly, but will we see further improvement?
EUR/USD
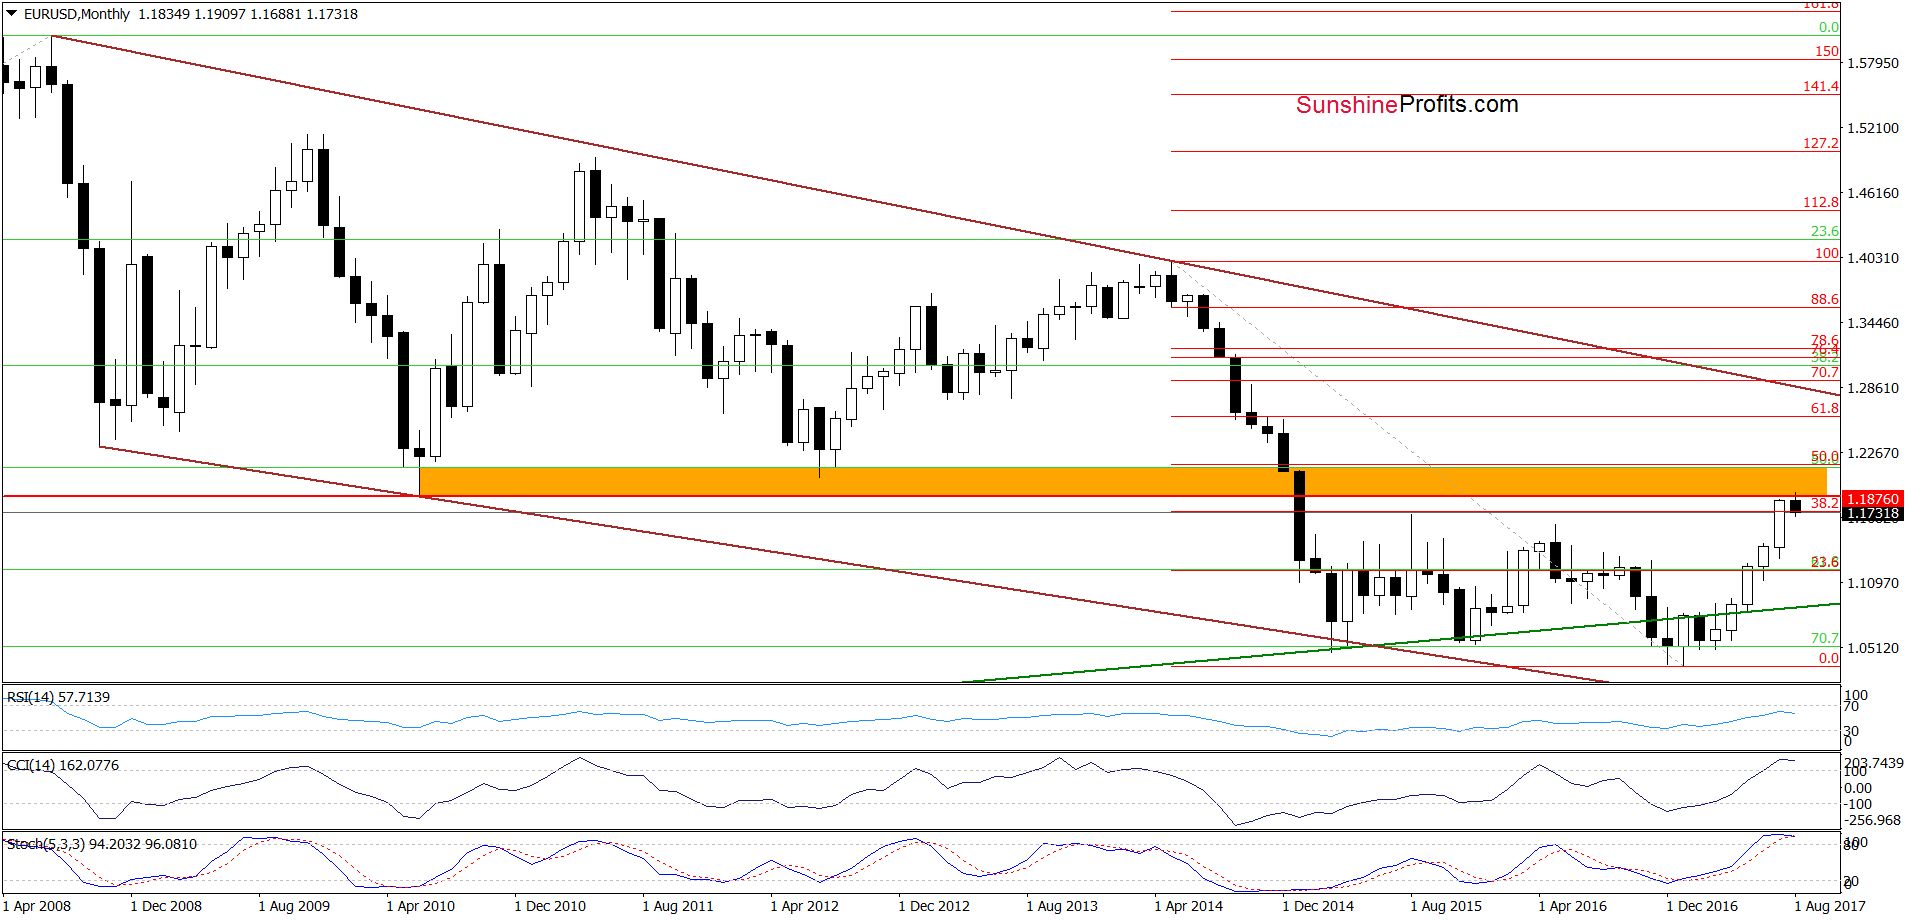

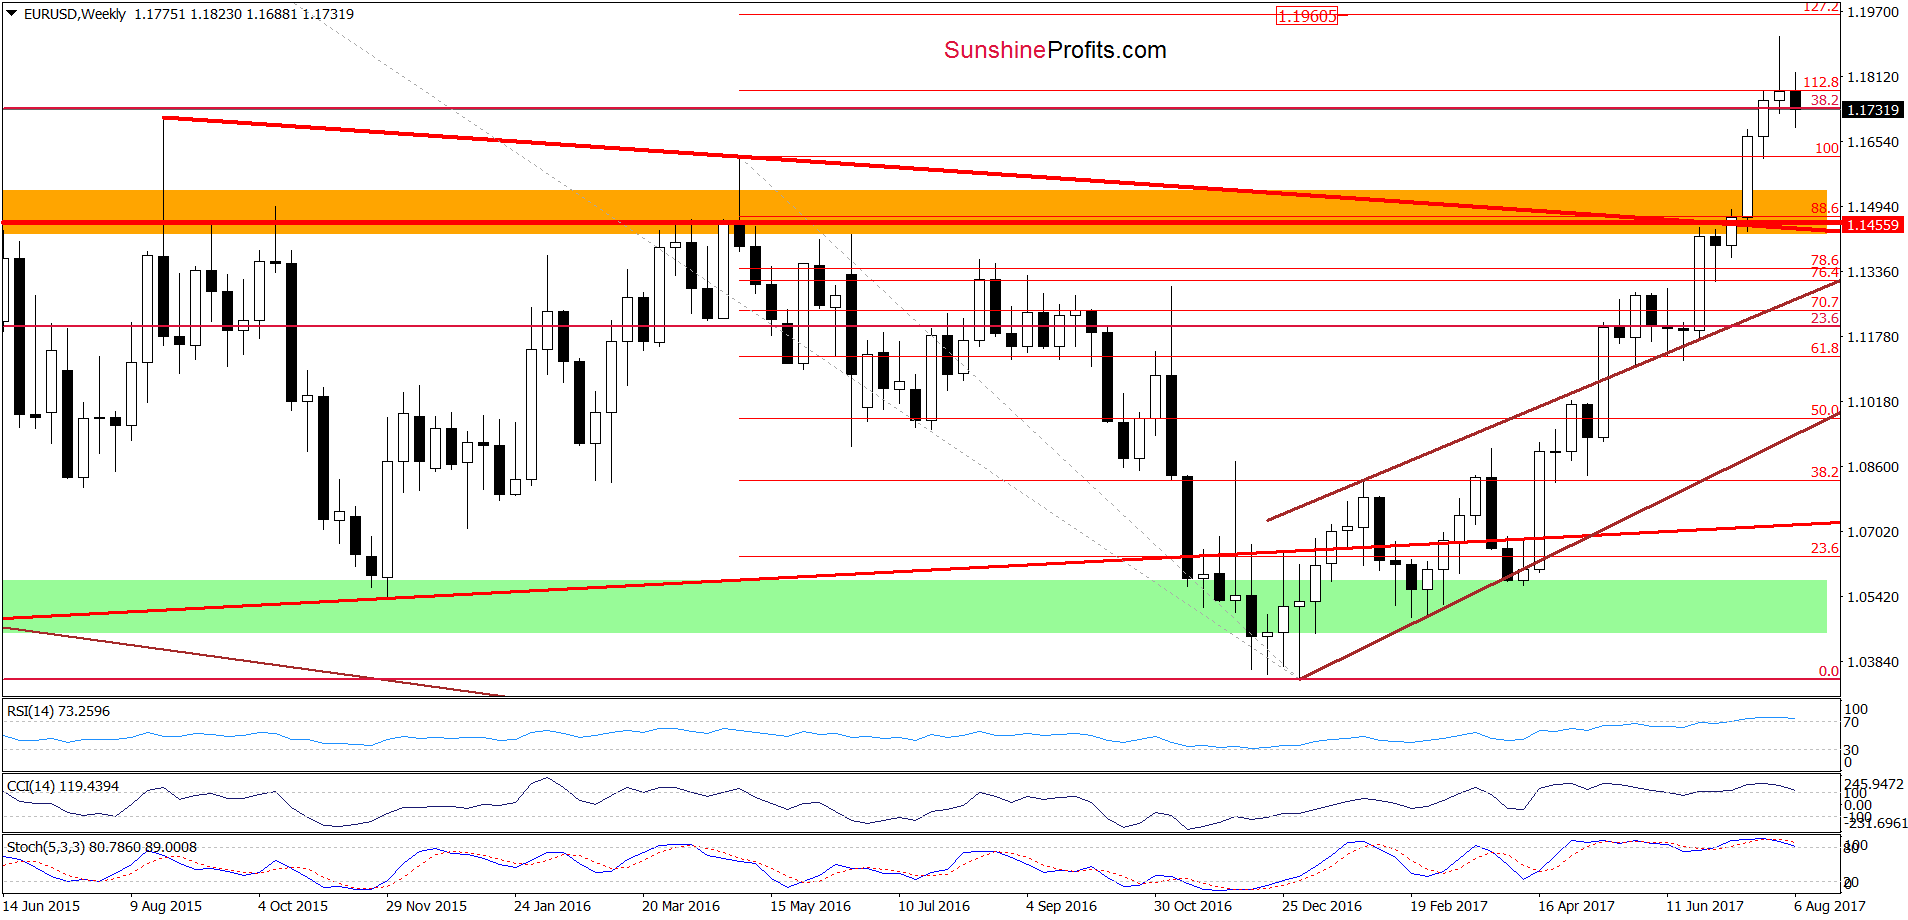
Although EUR/USD moved lower and slipped slightly below the 38.2% Fibonacci retracement and the 112.8% Fibonacci extension earlier this week, currency bulls pushed the pi little higher, which means that the overall situation hasn’t changed much as the exchange rate wavers around these levels. When can we expect a bigger move to the downside? In our opinion, such price action will be likely and reliable only if EUR/USD closes this week below these levels. Until this time, very short-lived moves in both directions should not surprise us.
Very short-term outlook: mixed with bearish bias
Short-term outlook: mixed with bearish bias
MT outlook: mixed
LT outlook: mixed
GBP/USD
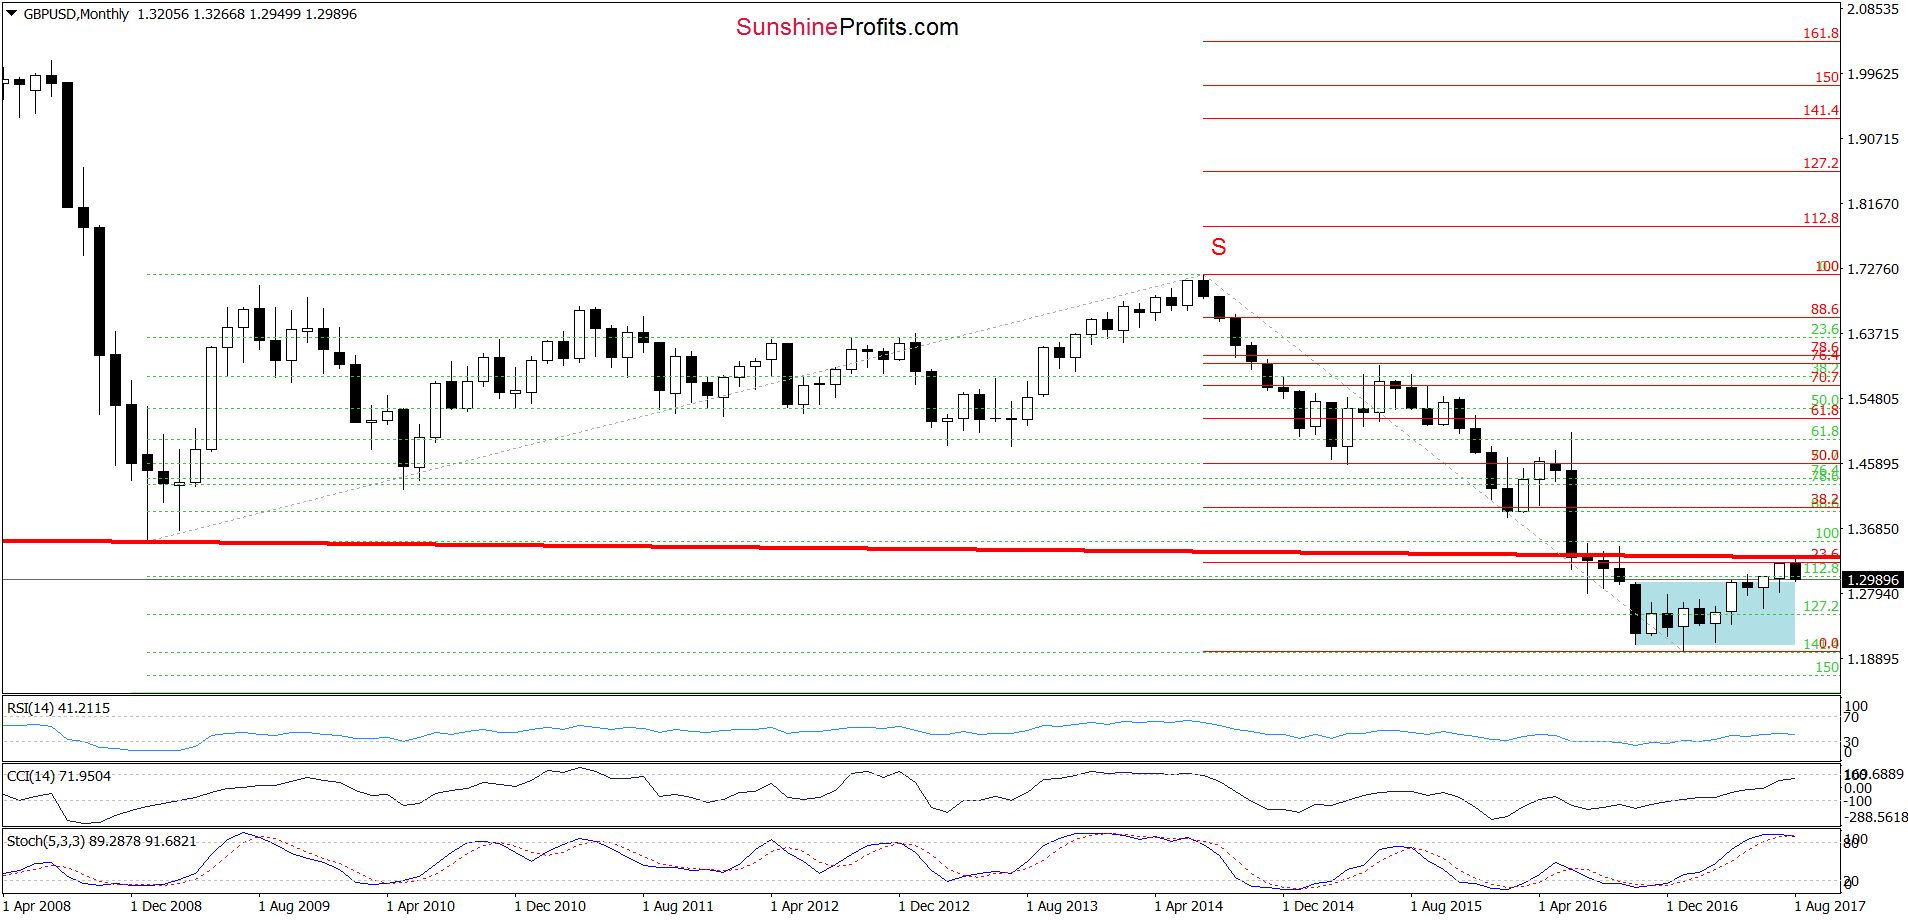
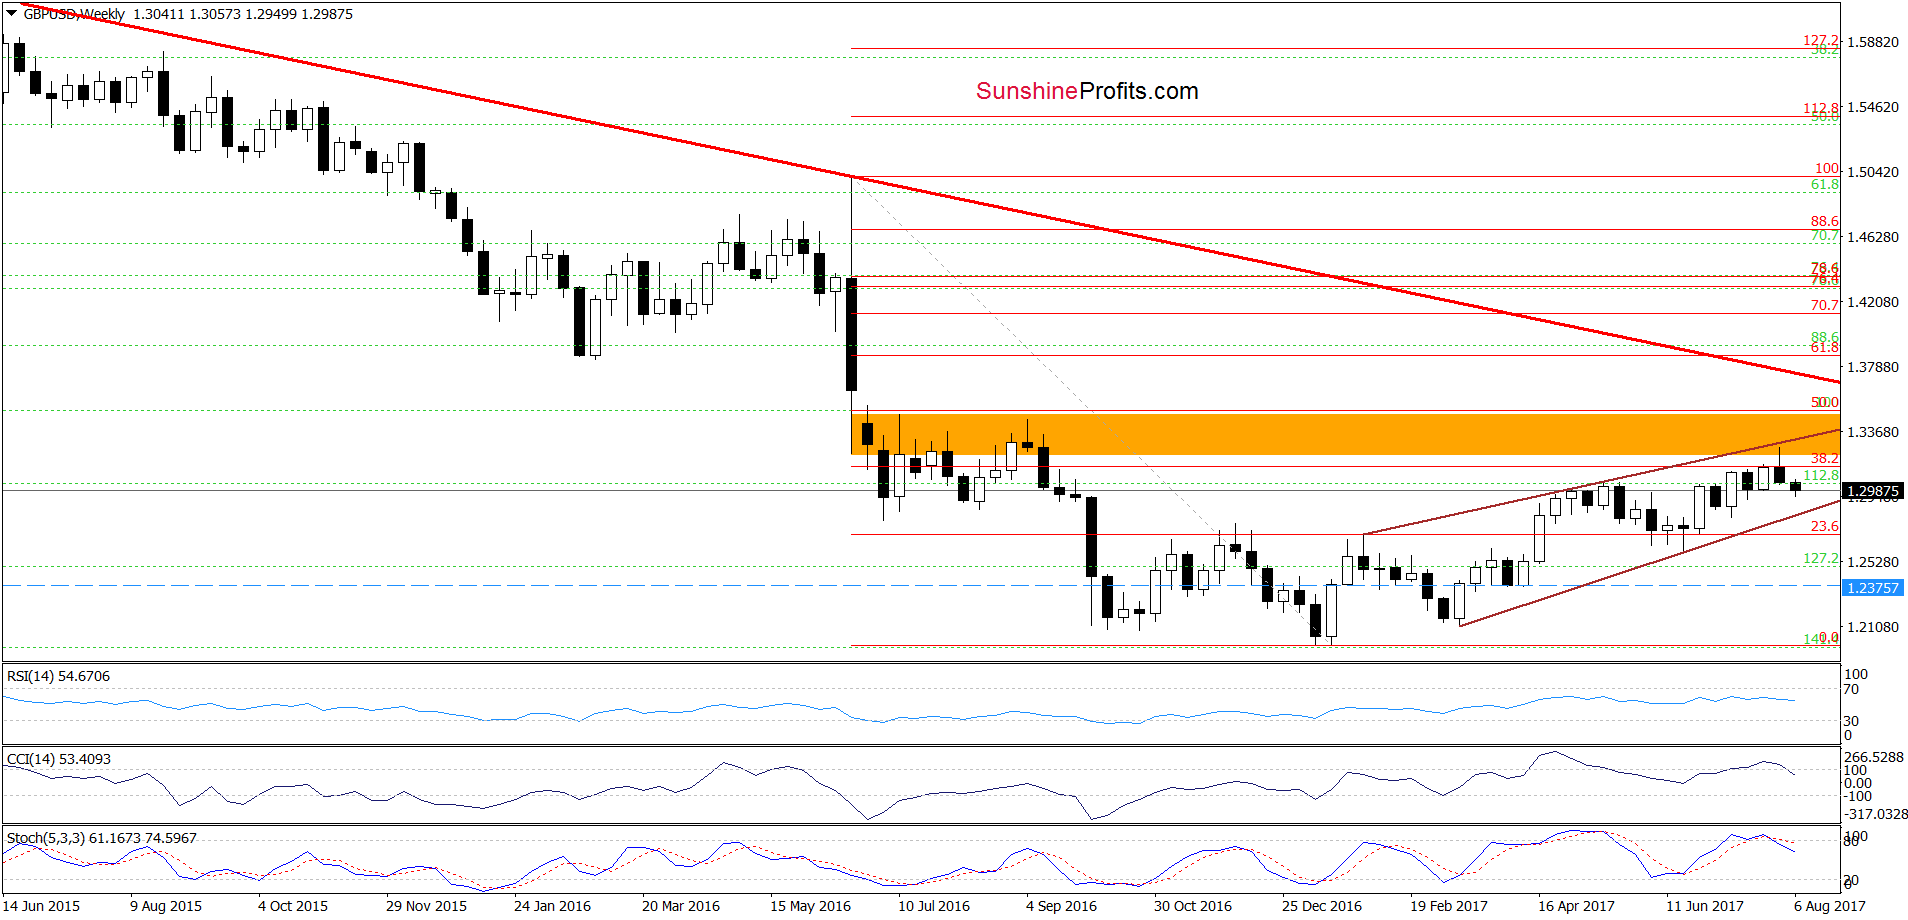
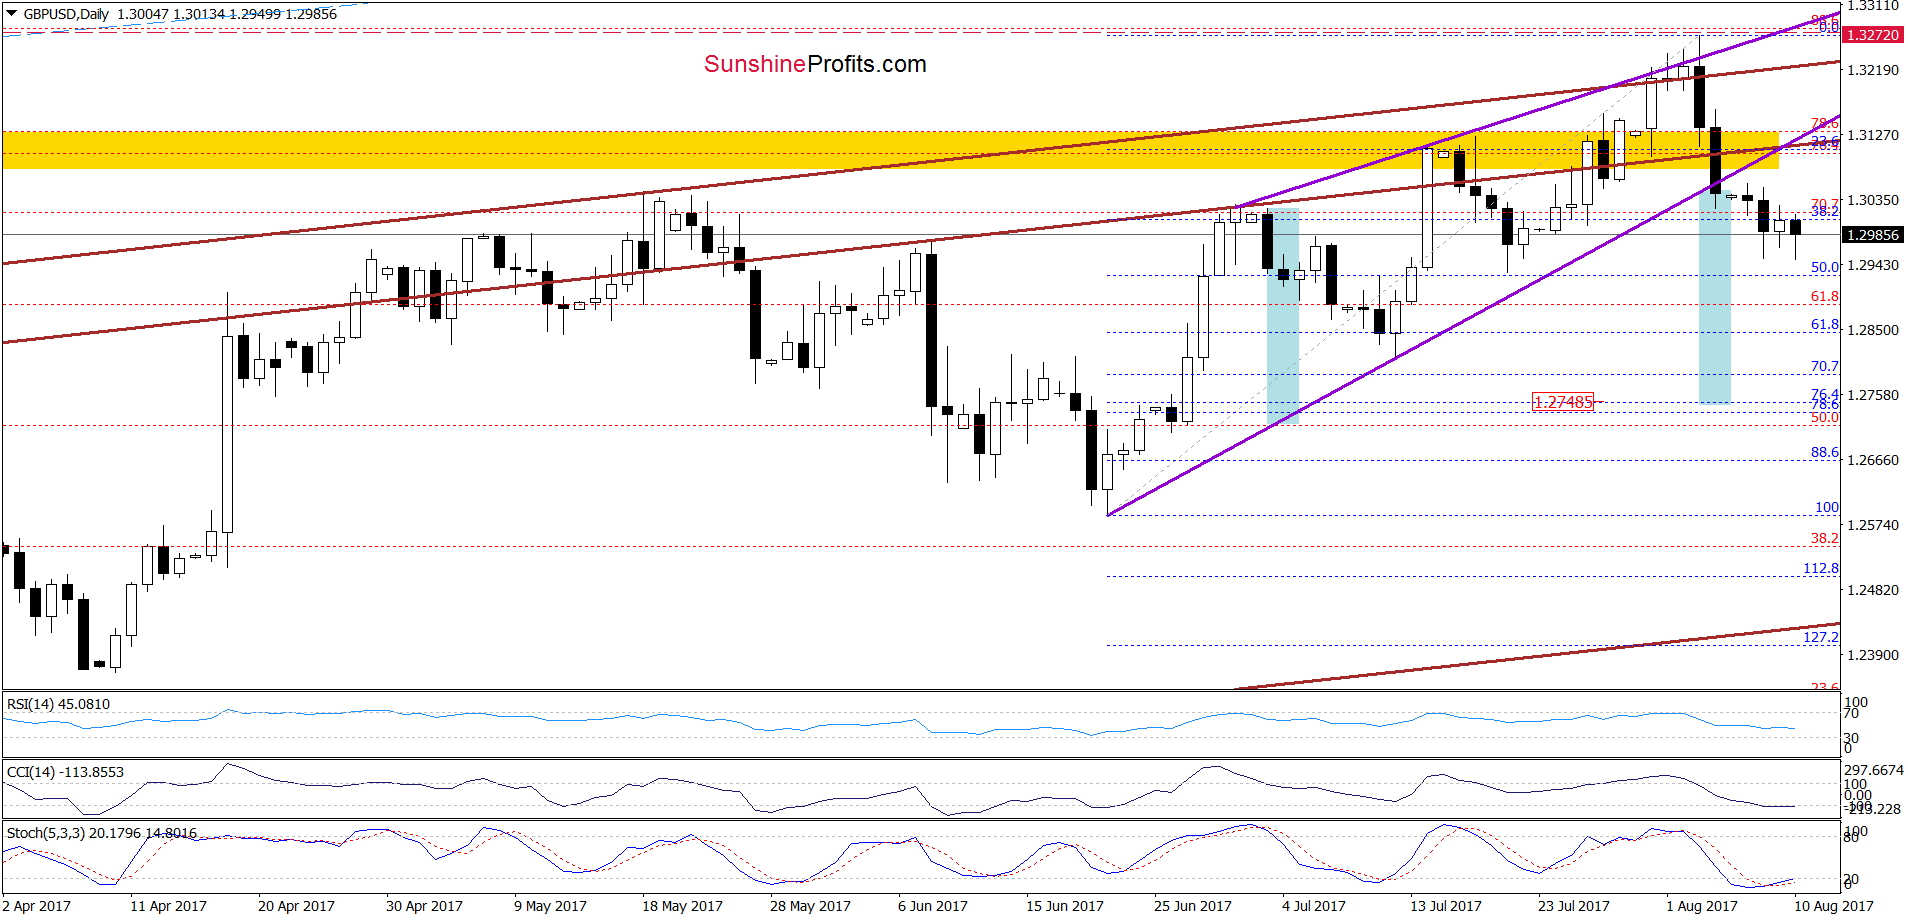
Looking at the charts, we see that GBP/USD moved lower in recent days, which suggests that we’ll see realization of our Monday’s scenario in the coming days:
(…) the last week downward move took GBP/USD not only below the upper border of the purple rising wedge but also under both brown resistance lines and the yellow resistance zone, which resulted in an invalidation of the breakouts above all these levels. On top of that, the exchange rate closed the previous week below the lower border of the purple rising wedge, which opened the way to lower levels. Therefore, if GBP/USD extends declines from current levels, we’ll see a drop to (at least) 1.2748, where the size of the downward move will correspond to the height of the rising wedge and where the 76.4% and 78.6% Fibonacci retracements are.
Very short-term outlook: bearish
Short-term outlook: mixed with bearish bias
MT outlook: mixed with bearish bias
LT outlook: mixed
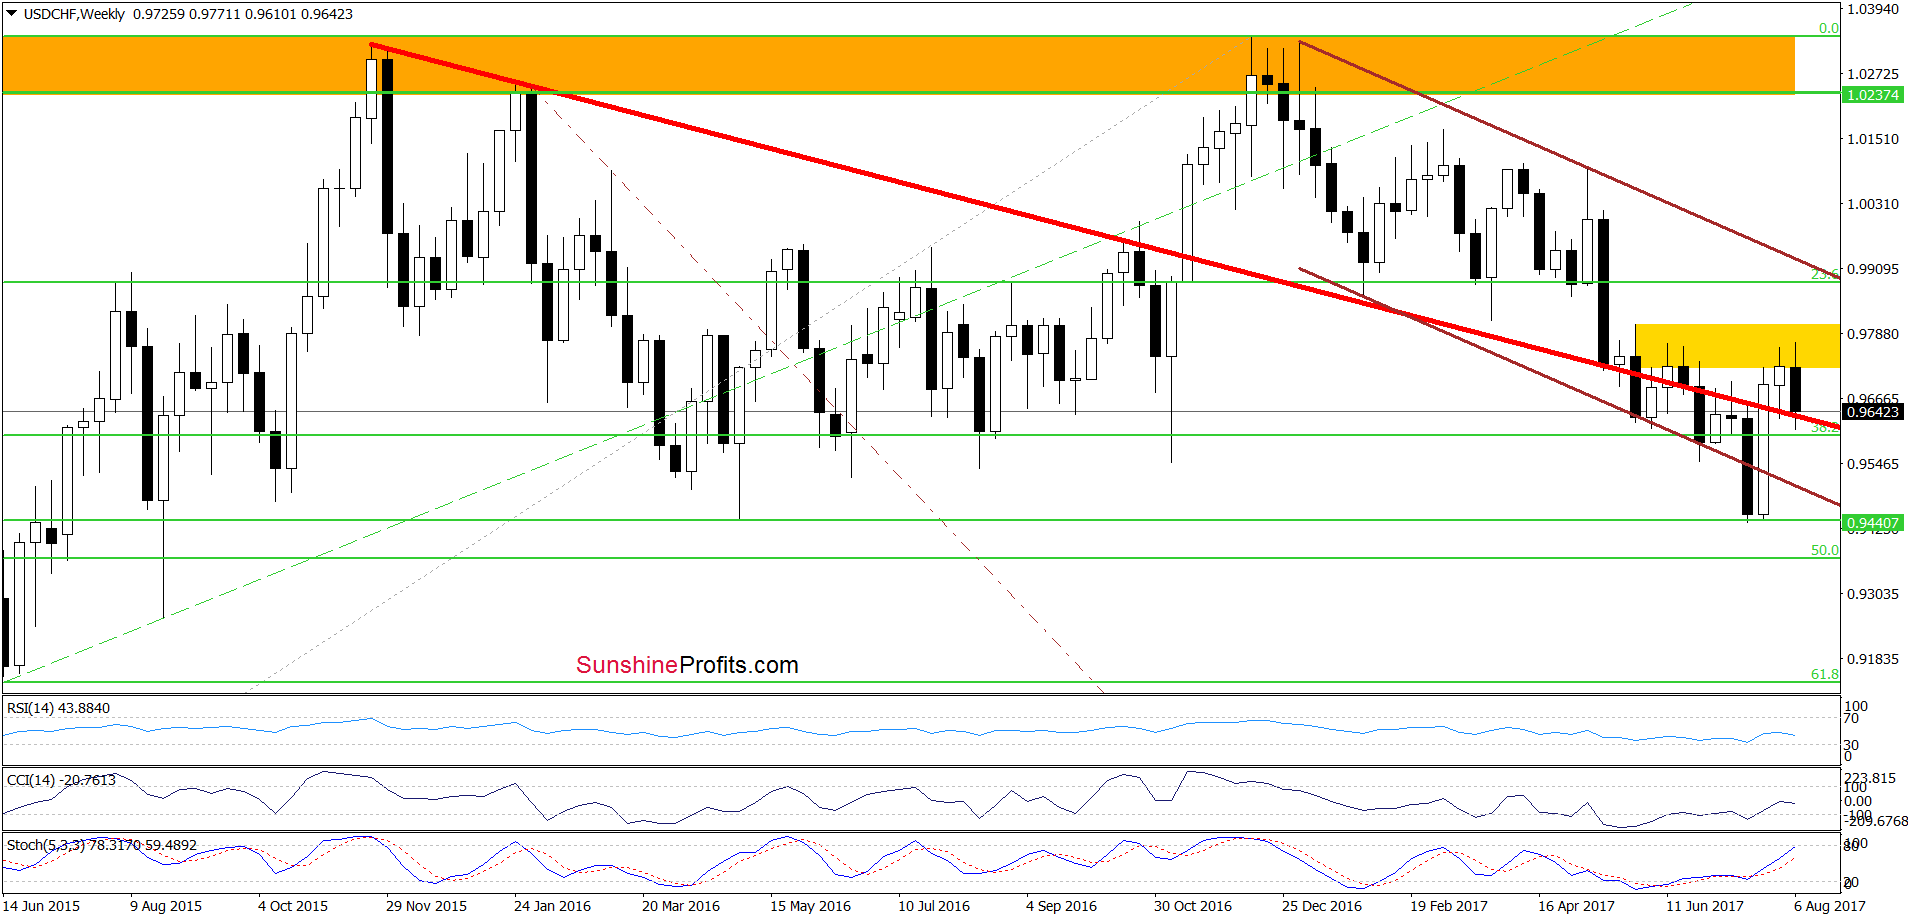
USD/CHF
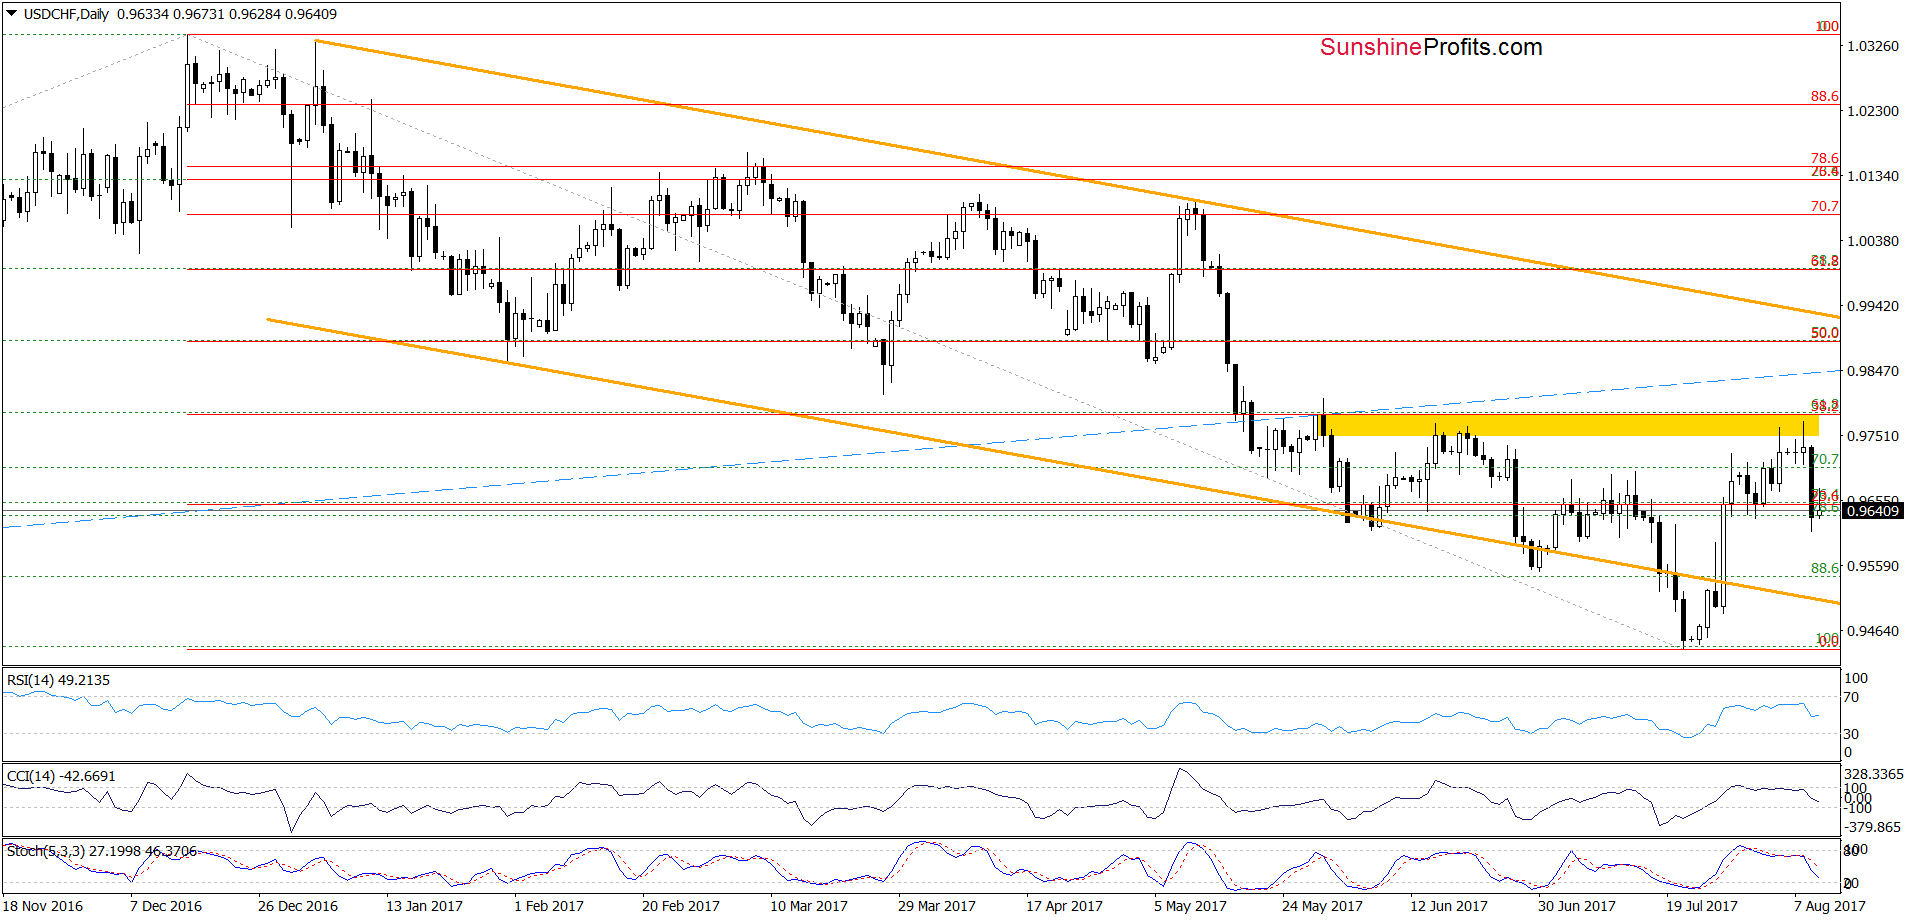
On Tuesday, we wrote the following:
(…) After Friday’s upswing the pair started consolidation, which suggests that one more upswing and a test of the 38.2% Fibonacci retracement can’t be ruled out. Nevertheless, the sell signals generated by the daily indicators indicate that the space for increases may be limited and reversal in the coming days is likely. If this is the case and the exchange rate moves lower from current levels, the first downside target will be around 0.9630, where the last week’s low is.
From today’s point of view, we see that the situation developed in line with the above scenario as USD/CHF reversed and declined. Thanks to yesterday’s drop the exchange rate slipped under our first downside target, which together with the sell signals generated by the daily indicators suggests further deterioration.
How low could the pair go?
In our opinion, if USD/CHF extends declines from here, the next target for currency bears will be around 0.9508-0.9515, where the 76.4%, 78.6% Fibonacci retracements (based on the recent rebound) and the lower border of the orange declining trend channel are.
Very short-term outlook: mixed with bearish bias
Short-term outlook: mixed with bearish bias
MT outlook: mixed
LT outlook: mixed
Naturally, the above could change in the coming days and we’ll keep our subscribers informed, but that’s what appears likely based on the data that we have right now. If you enjoyed reading our analysis, we encourage you to subscribe to our daily Forex Trading Alerts.
Thank you.
Nadia Simmons
Forex & Oil Trading Strategist
Przemyslaw Radomski, CFA
Founder, Editor-in-chief, Gold & Silver Fund Manager
Gold & Silver Trading Alerts
Forex Trading Alerts
Oil Investment Updates
Oil Trading Alerts


