The idea of endlessly repeated cycles is a very old one. This is how the ancients perceived time: not as linear sequence of events, but as replaying patterns of dark and golden ages. Although the Judeo-Christian culture changed the way we view time, we like to see the market as an area of constant struggle between bulls and bears, and the resulting upward and downward trends.
Since the end of the Bretton Woods system back in the early 1970s, the U.S. dollar has also moved in trends and cycles. Due to data availability, the chart below shows the trade weighted index of the greenback against the currencies of America’s major trading partners from 1973 until January 2018, with bull and bear markets marked with green and red arrows.
Chart 1: Bull and bear markets in the U.S. dollar (Trade Weighted Index against major U.S. trading partners) from 1973 to January 2018.
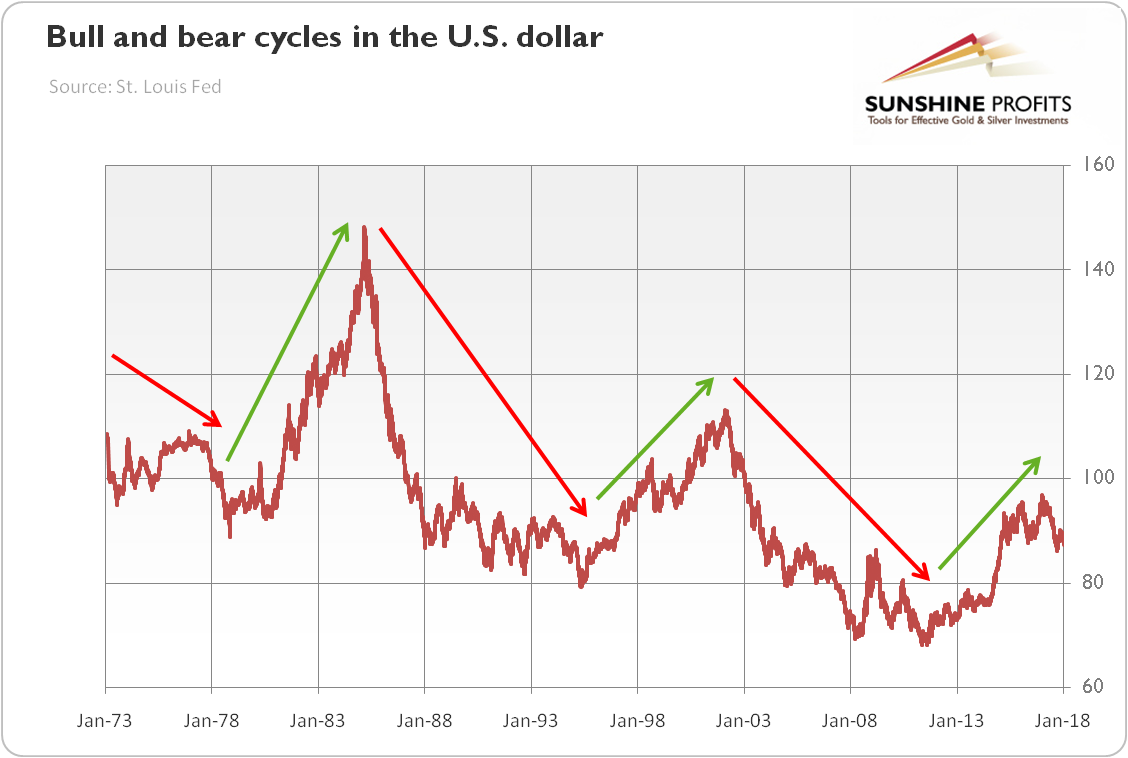

Observing closely, we can distinguish three bull markets and three bear markets (assuming that we are still in the bull market). When President Nixon closed the gold window in 1971, the U.S. dollar entered a bear market which lasted until 1978. Then, the bull market started, as Paul Volcker, a Fed Chair at the time, was squeezing inflation. The Plaza Accord, which was an international agreement to depreciate the U.S. dollar, ended the rally in that currency. It halted in 1995, as the funds flew more intensely to the U.S. stock market to participate in the tech boom. The appreciation endured until early 2002, a short period after the 9/11 terrorist attacks and the implosion of the dot-com bubble. The following bear market persisted until 2011, when the U.S. economy roughly recovered after the Great Recession. Then, the most recent bull market set forth. Depending on the perspective, it either terminated in 2016, or it still lasts, and we experience only a correction on the way.
Let’s analyze the statistical properties of the past cycles, which are presented in the table below, to predict the future U.S. dollar’s moves (as of mid-January 2018).
Table 1: Historical U.S. dollar cycles from 1971 (1973) to 2018.
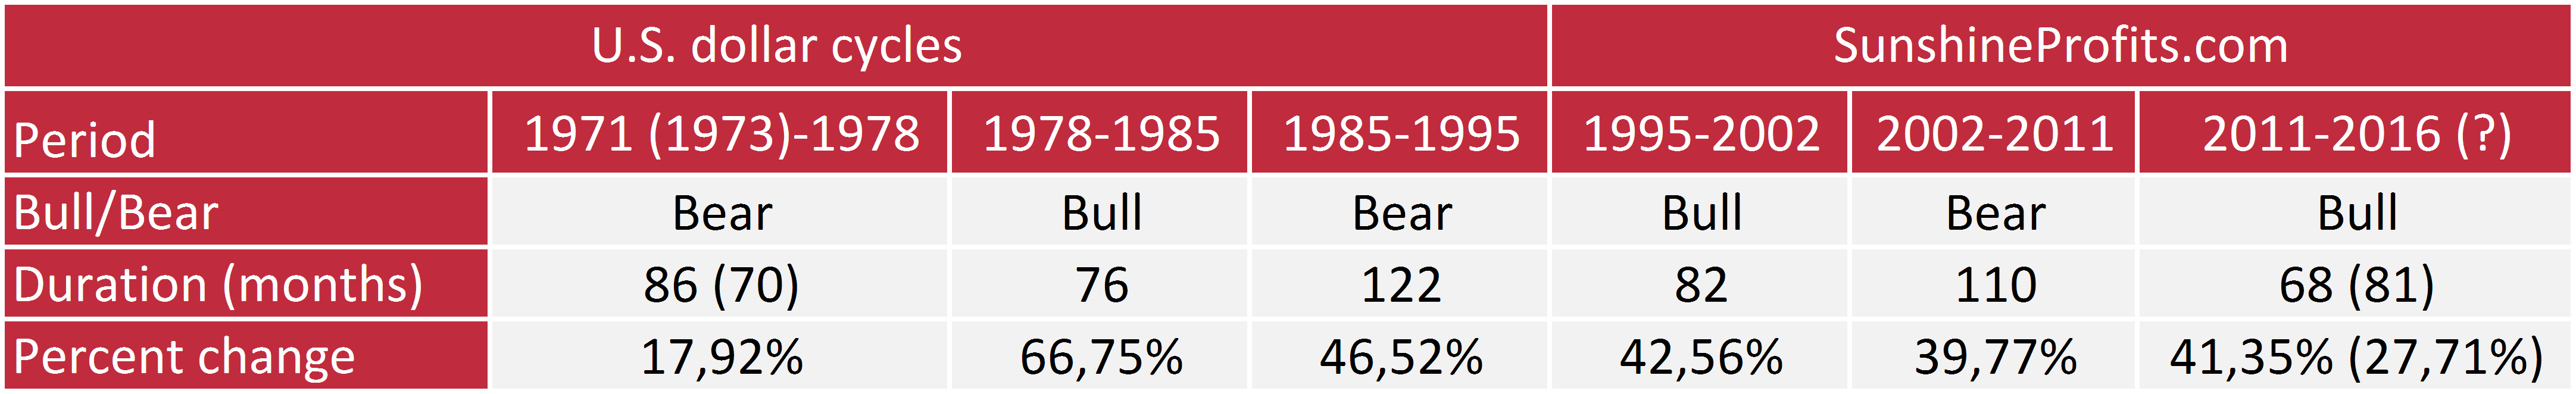
The typical bear market lived almost 9 years (106 months) and the greenback lost on average about 3.3 percent annually. But what is now more important is that the two first bull markets lasted on average 79 months, or slightly above 6 and a half years, and the greenback typically appreciated about 6.9 percent annually at that time. What does it imply for the current outlook? Well, assuming that that the bull market still continues, it would already last 81 months. So it would be quite old.
On the other hand, the U.S. dollar is just 27.5 percent stronger than in 2011, while the average cumulated gain was about 54.7 percent. It would imply that the greenback has much more potential to rise, as it would have to reach about 105.37 points to terminate the bull market. It goes without saying that this would be a very negative conclusion for the gold market, as the yellow metal has an important negative correlation with the American currency.
However, if the bull market ended in December 2016, it would last only 68 months, so it would be relatively short. But the cumulated gain in that period was 41.35 percent, much closer to the average.
It’s hard to draw decisive conclusions, since various criteria tell different stories. Based on duration, the current bull market is quite old, but based on percentage change, we are probably still in a bull cycle. Since the cycles do not die of old age, we are inclined to be of the opinion that we experience a correction in the secular bull market, which should support the shiny metal for a while. The U.S. dollar lost more than 10 percent since the December 2016 – it’s a significant decline, but not radically outside the norm.
Having said that, investors should be very cautious to draw conclusions on such a limited data series. There were only two bull markets before, so their potential to be used in statistical analysis is limited. But we can say that the recent bull market has been long enough to now trigger a period of weakness in the U.S. dollar. You can call it “bear market” or “correction” – it’s not about the words.
It’s about the revival of the Eurozone (and worries about Trump’s economic policy and the U.S. reliability as a military ally). Hence, the greenback may depreciate further against the euro in the medium-term. In other words, as the U.S. economy stops being far ahead of other major economies, the U.S. dollar wouldn’t be the only reasonable choice in town. It would be a bullish scenario for gold. However, we cannot exclude that the Fed’s tightening cycle may support the greenback eventually. Anyway, being close to the previous major lows, the USD Index seems to be at a decisive point and we should see relatively soon if the decline continues or if a major turnaround takes place instead.
If you enjoyed the above analysis and would you like to know more about the U.S. dollar and gold cycles, we invite you to read the February Market Overview report. If you’re interested in the detailed price analysis and price projections with targets, we invite you to sign up for our Gold & Silver Trading Alerts. If you’re not ready to subscribe yet and are not on our gold mailing list yet, we urge you to sign up. It’s free and if you don’t like it, you can easily unsubscribe. Sign me up.
Thank you.
Arkadiusz Sieron, Ph.D.
Sunshine Profits‘ Gold News Monitor and Market Overview Editor
Gold News Monitor
Gold Trading Alerts
Gold Market Overview


