TRUMP Sledgehammering AMAZON Nail into 2009 Bull’s Coffin
Amazon (AMZN) is the ninth nail in the 2009’s Bull’s Coffin. Since last week President Trump with his tweets has been personally sledge hammering in the ninth nail. His relentless attacks will make it very difficult for Amazon shares to eclipse their March 2018 high. This in turn will further decrease the probability that the S&P 500 will be able to get back above its January 2018 all-time high. The result has been Amazon’s share price declining by 14% from its all-time high that it made last month.

Amazon being named the ninth nail was not due to concerns that its financial performance might wane.It’s because Amazon accounts for 2.7% of the S&P 500’s weightings. Throw in Google (GOOGL) (Alphabet) and Microsoft (MSFT) and the four digital technology titans account for 10.2% of the S&P 500’s weighting.

Amazon and fellow eighth nail Facebook (FB) combined weightings account for 4.3% of the S&P 500. Both were the key drivers of the 2009 bull market. With the prospects being that both of them will not likely be able to take out their all-time highs anytime soon it will be very difficult for the S&P 500 to make new highs.


In addition to the new developments pertaining to Facebook and Amazon the S&P 500 closed below its 200-day moving average yesterday. This is a bad omen. With the technicals now indicating the that index has further to decline it will be even more difficult for the S&P to climb back above its highs.

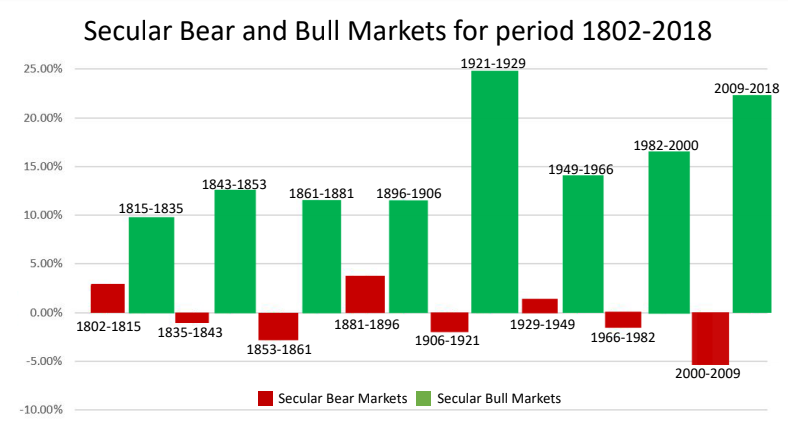
The eighth nail that preceded Amazon’s was Tesla (TSLA). See “Tesla is 8th Nail in Bull’s Coffin”. Each additional nail increases the probability that the market will not get back to its January 2018 all-time high for at least eight years. This is because it’s likely the new secular bear market was born in January 2018. The table below which includes the eight secular bulls and bears since 1802.
The chart below which depicts the stock market’s bubbles since 2007 is based on the price history of the S&P 500 versus long-term US government bonds for the period of 2003 through February 2018. The large bubble which had been in place prior to the election of Donald Trump as U.S. President has expanded significantly.

I have been monitoring this bubble since 2016. It was originally discovered from my crash research that I have been conducting since the Bank of Japan (BOJ) instituted a Negative Interest Rate Policy (NIRP) in February 2016. My research enabled me to find the bubble and other historical anomalies or distortions in the capital markets that have been present for the last several years. Watch the video below to view the charts and graphs for the anomalies and distortions which have put the markets on the precipice of a crash.
To insure access to all of my articles, reports and alerts covering the new bear market which was born on January 31, 2018 (see my February 6, article “BULL DEAD, BEAR DOB 01/31/18: Expect Stock Market Decline of at Least 50%”) sign up for the free newsletter at http://www.dynastywealth.com/news-nviro-1.php. Additionally, all of my updates including my play by play on the 2018 crash upon its commencing will be sent to the newsletter’s subscribers.
I am recommending the deployment of a 90/10 Crash Protection Strategy. For information on the strategy which is the only fail-safe strategy that one can utilize to protect their liquid assets from crashes, recessions and depressions view video below entitled “Crash! & 90/10 Crash Protection Strategy”.
My crash research that I began to conduct in 2016, resulted in my developing an algorithm that I utilized to issue market crash warnings during 2016 when negative interest rates posed great risks to the global economy. See www.equities.com article “NIRP Crash Indicator Signals Very Reliable for 2016”. Due to the ebbing of negative rates in 2017, after Mr. Trump’s election as President and the unprecedented low stock market and especially currency volatility, the NIRP Crash Indicator was disengaged in March of 2017.See www.equities.com article “No Longer a Need for NIRP Crash Indicator Signals”. Upon currencies volatility picking up the NIRP Crash Indicator will be re-engaged.Its warnings will be available to Trophy Investing’s members.
Disclaimer.Mr. Markowski’s predictions are frequently ahead of the curve. The September 2007 predictions that appeared in his EquitiesMagazine.com column stated that share-price collapses of the five major brokers, including Lehman and Bear Stearns, were imminent. While accurate, they proved to be premature. For this reason he had to advise readers to get out a second time in his January 2008 column entitled “Brokerages and the Sub-Prime Crash”. His third and final warning to get out, and stay out, occurred in October of 2008 after Lehman had filed for bankruptcy.In that article “The Carnage for Financials Isn’t Over” he reiterated that share prices for Goldman and Morgan Stanley were too high. By the end of November 2008, the share prices of both had fallen by an additional 60% and 70%, respectively — new all-time lows.


