
Market-Directional Investing (MDI) is powerful because instead of trying to guess where the market will be going, we measure where the market is right now. That’s the key to being a successful investor in the stock market, writes Mike Turner.
But I don’t just look at one chart to make investment decisions. I look at several different charts before I decide how to invest for my clients. I’ll show you more about that a little later in the article. In last week’s article, I introduced you to the concept of Market-Directional Investing. If you missed it or want to read it again, you can click here.
This is where I start. Here’s my updated Market-Directional chart on SPY, the ETF for the S&P 500.
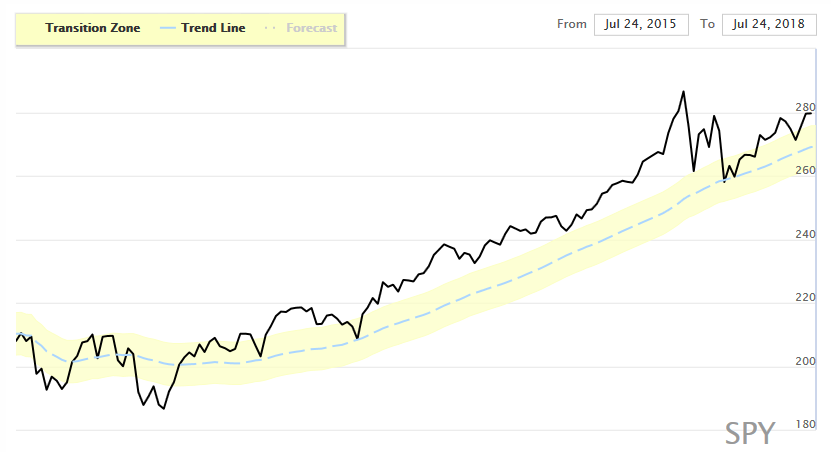

SPY is trading above the yellow transition zone. I set the current stop for SPY at one “Expected Move” below Friday’s closing price. The Expected Move (EM) is derived from the Black-Scholes formula and is different for each stock and ETF. It measures the normal weekly volatility of the stock. The current EM on SPY is $6.68. This puts my stop on SPY at $275.75.
Now is when I research my other indicators. I look at the Dow Jones Industrial Average (DJI), the S&P 400 Mid-Cap Index, the Nasdaq 100 Index (NDX), and the Russell 2000 Index (RUT). But instead of using the indexes themselves, I use the ETFs that represents the index.
So, I’m not just measuring the SPY ETF, but also the DJIA ETF
Currently, four out of five are measuring bullish. These are SPY, MDY, QQQ, and IWM. The ETF for the DJIA – DIA – is in the transition zone.
I also look at the inverse ETFs for the above tickers to be sure they’re giving me the same information.
And lastly, I look very closely at the condition of the individual sectors, again represented by their ETFs. The sectors give me a clue as to the underlying strength or weakness in the overall markets.
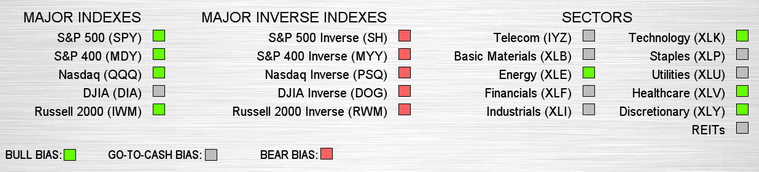
Right now, only four sectors are giving me a green signal, but none are giving me a bearish signal either. Therefore, I’m cautiously bullish on the major market averages.
This is the process I go through every weekend after my computers are done crunching the numbers. It’s this process that gives me the Market-Directional Investing advantage.
And if you’d like to come meet me in person, I’ll be at these upcoming MoneyShow events:
- The MoneyShow San Francisco – August 23-25.
- The MoneyShow Dallas – October 3-5.
Stop guessing and start measuring,
If you’re interested in learning more about how I manage money using the Market-Directional Investing methodology, you can read more here.
This article was originally published by MoneyShow.com: Founded in 1981, MoneyShow is a privately held financial media company headquartered in Sarasota, Florida. As a global network of investing and trading education, MoneyShow presents an extensive agenda of live and online events that attract over 75,000 investors, traders and financial advisors around the world.


