Briefly:
Intraday trade: Our Wednesday’s intraday trading outlook was neutral. It proved accurate, because the S&P 500 lost 0.1% following slightly higher opening of the trading session (+0.2%). The market fluctuates after its Friday-Monday rally. We still can see technical overbought conditions. However, there have been no confirmed negative signals so far. Therefore, we prefer to be out of the market again, avoiding low risk/reward ratio trades.
Our intraday outlook is neutral today. Our short-term outlook is neutral, and our medium-term outlook is neutral:
Intraday outlook (next 24 hours): neutral
Short-term outlook (next 1-2 weeks): neutral
Medium-term outlook (next 1-3 months): neutral
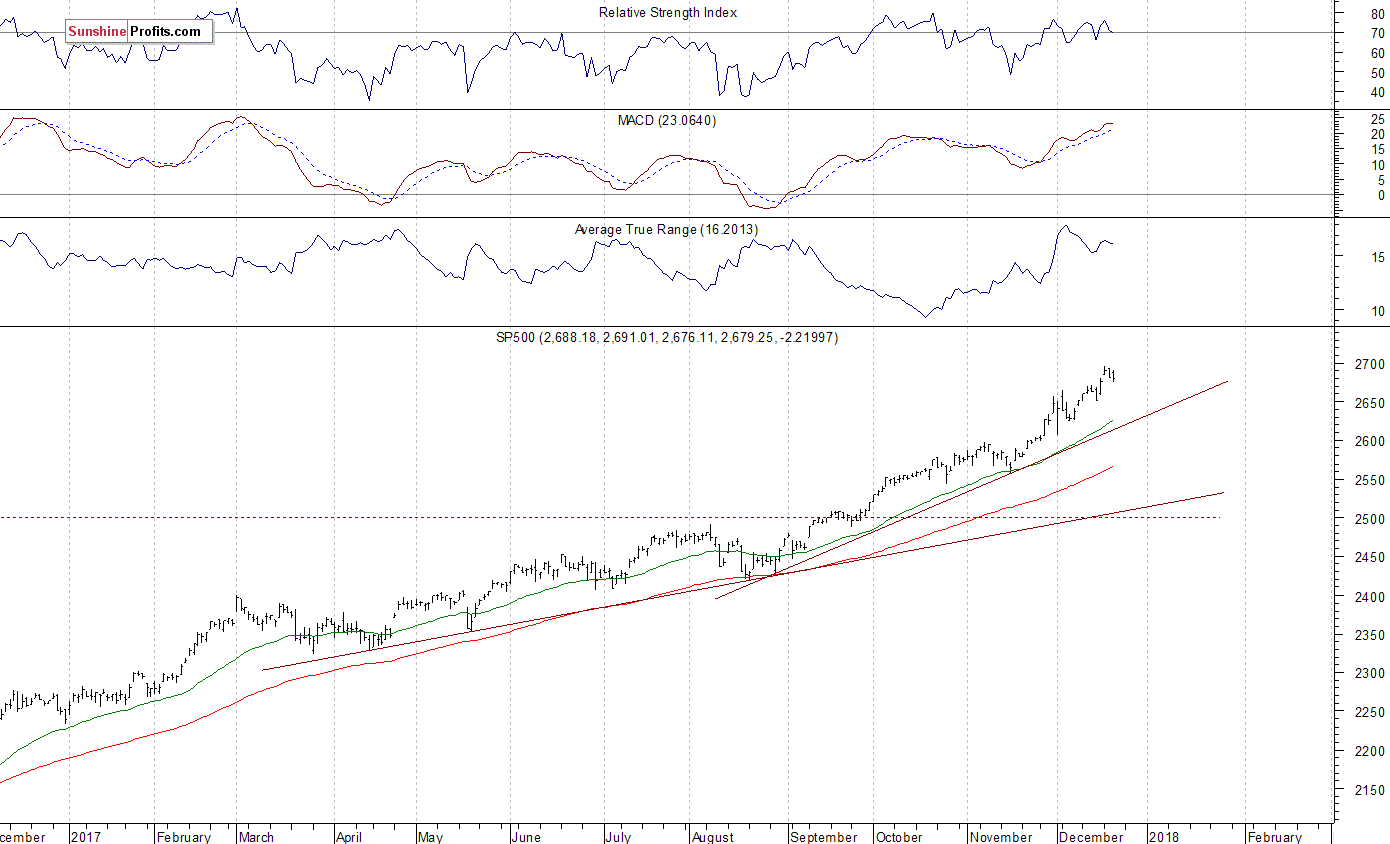
The main U.S. stock market indexes lost 0.05-0.1% on Wednesday, following higher opening of the trading session, as investors continued to take short-term profits off the table. The S&P 500 index trades around 0.6% below its Monday’s new all-time high of 2,694.97. The Dow Jones Industrial Average extended its three-day-long fluctuations along new all-time high, as it lost 0.1% yesterday. The technology Nasdaq Composite closed 0.05% lower following higher opening. The nearest important level of support of the S&P 500 index is at around 2,680, marked by Monday’s daily gap up of 2,679.63-2,685.92. The next support level is at 2,670, marked by recent consolidation. The level of support is also at 2,640-2,650, marked by the December 8 daily gap up of 2,640.99-2,644.10. On the other hand, resistance level is at around 2,695-2,700, marked by new all-time high. There have been no confirmed negative signals so far. However, we still can see medium-term technical overbought conditions along with negative technical divergences:

Positive Expectations Again
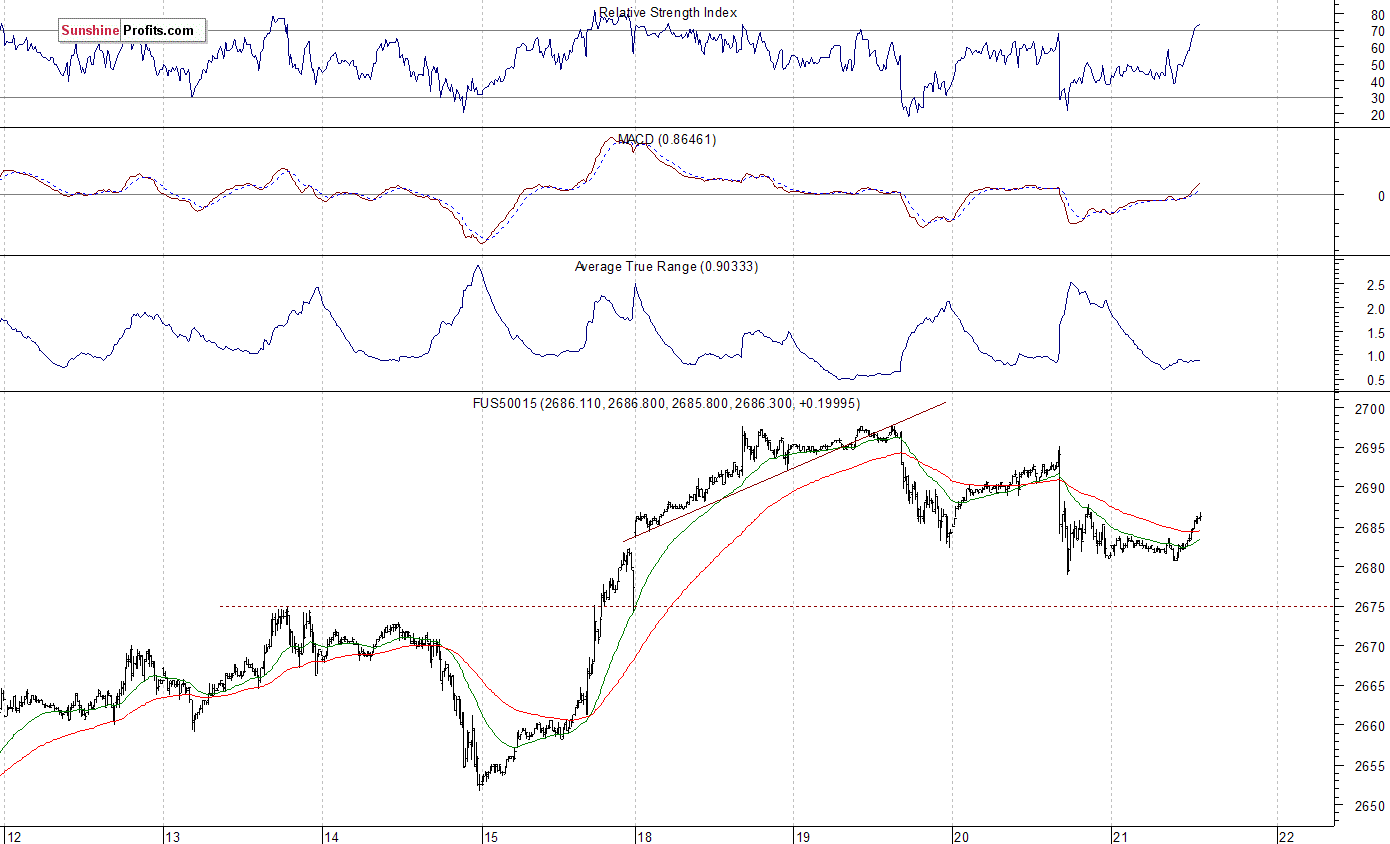
Expectations before the opening of today’s trading session are slightly positive, with index futures currently up 0.1-0.2% vs. yesterday’s closing prices. The European stock market indexes have gained 0.1-0.3% so far. Investors will wait for some economic data announcements: the U.S. GDP final number, Initial Claims, Philadelphia Fed Manufacturing Index at 8:30 a.m., Leading Indicators at 10:00 a.m. The market expects that GDP grew 3.3% and Initial Claims were at 232,000 last week. The S&P 500 futures contract trades within an intraday uptrend, as it retraces some of its yesterday’s move down. The nearest important level of support is at around 2,675-2,680. On the other hand, resistance level is at 2,695-2,700. The futures contract remains relatively close to new record high, as the 15-minute chart shows:
Nasdaq Also Higher
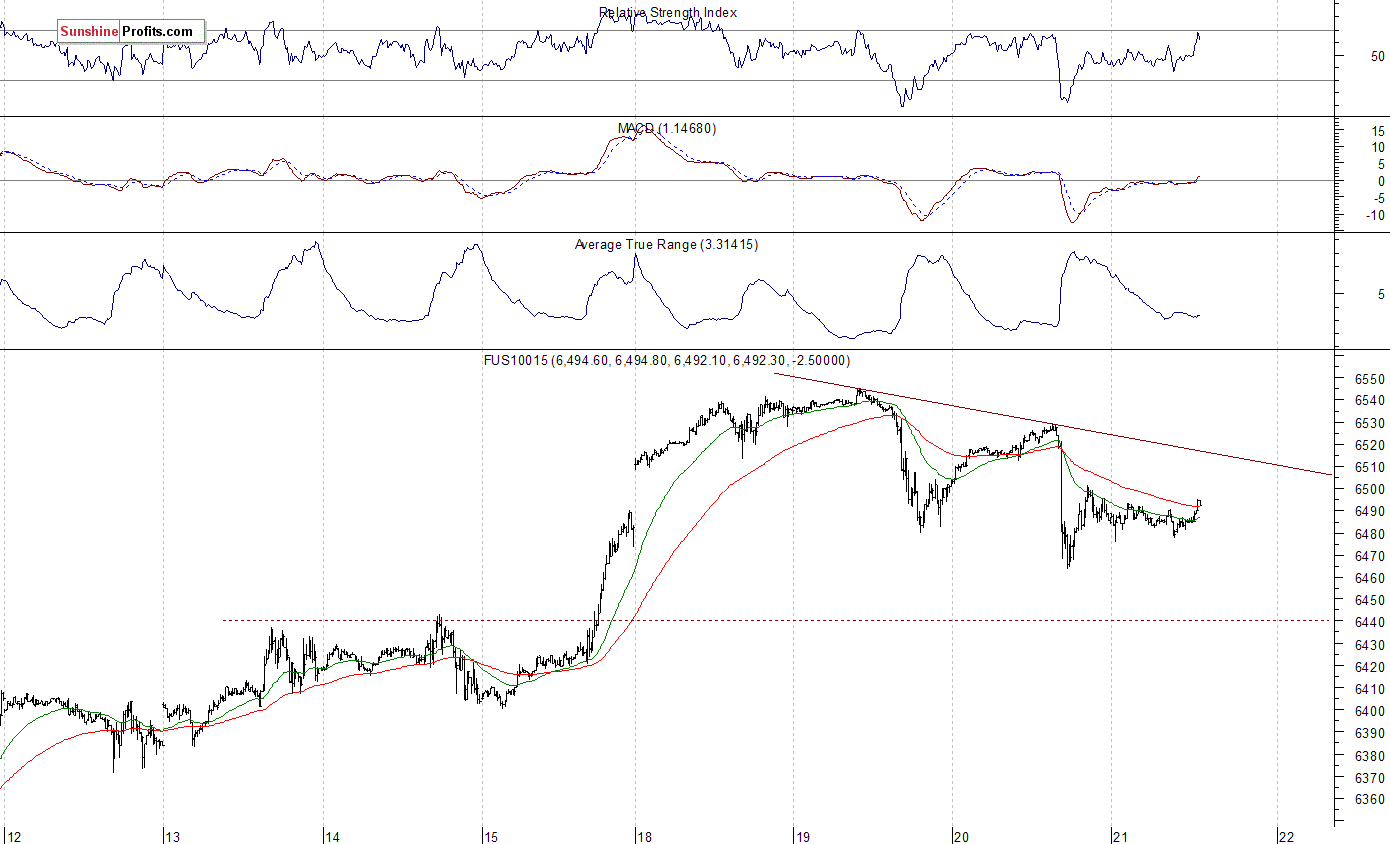
The technology Nasdaq 100 futures contract follows a similar path, as it retraces some of its Wednesday’s move down. It fluctuates slightly below the level of 6,500. The nearest important level of support is at around 6,460-6,480, marked by yesterday’s local lows. On the other hand, resistance level is at 6,500-6,520, among others. The Nasdaq 100 futures contract trades below its three-day-long downward trend line, as we can see on the 15-minute chart:
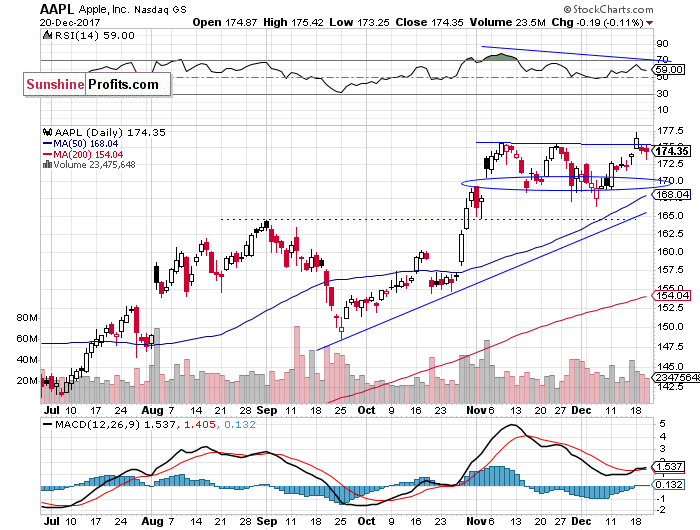
Let’s take a look at Apple, Inc. stock (AAPL) daily chart (chart courtesy of http://stockcharts.com). The price reached new record high on Monday, as it broke above $175 mark. However, it failed to continue that rally. The nearest important support level remains at around $170, marked by the early November daily gap up. Will short-term uptrend continue? Or is this still just over-month-long topping consolidation?
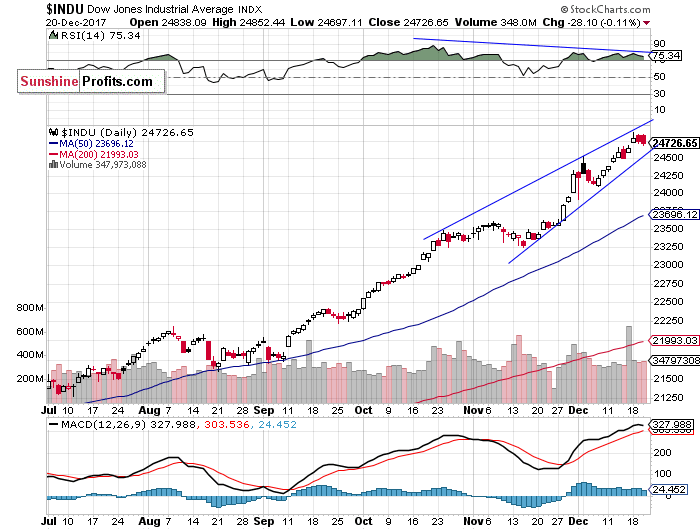
The Dow Jones Industrial Average daily chart shows that blue-chip index fluctuates following recent move up. We still can see negative technical divergences. The most common divergences are between asset’s price and some indicator based on it (for instance the index and RSI based on the index). In this case, the divergence occurs when price forms a higher high and the indicator forms a lower high. It shows us that even though price reaches new highs, the fuel for the uptrend starts running low. There is a potential two-month-long rising wedge pattern:
Concluding, the S&P 500 index lost 0.1% on Wednesday, as it extended its short-term fluctuations along Monday’s new record high. For now, it looks like a consolidation within an uptrend, and the broad stock market remains relatively close to record high. We still can see medium-term overbought conditions along with negative technical divergences. However, there have been no confirmed negative signals so far.
If you enjoyed the above analysis and would like to receive free follow-ups, we encourage you to sign up for our daily newsletter – it’s free and if you don’t like it, you can unsubscribe with just 2 clicks. If you sign up today, you’ll also get 7 days of free access to our premium daily Gold & Silver Trading Alerts. Sign up today!.
Thank you.
Paul Rejczak
Stock Trading Strategist
Stock Trading Alerts


