In last Tuesday’s technical update, I discussed why a rally last week was highly probable from a psychological, technical, fundamental, and seasonal perspective. However, the key message of that discussion was simply:
“There remains an ongoing bullish bias which continues to cling to the belief this is ‘just a correction’ in an ongoing bull market. However, there are ample indications the decade-long bull market has come to its inevitable conclusion.”
On Saturday, I explained why we “sold the rally” the preceding Friday morning:
“The combination of both the extreme oversold and deviated conditions contributed to a bounce which hit our ‘target neighborhood’ of 2740-2750 on Friday morning.
In accordance with our portfolio management strategy, when the markets reached our target zone yesterday morning we executed sells of positions that have been under-performing both the market and other holdings within our portfolios. As we have stated many times previously, one of the primary tenants of portfolio management is to ‘sell losers.“
Currently, there is a rising risk of further corrective actions as the previous tailwinds supporting the bull market have begun to shift to headwinds.
Stock Buybacks
We have discussed previously the short-term effect of the tax cut legislation last December on share buybacks. To wit:
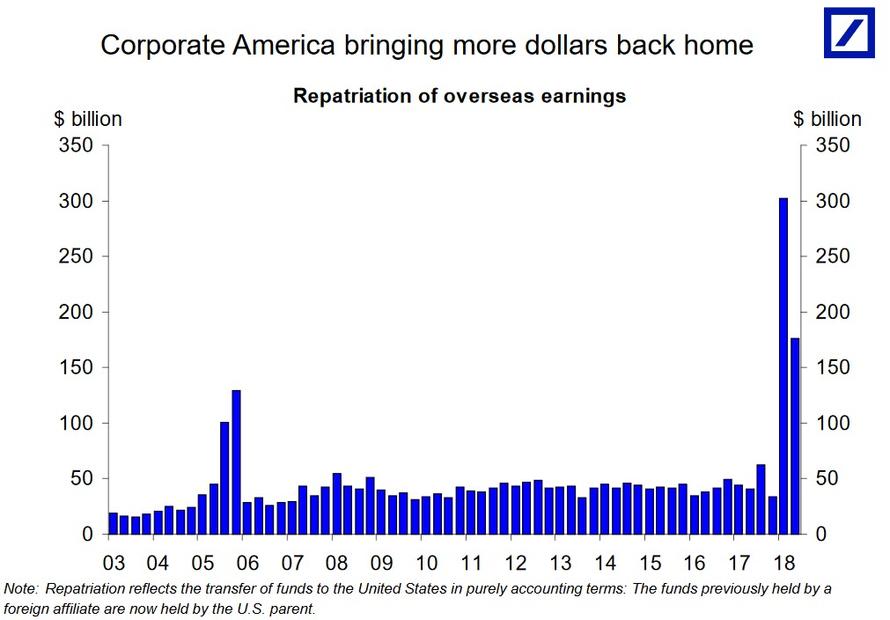
“The problem is that the tax plan may not provide the benefits as hoped. While President Trump suggests the plan will return ‘trillions’ of dollars locked up overseas to create jobs, the reality, according to Goldman Sachs, is likely closer to $250 billion that will primarily go to share buybacks, dividends, and executive compensation.”
That turned out to be a fairly accurate analysis as repatriation of dollars was roughly $300 billion, rather than the “trillions” as promised, in Q1. Importantly, that number is dropping sharply in Q2 as the incentive is being quickly absorbed. Via Zerohedge:

“After an initial record surge in the amount of US corporate cash repatriated from offshore jurisdictions (if only for accounting purposes, as the bulk of said cash was already largely invested in domestic securities via offshore entities) following Trump’s tax law overhaul and tax repatriation holiday, the movement of foreign cash has slowed sharply.”
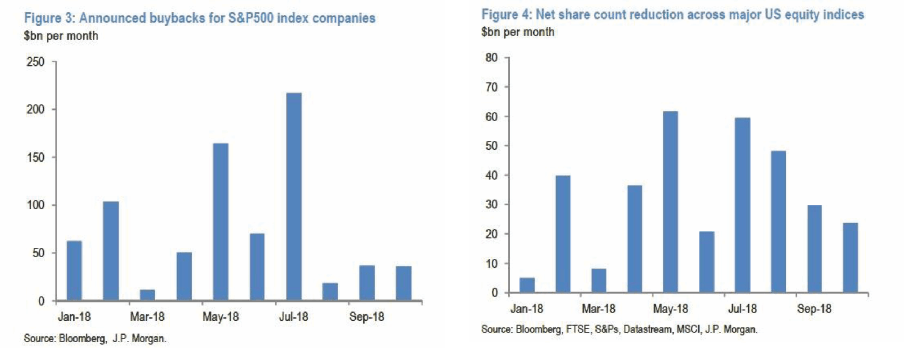
Of course, as I have stated repeatedly over the last year, there is little incentive for companies to raise operating costs (wages, CapEx, etc) which erodes “earnings per share.” Therefore, the best “use of funds” has been share buybacks. As shown in the chart below, the surge in announced share buybacks surged after Q1 as dollars were repatriated which led to a subsequent surge in share count reductions.
This buyback activity has been a major source of support for the bull market through the first half of this year and, as we will discuss in a moment, was also the primary contributor to EPS boosts along with the lowered corporate tax rate.
“Because, as many strategists have noted over the past year, with JPMorgan’s Nikolaos Panigirtzoglou doing so most recently in his latest Flows and Liquidity report over the weekend, US repatriation flow are a key leading indicator for US stock buybacks.
And the problem for stock market bulls, is that recent data are consistent with this idea that offshore cash repatriation is slowing considerably and by implication, so are buybacks.”
As I have repeatedly argued:
“Going forward the ability to increase margins will become more difficult as higher labor costs, rising energy prices, higher interest costs, tariffs, and a stronger dollar weigh on bottom line profitability. More importantly, the dramatic surge in earnings growth in the first two quarters will dissipate quickly as year-over-year comparisons become more problematic.”
As expected, the buyback activity is slowing as rising interest rates, and the one-time benefit of repatriation, reduces the “profitability” of expending capital on share repurchases.
Earnings
Another tailwind quickly turning lower is reported earnings per share. As I discussed in our analysis of earnings for the second quarter:
“The risk to current estimates going forward remain higher rates, tighter monetary accommodation, and trade wars. As I wrote recently, the estimated reported earnings for the S&P 500 have already started to be revised lower (so we can play the “beat the estimate game”) but an ongoing trade war could effectively wipe out the entire benefit of the tax cut bill. For the end of 2019, forward reported estimates have declined by roughly $9.00 per share.”
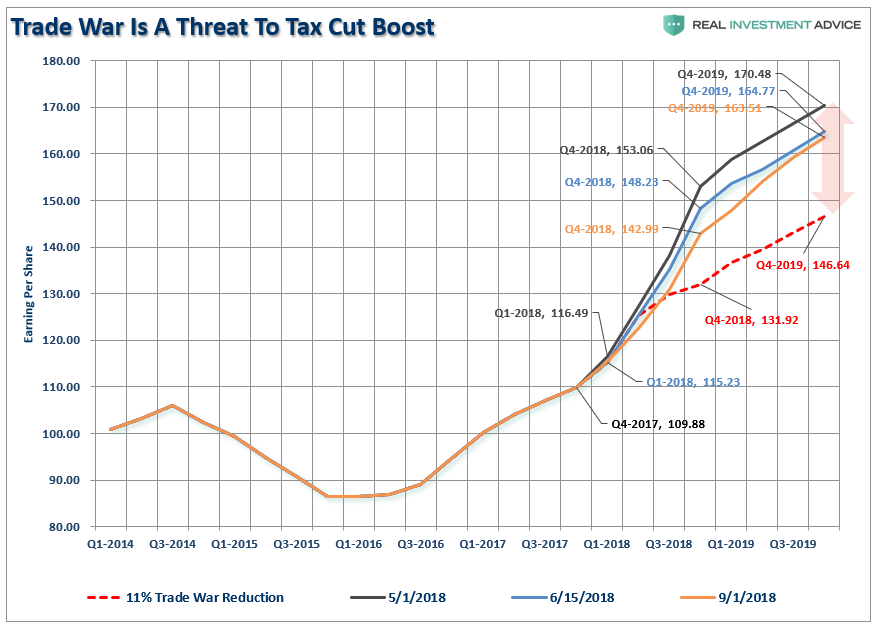
Just since that writing, the estimates have deteriorated further as the ongoing “trade war” has now begun to drag future estimates lower. In just 2-months, the estimates for the end of 2019 have fallen by almost $4 per share.
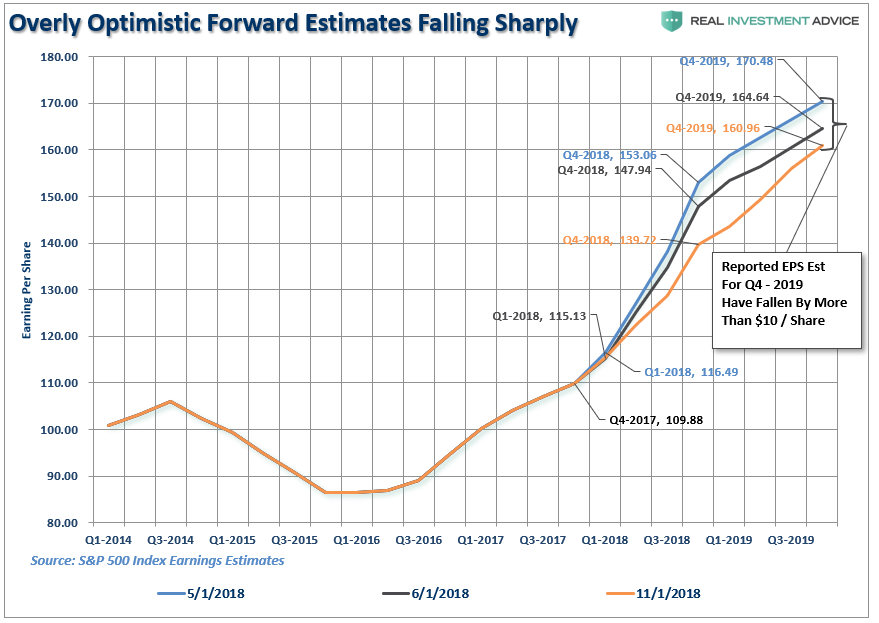
But looking forward, year over year comparisons are going to become markedly more troublesome even as expectations for the S&P 500 index continues to rise.
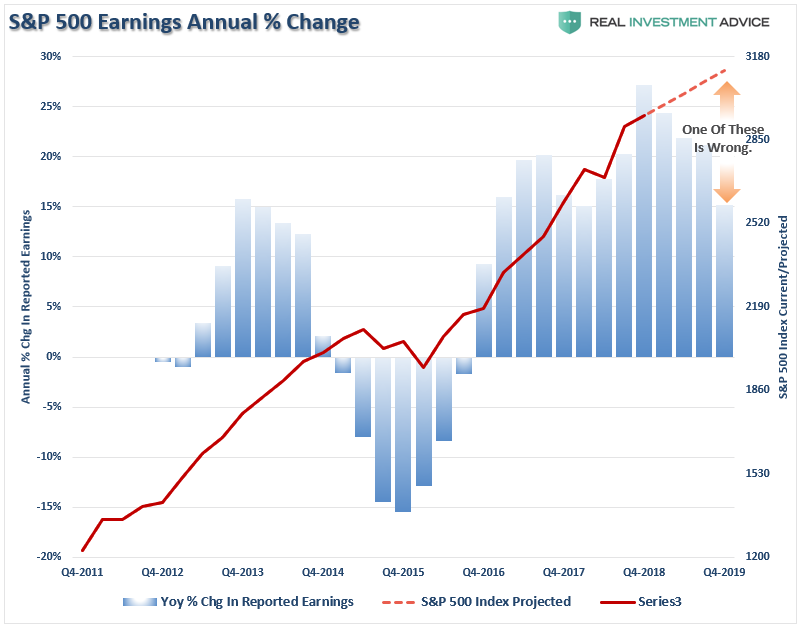
As I stated previously, the deterioration in earnings is something worth watching closely. While earnings “beat lowered estimates,” it is important to keep earnings trends in perspective. The deterioration in earnings in due to the late stage of the economic cycle, tariffs, a stronger dollar, and rising labor costs is notable and should not be readily dismissed.
It is important to remember the bump in earnings growth will only last for one year at which point the analysis will return to more normalized year-over-year comparisons. While anything is certainly possible, the risk of disappointment is extremely high.
Fed Balance Sheet
Another big tailwind for the market over the last decade, of course, has been the ongoing “emergency measures” by the Federal Reserve, as well as Global Central Banks, of liquidity infusions supported by artificially suppressed interest rates. As shown in the chart below, the Federal Reserve has previously provided the underlying “Fed Put”which has repeatedly encouraged investors to take on increasing levels of equity risk.
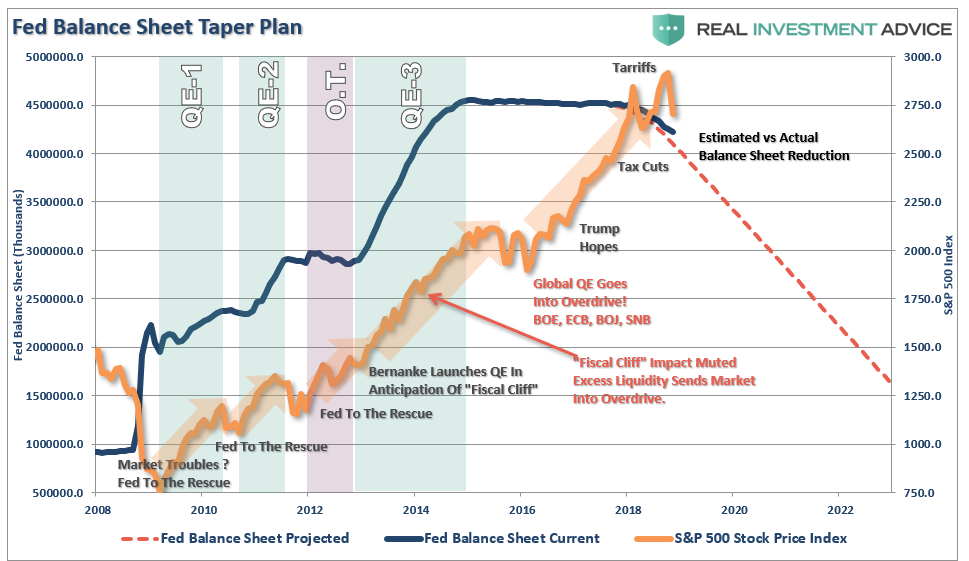
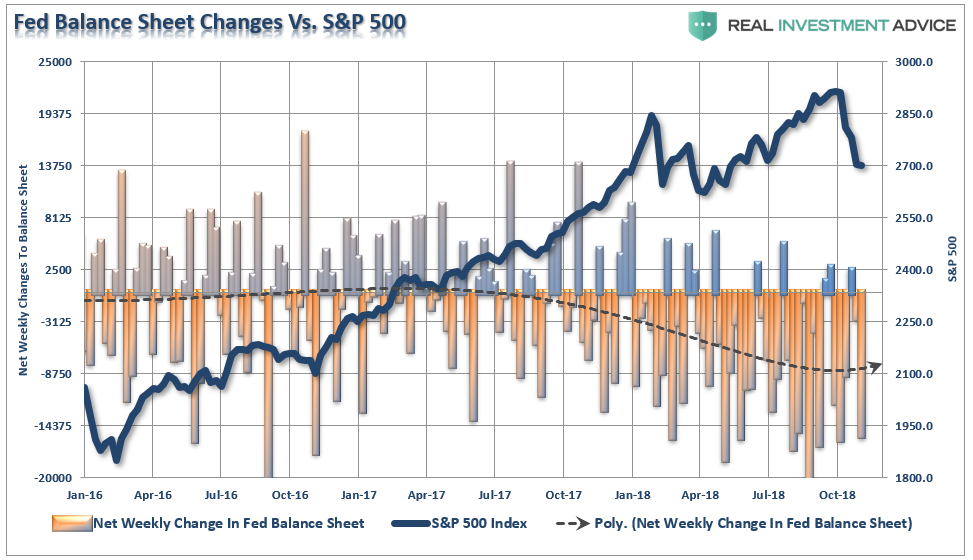
However, with the Fed now on a rate hiking campaign, while simultaneously reducing their balance sheet, the previous level of liquidity support is being reversed. As shown in the chart below of weekly changes, the reduction in the balance sheet has increased the volatility of the market as the support for equities has been reduced.
While it is currently believed that Central Bankers now have everything “under control,” the reality is they likely don’t. It is far more likely one of following two conclusions is more accurate.
- The Fed is absolutely aware the economy is closer to the next recession than not. They also know that hiking interest rates in the current environment will likely accelerate the next downturn. However, the “lesser of two evils” is to face the recession with the Fed funds rate as far from zero as possible, or;
- The Fed believes the economic data is indeed trending stronger and are overly confident in their ability to guide the U.S. economy into a “Goldilocks” type scenario where they can control inflationary pressures and growth rates to sustain a lasting economic cycle.
With the Fed continuing to tighten monetary policy, the screws are being twisted further on both households and speculative-grade corporate debt. It appears the markets have already begun to anticipate more defaults and are repricing risk accordingly.
Government Spending
Lastly, government spending has been very supportive to the markets in particular over the last few quarters as economic growth has picked up. However, that “sugar-high” was created by 3-massive Hurricanes in 2017 which has required billions in monetary stimulus which created jobs in manufacturing and construction and led to a temporary economic lift. We saw the same following the Hurricanes in 2012 as well.
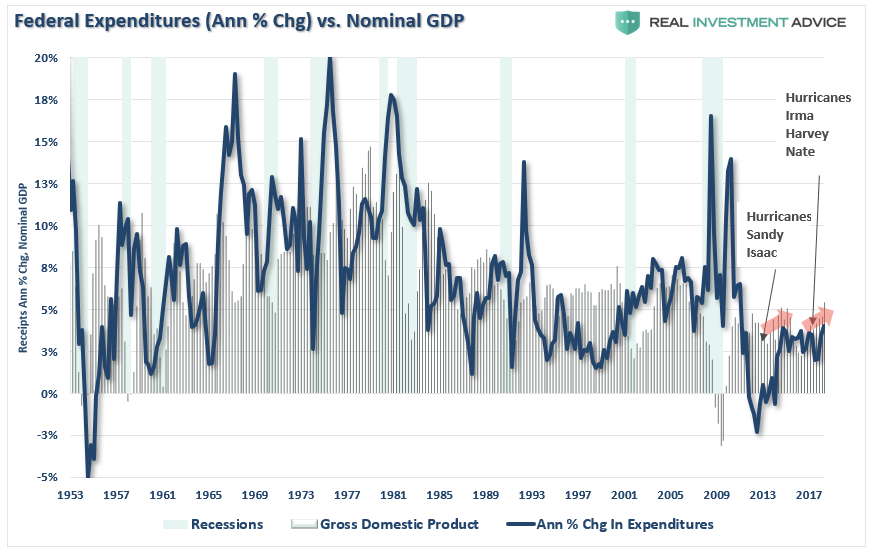
These “sugar highs” are temporary in nature. The problem is the massive surge in unbridled deficit spending only provides a temporary illusion of economic growth. Over the long-term, debt leads to economic suppression. Currently, the deficit is rapidly approaching $1 Trillion, and will exceed that level in 2019, which will require further increases in the national debt.
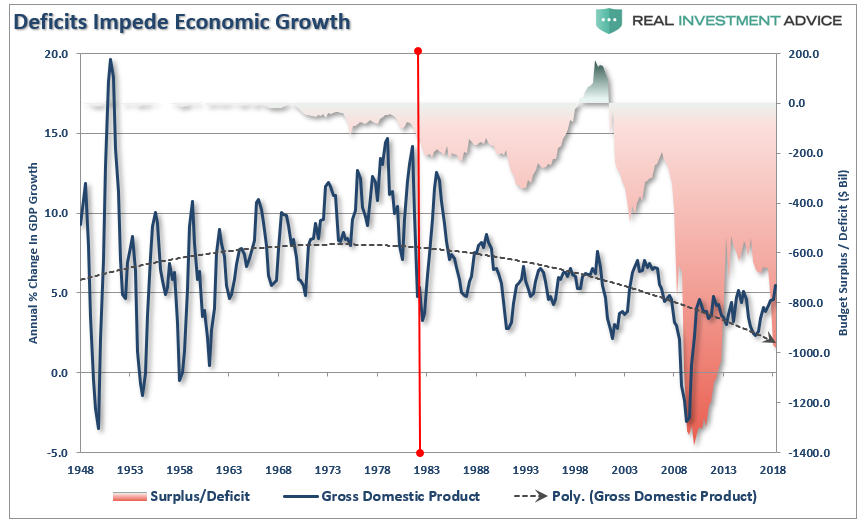
There is a limited ability to issue debt to pay for excess spending. The problem with running a $1 Trillion deficit during an economic expansion is that it reduces the effectiveness of that tool during the next recession.
Conclusion
The tailwinds that existed for the market over the last couple of years from tax cuts, to natural disasters, to support from Central Banks have now all run their course.
The backdrop of the market currently is vastly different than it was during the “taper tantrum” in 2015-2016, or during the corrections following the end of QE1 and QE2. In those previous cases, the Federal Reserve was directly injecting liquidity and managing expectations of long-term accommodative support. Valuations had been through a fairly significant reversion, and expectations had been extinguished.
None of that support exists currently.
There is a reasonably high possibility, the bull market that started in 2009 has ended. However, we will likely not know for certain until we get into 2019, but therein lies the biggest problem. Waiting for verification requires a greater destruction of capital than we are willing to endure.
We have already taken steps to reduce equity risk and will do more on rallies that fail to re-establish the previous bullish trends in the market. If I am right, the more conservative stance will protect capital in the short-term. The reduced volatility allows for a logical approach to further adjustments as the correction becomes more apparent. (The goal is not to be forced into a “panic selling” situation.)
If I am wrong, and the bull market resumes, we simply remove hedges and reallocate equity exposure. As I stated previously:
“There is little risk, in managing risk.”


Lance Roberts is a Chief Portfolio Strategist/Economist for Clarity Financial. He is also the host of “The Lance Roberts Podcast” and Chief Editor of the “Real Investment Advice” website and author of “Real Investment Daily” blog and “Real Investment Report“. Follow Lance on Facebook, Twitter, Linked-In and YouTube


