Was 2018 good or bad for the previous metals market? We invite you to
read our today’s article and learn more about the most important drivers
of the gold prices in 2018. This analysis should help investors better
understand the gold market, and draw investment conclusions for the new
year.
“Hence, we are neutral to slightly bearish for the gold market in
2018.” – this is what we wrote in the December 2017 edition of the Market Overview. Fast forward one year (oh my God – when has it passed?) and it turned out that we were right.
Just
look at the chart below. It paints the gold prices over the last year.
The yellow metal entered 2018 with a quote of $1312.05, while ended the
year at $1268 (as of December 27). So, gold dropped 3.4 percent last
year, which was exactly in line with our expectations.
Chart 1: Gold prices (London P.M Fix, in $) from December 2017 to December 2018.

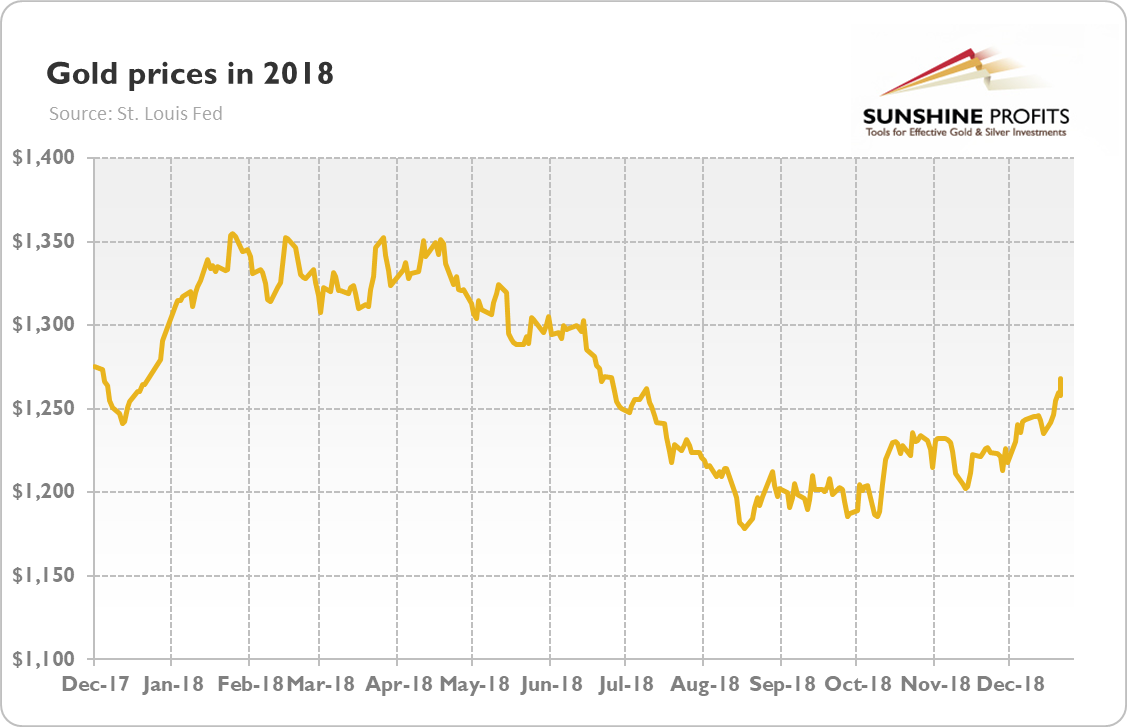
Please note that bullion jumped in the aftermath of the December 2017 FOMC
meeting. If we compare today’s gold prices to the pre-meeting level
(around $1,260) or just to the average of 2017 ($1257.12), it will be
even more clear that our “neutral to slightly bearish” call was accurate.
Is
the 3-percent drop a big or a small change? Well, it depends on your
perspective. If one assumes that gold prices can only rise, they might
be disappointed. If one dwells on price around $1.900 and waits for a
triumphant comeback, they also might be frustrated. But gold performed
poorly not only compared to the glorious 2011, but also to 2017, when it
gained more than 10 percent, as one can see in the chart below.
Chart 2: Gold prices (London P.M. Fix, in $) from 2013 to 2018.
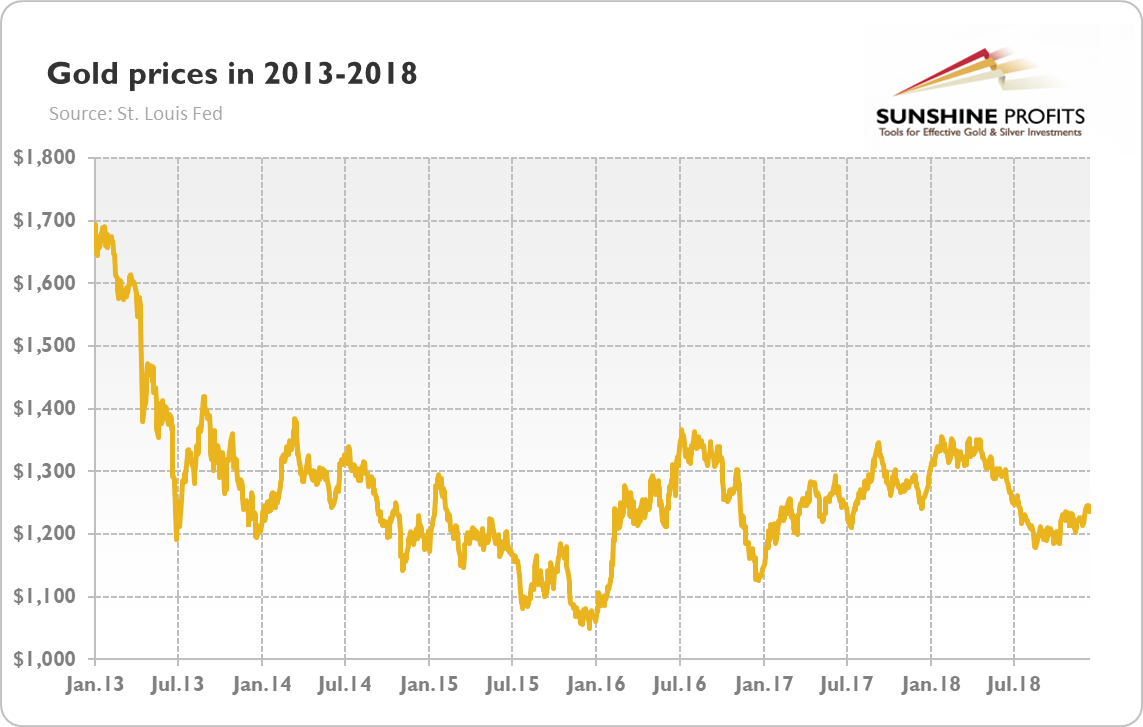
On
the other hand, the chart above shows that the drop of 3 percent is
actually not unusual for the period starting in 2013. Investors should
remember that 2018 was fundamentally very challenging for the precious metals. The Fed tightened its monetary policy further, hiking interest rates four times. The US economy accelerated, while inflation remained subdued.
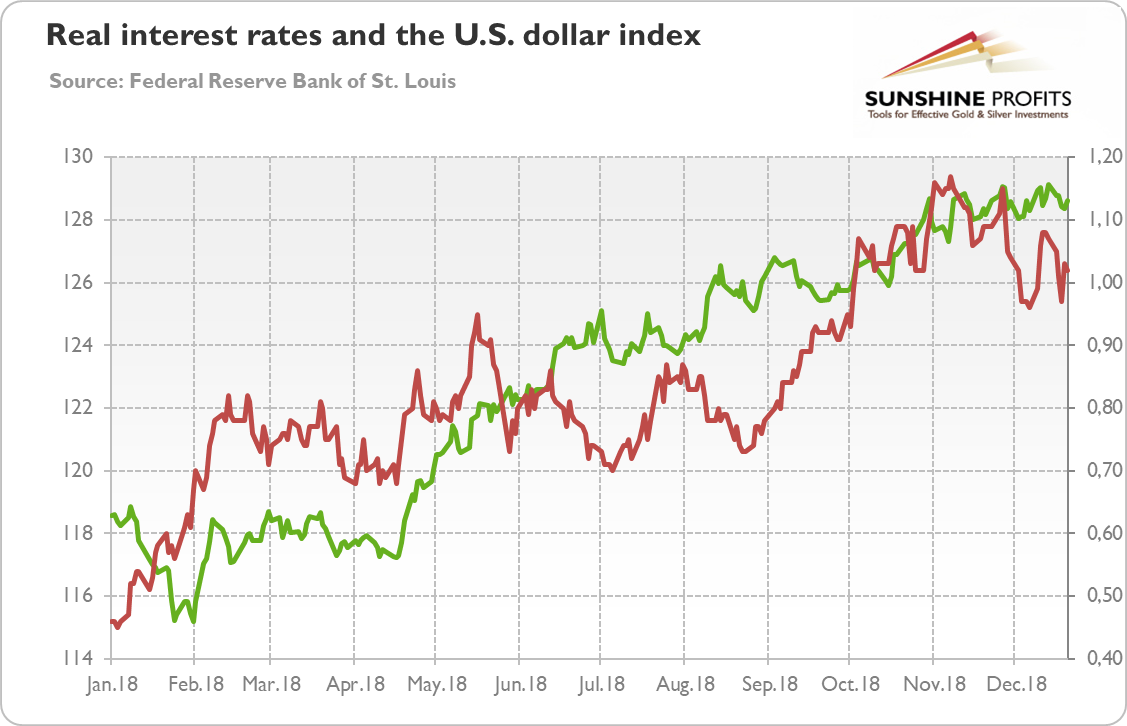
Please take a look at the chart below. It shows the performance of the greenback and the US real interest rates – two of the most important drivers of the gold prices.
As one can see, the dollar index, which measures the strength of the
American currency against its peers, rose from 120 to 128, or 6.66
percent, while the yields on inflation-indexed 10-year Treasuries
climbed from 0.5 to above 1.0 percent (so they more than doubled).
Chart
3: The U.S. real interest rates (red line, right axis, yields on
10-year Treasury Inflation-Indexed Security) and the U.S. dollar index
(green line, left axis, Trade Weighted Broad U.S. Dollar Index) in 2018.
The Fed’s tightening cycle increased the divergence in monetary policies
between the US and other countries. The dollar-denominated assets
became more attractive, so investors shifted their funds into America,
making the greenback strong again – and exerting downward pressure on the gold prices.
That process was supported by the negative impact of higher interest rates on the emerging markets
and the healthy economic expansion in the US – thus, investors had
additional motivation to re-allocate their fund into dollar-denominated
assets. Hence, gold’s performance in 2018 was actually reasonable given the unfavorable macroeconomic environment.
And what about 2019 – will gold finally break out the chains of its sideways trend? Unlike other analysts, we will be honest with you – we don’t know, as we don’t have a crystal ball. But we know that the macroeconomic factors should be more favorable towards precious metals.
The US policy mix is likely to change. The accommodative effects of the fiscal policy
should dissipate, while the contractionary effects of the monetary
policy could finally reach the economy. The higher interest rates
tightened financial conditions and widened the credit spreads, as one can see in the chart below.
Chart
4: The CBOE Volatily Index (green line, right axis) and BofA Merrill
Lynch US Corporate BBB Option-Adjusted Spread (red line, left axis) in
2018.
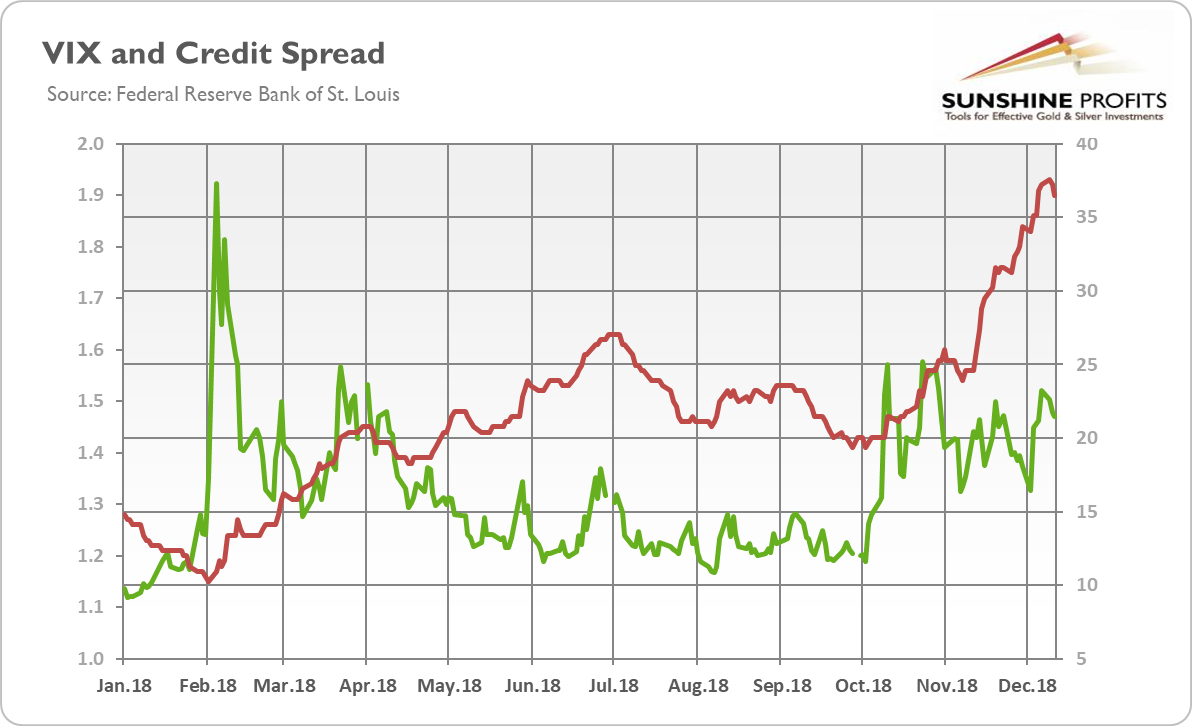
The
widened credit spreads (as well as increased volatility) imply weaker
economic confidence, which should support the gold market. Indeed,
investors entered 2018 with very optimistic views about the synchronous
and accelerating global growth, but the current moods are much more
pessimistic. Rising fears make investors more risk-averse and more prone to buy safe-haven assets, such as gold.
Another
reason is that no matter whether we will see three or fewer Fed hikes
in 2019, the pace of tightening will be slower than last year.
Forward-looking investors could sense the end of monetary policy
normalization, selling the US dollar and buying gold today. All these factors make us to believe that 2019 fundamental outlook for the gold market is better than one year ago.
If you enjoyed the above analysis and would you like to know more
about the macroeconomic outlook and the gold market, we invite you to
read the January Market Overview
report. If you’re interested in the detailed price analysis and price
projections with targets, we invite you to sign up for our Gold & Silver trading Alerts.
If you’re not ready to subscribe yet and are not on our gold mailing
list yet, we urge you to sign up. It’s free and if you don’t like it,
you can easily unsubscribe. Sign up today!
Thank you.
Arkadiusz Sieron, Ph.D.
Sunshine Profits‘ Gold News Monitor and Market Overview Editor
Gold News Monitor
Gold trading Alerts
Gold Market Overview


