The precious metals sector moved higher in the first days of this year, but based on yesterday’s decline and the current price levels, 2018 is already a down year for silver and mining stocks. Gold is almost flat. This is a subtle clue that the rally may have already ran its course. The confirmation comes from what happened yesterday. Miners continued their decline, invalidating the previous breakout, while gold finally joined the rest of the sector and started its own decline as well. Is the rally indeed over?
Most likely – yes. Let’s start today’s analysis with a look at gold’s performance (charts courtesy of http://stockcharts.com).

We previously commented on the above chart in the following way:
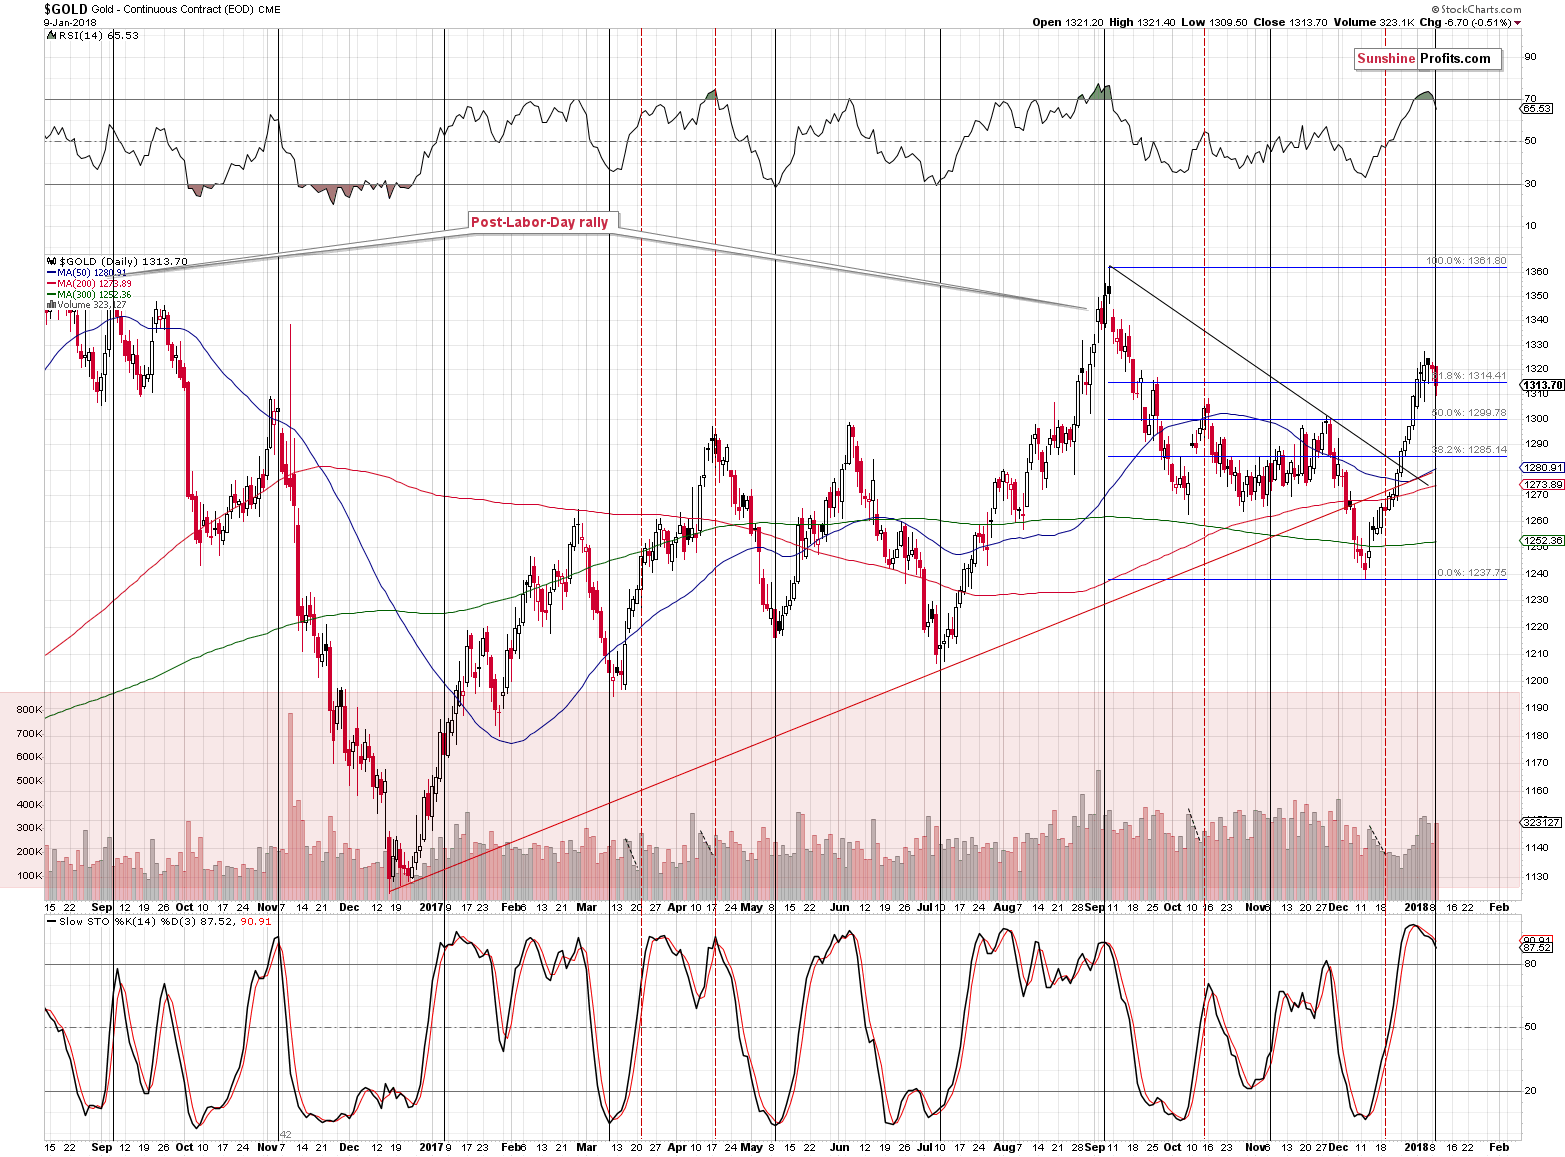
On the above chart, we see that gold is almost at its short-term turning point. This has bearish implications as the preceding move has definitely been up. Both useful indicators: RSI and Stochastic, point to lower gold prices in the upcoming weeks.
Let’s take a look at the RSI’s performance in greater detail. It had been trading above 70 for over a week, even moving temporarily to about 80, but then it moved visibly down. There were only two similar cases in the recent past: the April 2017 top and the September 2017 top. If the following action is going to be similar to the April slide, we can expect gold to move below $1,250. If the following action is going to be similar to the slide following the September top, we can expect gold to move to about $1,210. Either way, the implications are bearish.
The increase in volume during yesterday’s downswing also has bearish implications.
Today’s comeback to $1,325 or so doesn’t invalidate the above. Both: April and June tops in 2017 were followed by a quick rally that didn’t change the overall trend. Consequently, today’s pre-market strength is not an anomaly – it can be viewed as something normal.
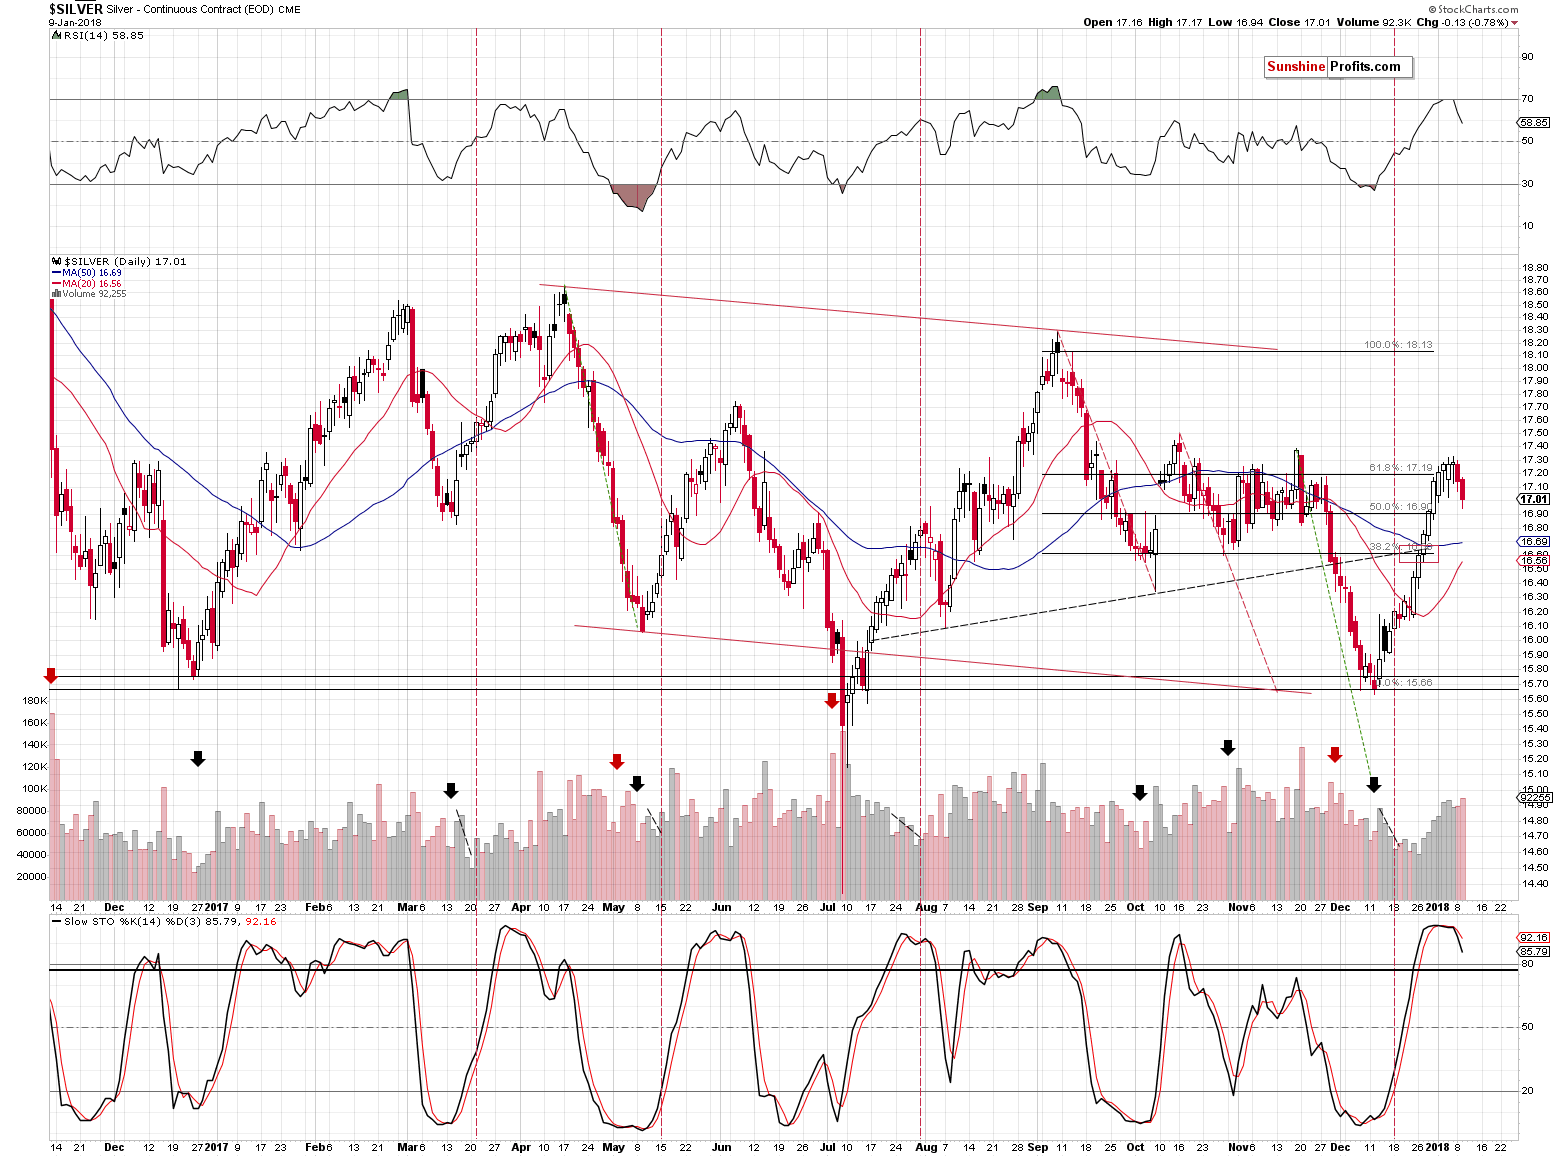
In yesterday’s alert, we wrote that silver had already erased the preceding 2018 gains and based on yesterday’s session we can add that we’re now witnessing the 2018 decline. Overall, silver is 13 cents lower so far this year. Not much, but it seems significant given that moving into a new year also meant moving into a new trend.
Of course, it’s not yet clear that a new trend has indeed emerged, but two daily declines after a series of daily upswings is something that shouldn’t be ignored.
Today’s comeback to $17.15 or so doesn’t invalidate the above – this year’s move lower is confirmed in terms of the closing prices, while today’s pre-market upswing doesn’t carry as much weight.
The Stochastic and RSI indicators continue to support lower silver prices in the coming days and weeks.
Please note that the volume increased during yesterday’s decline, further increasing the odds of a continuation of the decline.
The same goes for silver’s turning point – it was followed by only a relatively small decline, so it doesn’t seem that it’s already over.
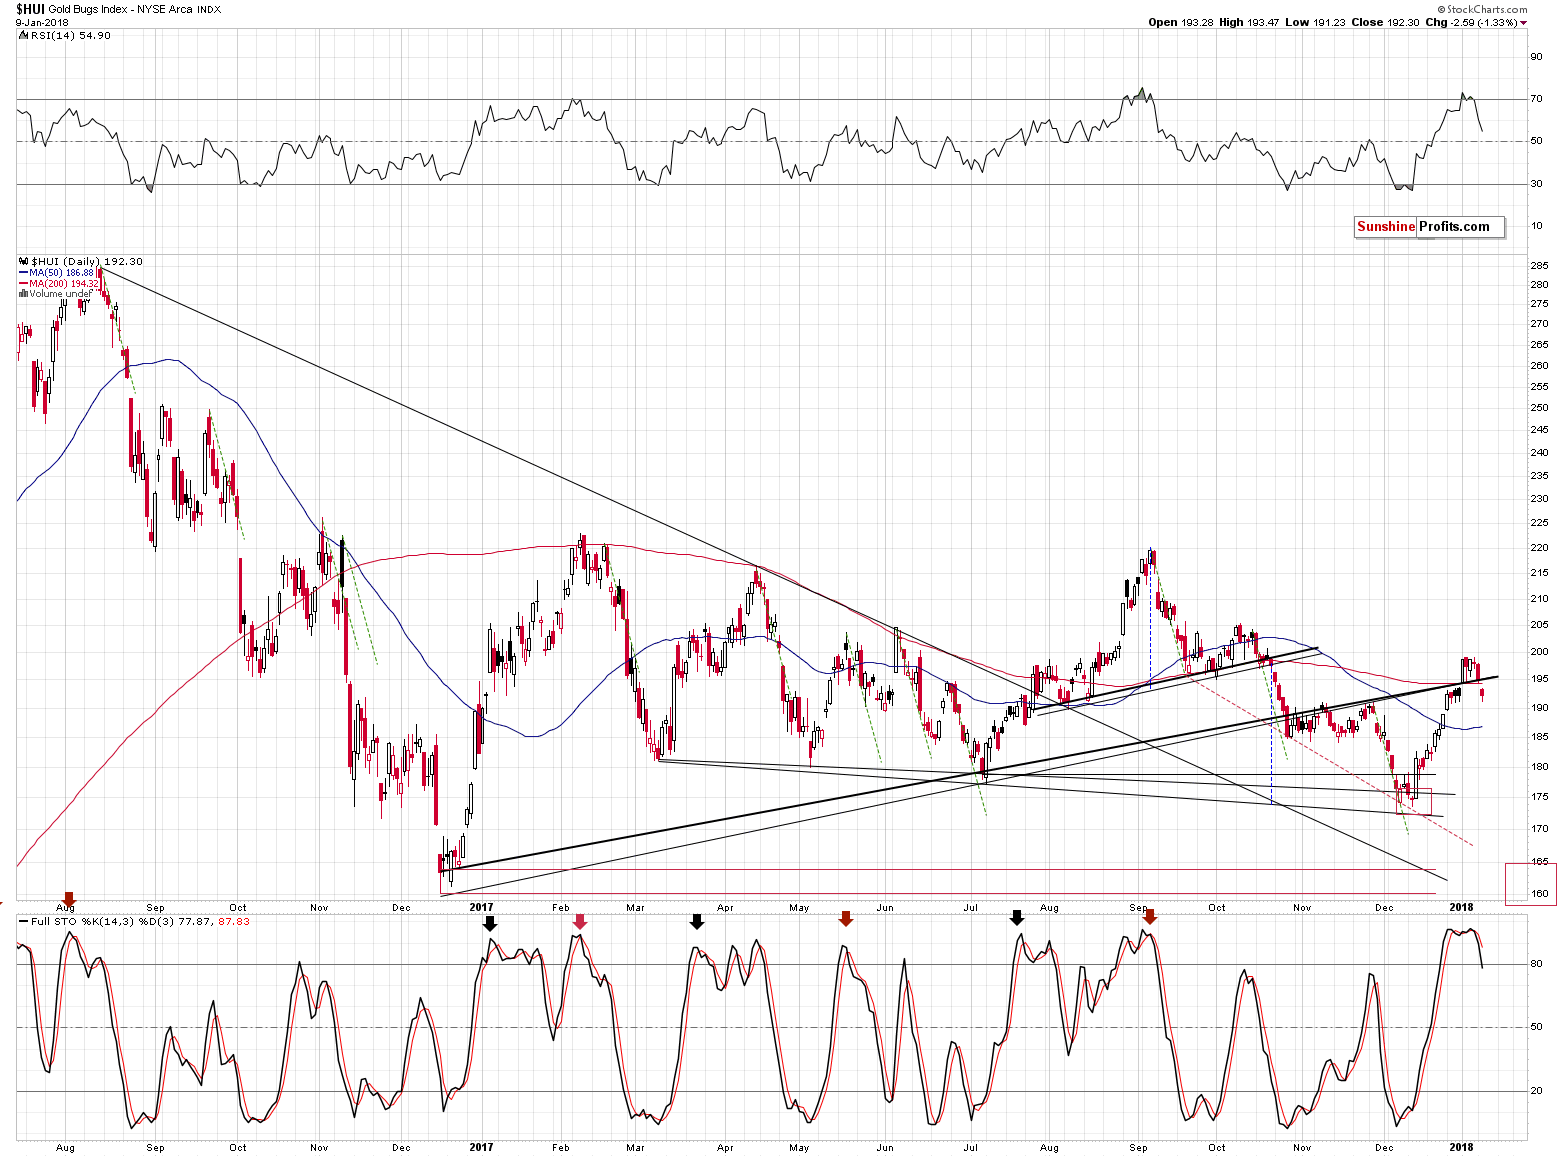
What seems to be over, however, is the rally in the HUI Index. In the first alert of this year, we warned that the breakout in the HUI Index shouldn’t be trusted and we didn’t have to wait long for the market to agree with us.
The invalidations of breakouts are very bearish phenomena and we’ve just seen one. This, plus the sell signal from the RSI and plus the sell signal from Stochastic, make the gold stock picture bearish for the short term.
The similarity to the September top in terms of the RSI further adds to bearish outlook’s credibility and we can say the same about the increase in GDX’s volume.
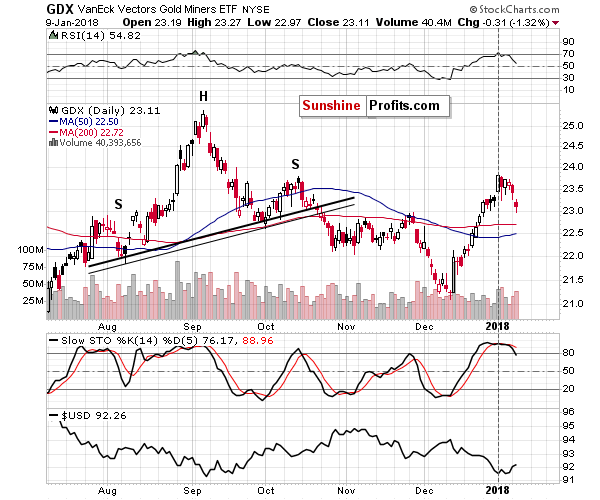
The volume was visibly higher than the preceding ones, which confirms that the true direction in which the market wants to go is down. Interestingly, the volume readings that we saw this year were higher during daily downswings than during daily upswings. The only exception is the January 5 session, but that’s when the GDX declined by only 5 cents, so it was basically a flat session.
Before summarizing, we would like to give you a quick update on the situation in the Euro Index. It’s important for the precious metals investors and traders as the euro tends to move in the same direction as the PMs.
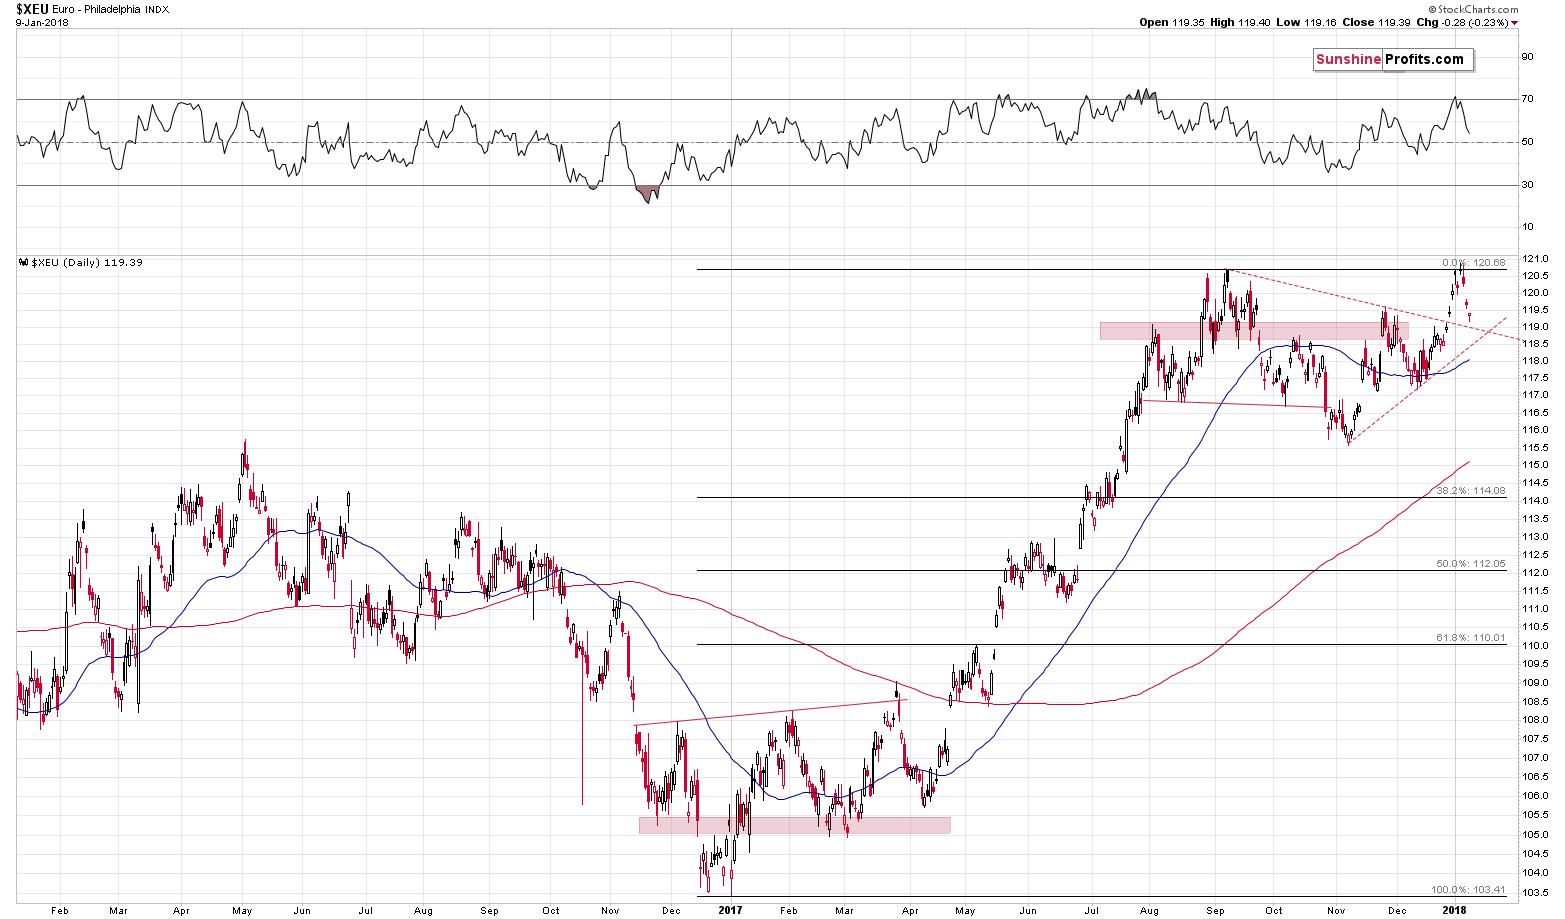
On January 3rd, we wrote the following about the above chart:
The double top in the Euro Index is also something that could trigger a reversal in the price of the yellow metal. After all, a yearly high is a very important resistance, especially if reaching it is combined with RSI’s move to the 70 level. Please note that the latter indicator was useful not only in case of the precious metals, but also in case of the Euro Index.
The yellow metal declined shortly thereafter and the question is if there are any more declines on the horizon. Most likely yes.
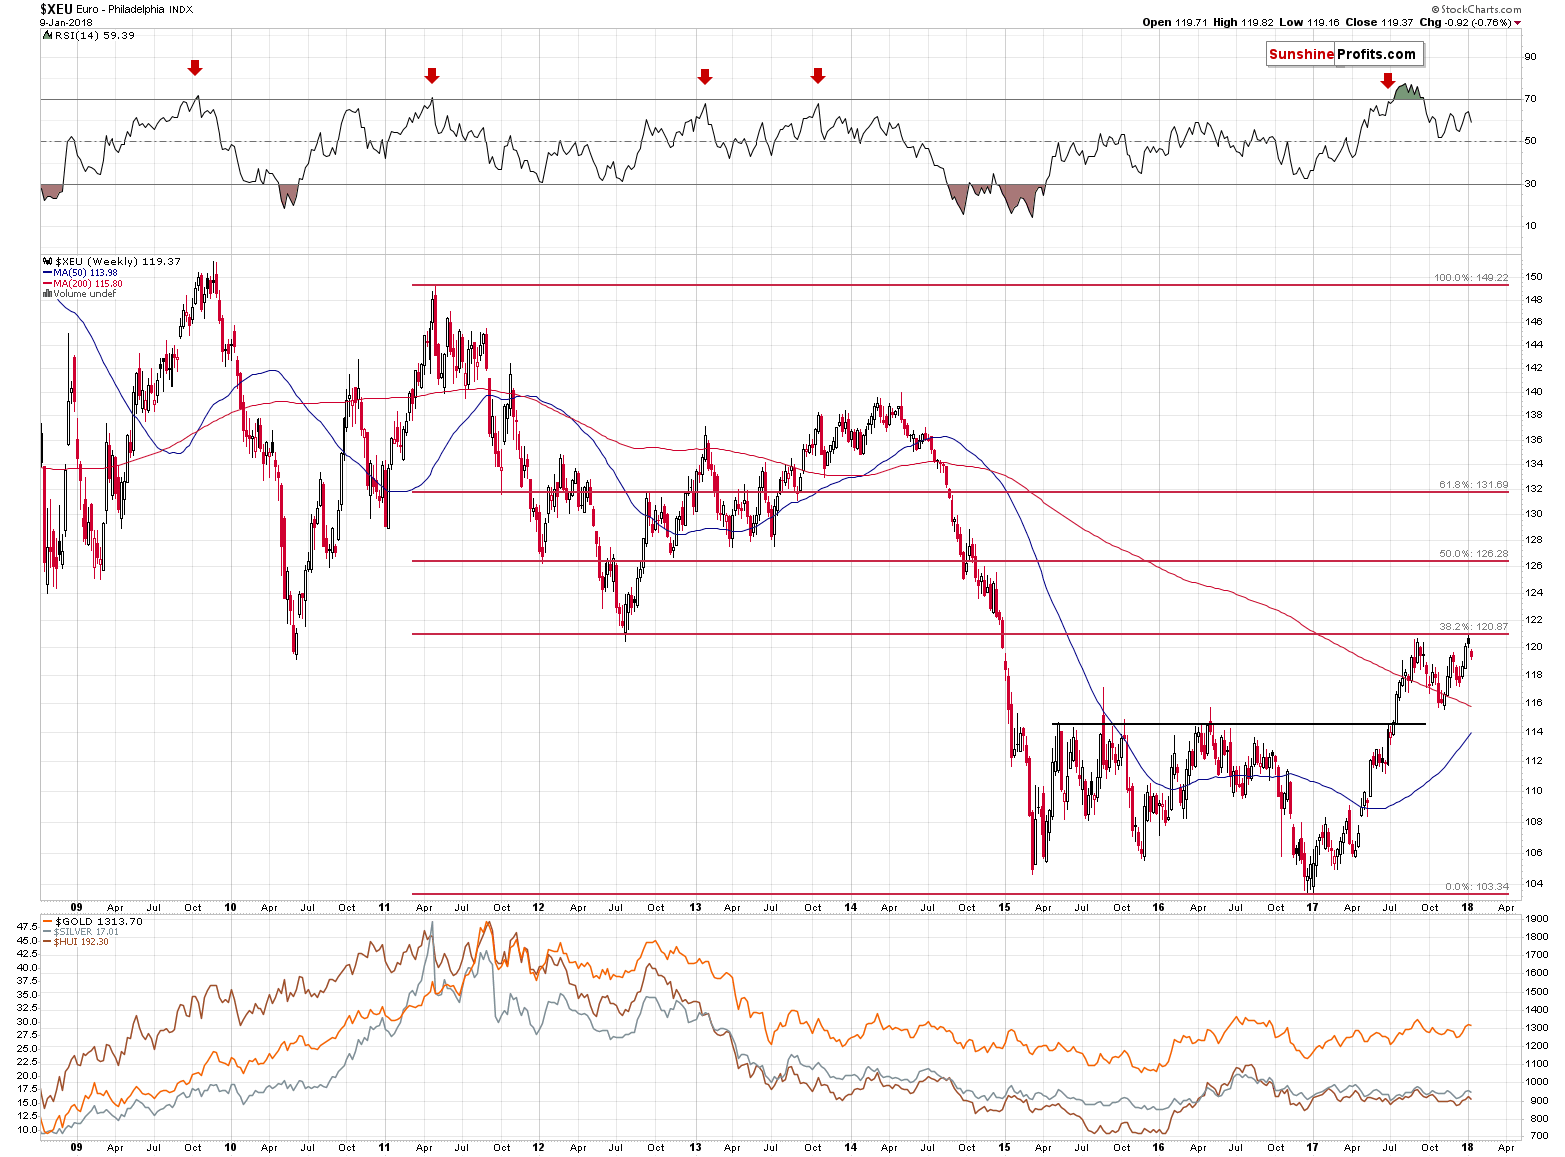
Quoting our Monday’s analysis:
(…) in terms of the weekly price performance we saw a specific kind of reversal. The Euro Index had opened the week higher than the previous close and higher than it closed the week. This specific situation is marked with black candlesticks. Interestingly, we saw only one similar situation in the past years. By “similar”, we mean the above kind of candlestick that takes place after a visible rally. The similar week started on September 26th, 2016. That was the week that was followed by substantial declines in the EUR/USD and in the precious metals sector. In fact, higher prices of silver and mining stocks were never seen (gold moved a bit higher in September 2017, but the move was only temporary). The implications for PMs are bearish for the following weeks.
The above remains up-to-date and the outlook remains bearish not only for the upcoming days, but also for the upcoming weeks.
Summing up, PMs moved higher during today’s pre-market trading, but it was not enough to invalidate the bearish outlook for the following weeks. The mining stocks’ underperformance of gold, along with the fact that the GDX topped during the first session of the year, suggest that the decline is already underway.
Naturally, the above is up-to-date at the moment of publishing it and the situation may – and is likely to – change in the future. If you’d like to receive follow-ups to the above analysis (including the intraday ones, when things get hot), we invite you to subscribe to our Gold & Silver Trading Alerts.
Thank you.
Sincerely,
Przemyslaw Radomski, CFA
Founder, Editor-in-chief, Gold & Silver Fund Manager
Gold & Silver Trading Alerts
Forex Trading Alerts
Oil Investment Updates
Oil Trading Alerts


