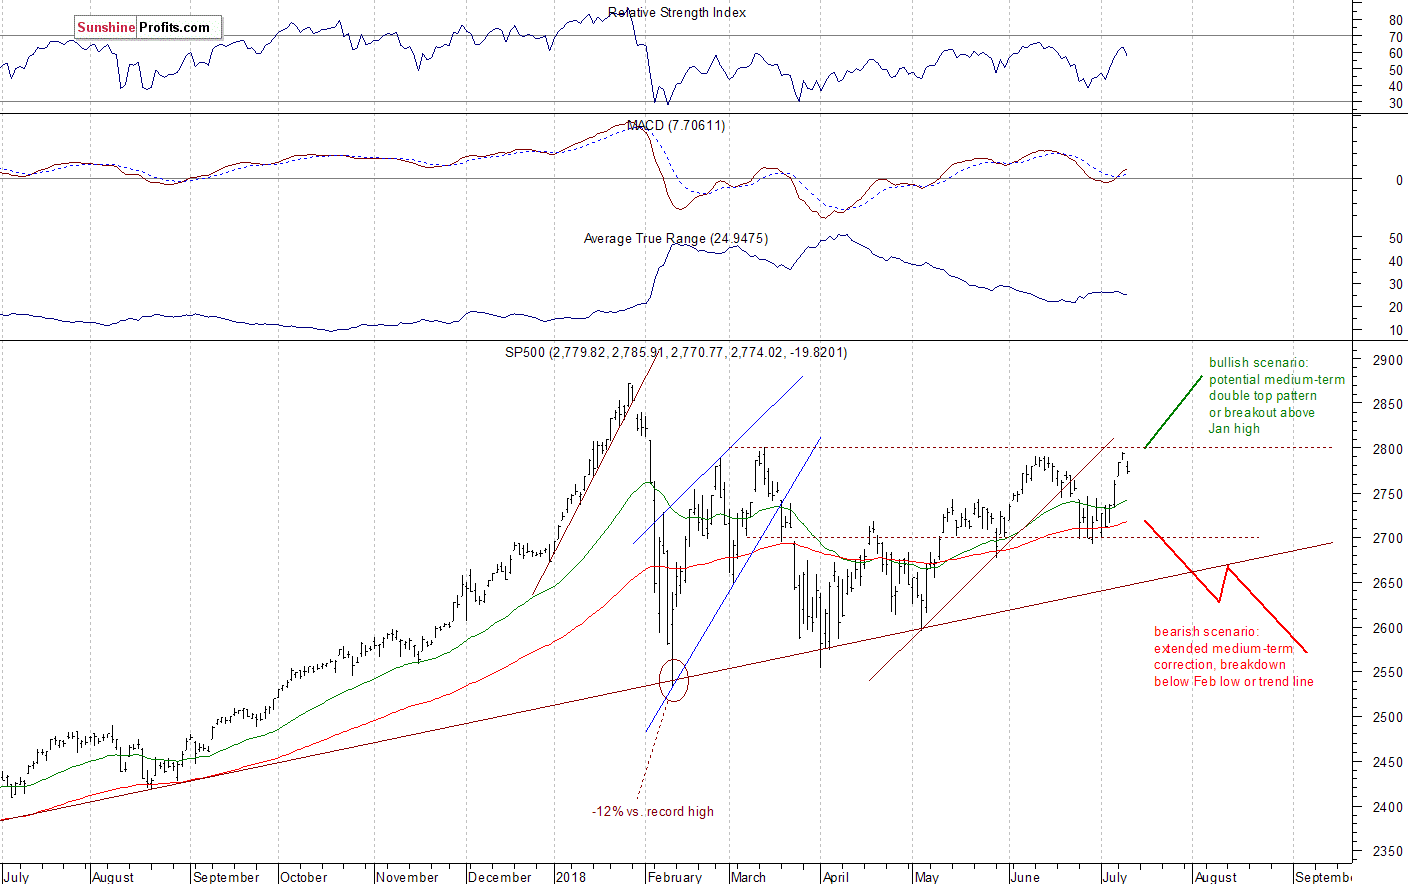
The U.S. stock market indexes lost between 0.6% and 0.9% on Wednesday, retracing some of their recent advance, as investors reacted to new trade tariffs announcement. The S&P 500 index has bounced off the resistance level of around 2,800. It currently trades 3.4% below the January’s 26th record high of 2,872.87. The Dow Jones Industrial Average lost 0.9% and the technology Nasdaq Composite lost 0.6% on Wednesday.
The nearest important level of support of the S&P 500 index is at around 2,765-2,770, marked by yesterday’s local low and Monday’s daily gap up of 2,764.41-2,768.51. On the other hand, the resistance level is now at around 2,785, marked by yesterday’s daily gap down of 2,785.91-2,786.24. The resistance level is also at 2,795-2,800, marked by the previous local highs from February, March and June. The level of resistance is also at 2,840, marked by January the 30th daily gap down.
The broad stock market broke above its recent trading range on Friday. Is this a new uptrend or just more medium-term fluctuations following January-February sell-off? If the S&P 500 index breaks above 2,800 mark, we could see more buying pressure. Perhaps we could see a move to new record high. However, there are still two possible medium-term scenarios – bearish that will lead us below the February low following trend line breakdown, and the bullish one in a form of medium-term double top pattern or a breakout towards 3,000 mark. There is also a chance that the market will just go sideways for some time, and that would be positive for bulls in the long run (some kind of an extended flat correction). The S&P 500 index broke below its two-month-long upward trend line recently, but it continued to trade above the level of 2,700:

Short-term Fluctuations, Just Correction Before Another Leg Up?
The index futures contracts trade 0.5-0.7% higher vs. their yesterday’s closing prices. So expectations before the opening of today’s trading session are quite positive. The main European stock market indexes have gained 0.6-0.8% so far. Investors will wait for the economic data announcements today: Consumer Price Index, Initial Claims at 8:30 a.m. The broad stock market will probably retrace some of its yesterday’s decline today. For now, it looks like a short-term consolidation following the recent rally.
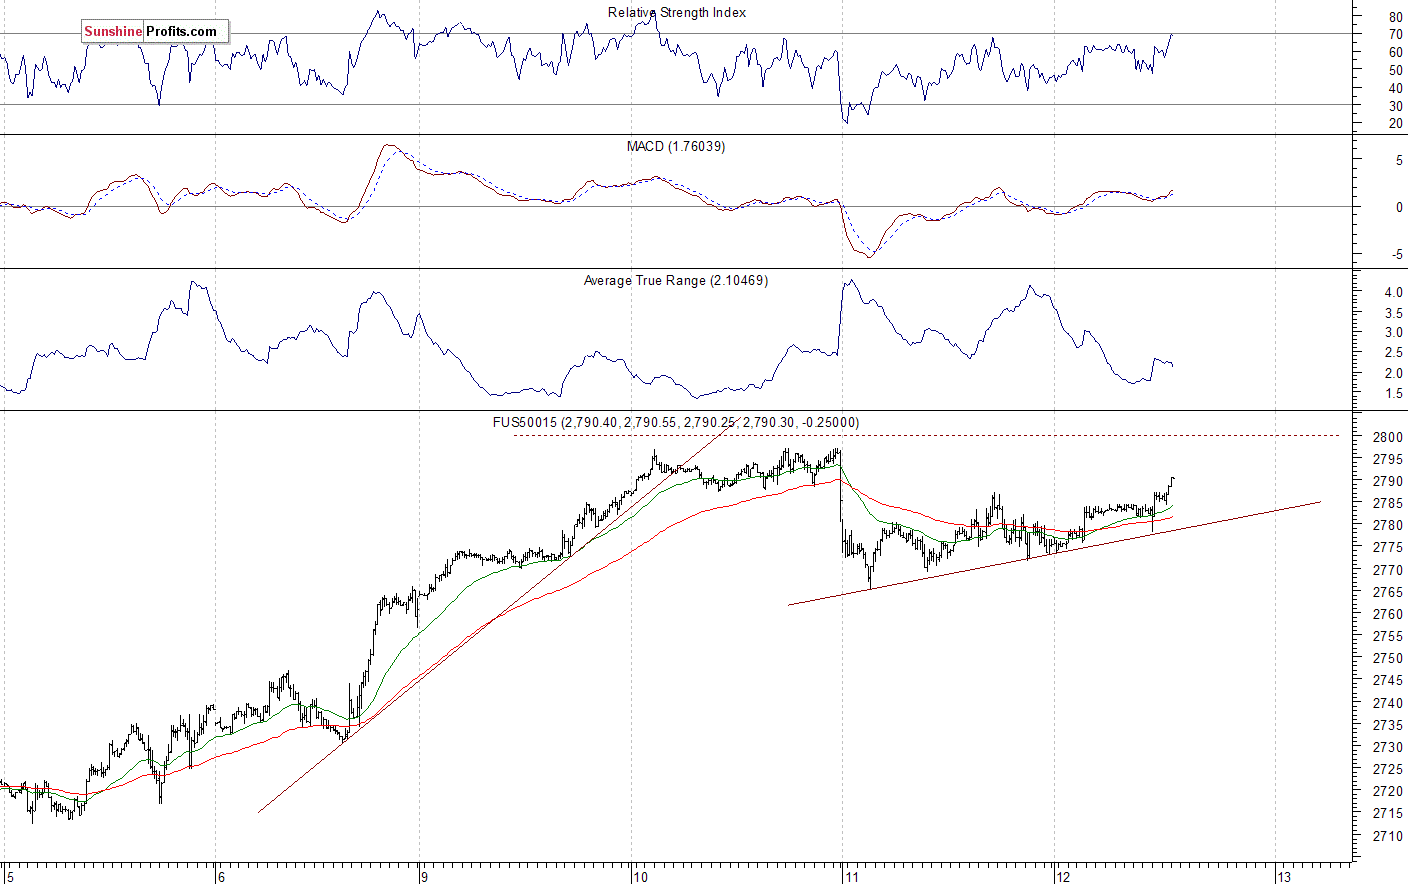
The S&P 500 futures contract trades within an intraday uptrend, as it retraces some of its yesterday’s decline. The nearest important level of resistance is at around 2,785-2,790, marked by the short-term local highs. The resistance level is also at 2,800. On the other hand, level of support is at 2,765-2,770, marked by the recent local lows. The futures contract trades above its two-session-long upward trend line, as we can see on the 15-minute chart:
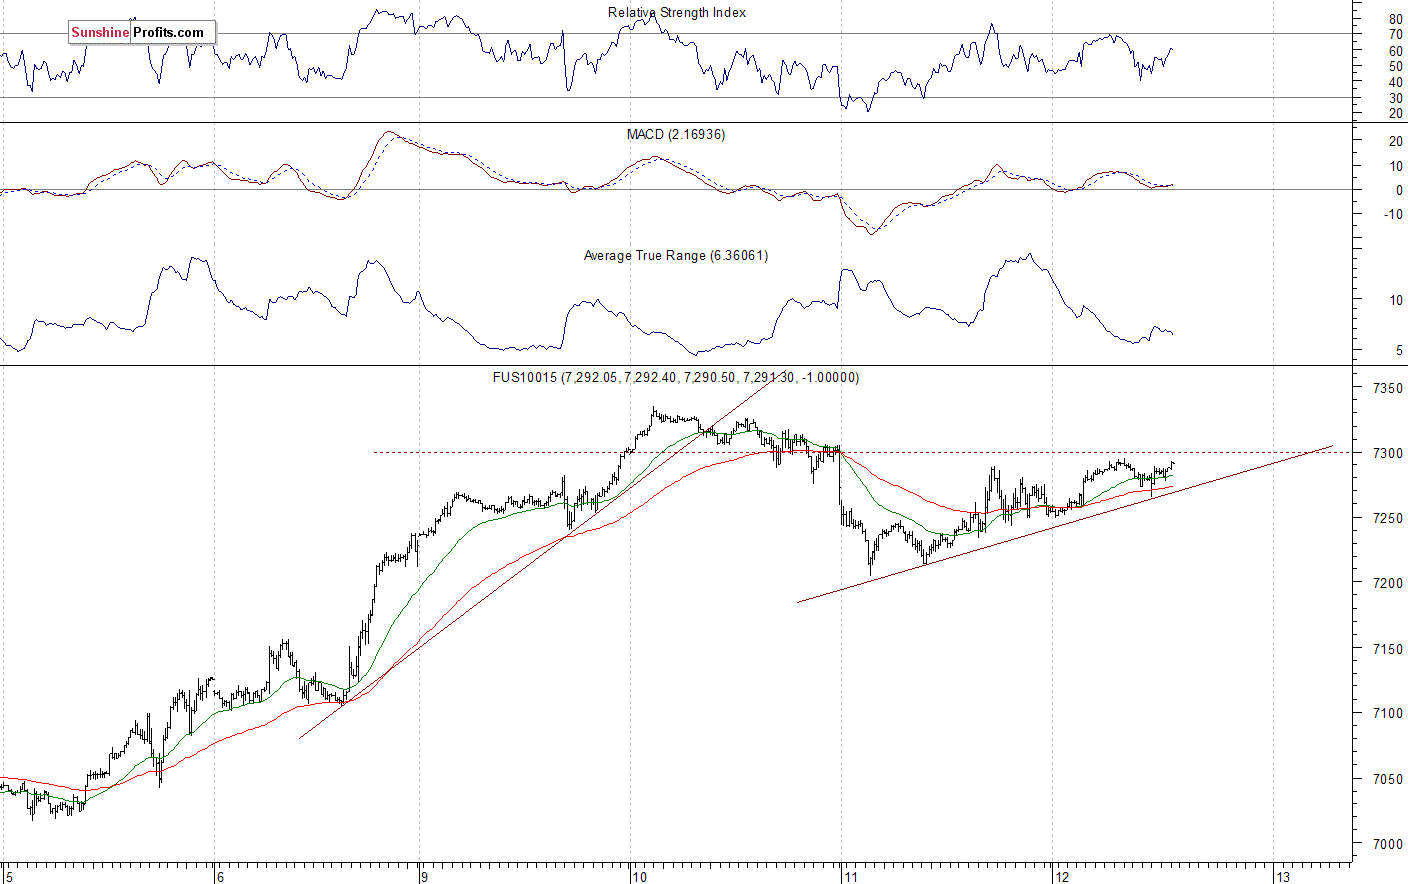
Nasdaq Closer to 7,300 Again
The technology Nasdaq 100 futures contract follows a similar path, as it trades within an intraday uptrend. The market has bounced off the resistance level of around 7,300-7,360, marked by the June’s record high recently. Then it traded closer to 7,200 mark, before bouncing off that support level. The nearest support level is now at around 7,250. The Nasdaq futures contract trades along the level of 7,300 again, as the 15-minute chart shows:
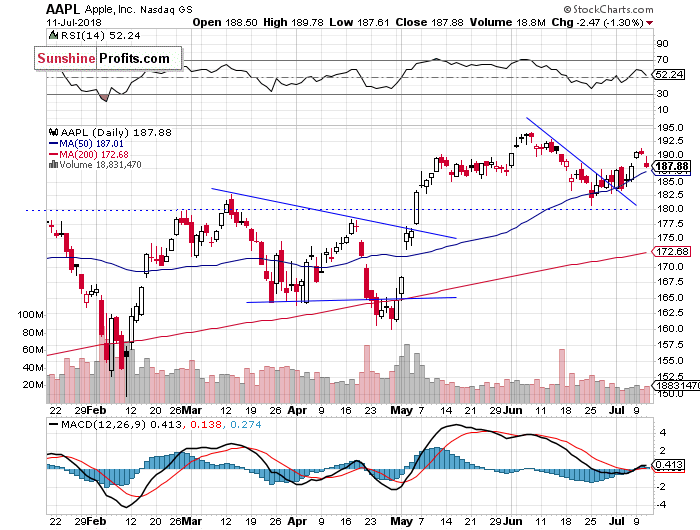
Apple Lower, Amazon Higher – Big Cap Tech Stocks’ Mixed Picture
Let’s take a look at Apple, Inc. stock (AAPL) daily chart (chart courtesy of http://stockcharts.com). The stock slightly extended its Monday’s advance on Tuesday, but it came back lower yesterday. There’s still the resistance level of around $190-195. On the other hand, support level is now at around $185, marked by the previous level of resistance:
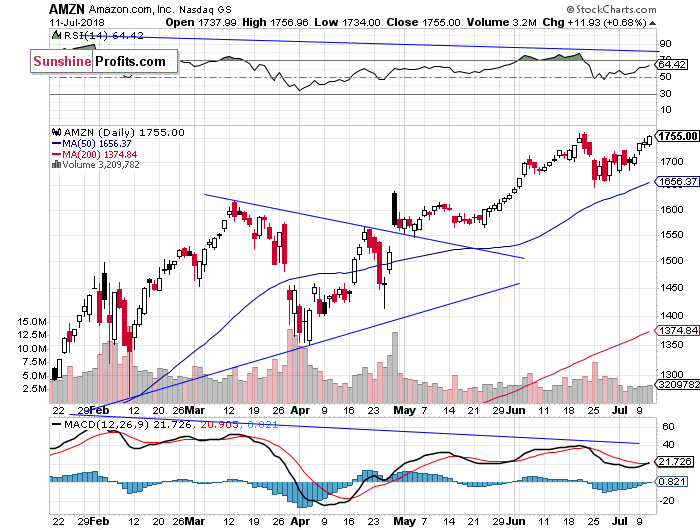
Now let’s take a look at Amazon.com, Inc. stock (AMZN) daily chart. It got even closer to June the 21st record high of $1,763.10 yesterday. And we still can see some medium-term negative technical divergences. Will the market reverse here? There have been no confirmed negative signals so far:
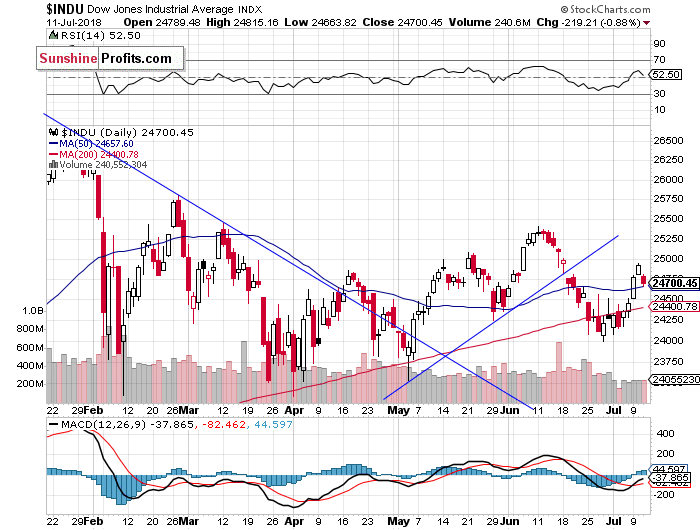
Dow Jones – Uncertainty Below 25,000 Mark
The Dow Jones Industrial Average broke below its two-month-long upward trend line in the late June. Then it continued lower, as it fell below the level of 24,500. The blue-chip index kept bouncing off a potential support level of around 24,000-24,250 recently. It continued to trade along its 200-day moving average which eventually acted as a support level. Then on Monday the index broke above the resistance level of around 24,500. It currently trades within a consolidation below the level of 25,000:
The S&P 500 index retraced some of its recent advance yesterday, as it bounced off the resistance level of around 2,800. Is this a downward reversal or just quick correction before another leg higher? If the S&P 500 index breaks above 2,800, we could see a move towards the January highs. Overall, the market is still close to breaking above its medium-term consolidation.
Concluding, the broad stock market will likely open higher today. Investors’ sentiment seems quite bullish despite yesterday’s trade tariffs announcement. But we may see more short-term uncertainty, as the S&P 500 index trades relatively close to the recent months’ highs.
If you enjoyed the above analysis and would like to receive free follow-ups, we encourage you to sign up for our daily newsletter – it’s free and if you don’t like it, you can unsubscribe with just 2 clicks. If you sign up today, you’ll also get 7 days of free access to our premium daily Gold & Silver Trading Alerts. Sign up today!
Thank you.
Paul Rejczak
Stock Trading Strategist
Stock Trading Alerts
Sunshine Profits – Free Stock Market Analysis


