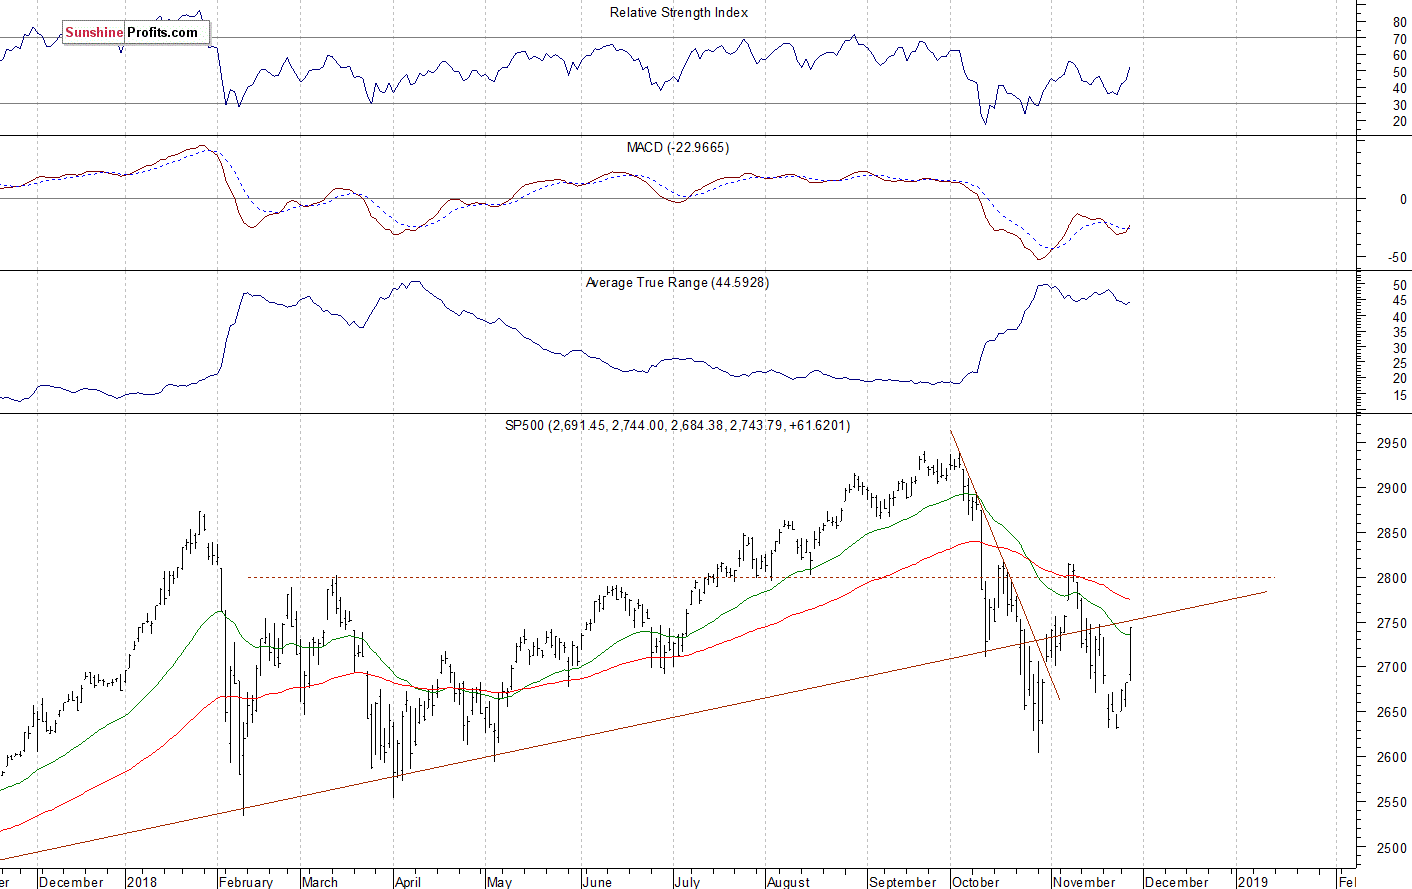
The U.S. stock market indexes gained 2.3-3.0% on Wednesday, as investors sentiment much improved following breaking out above the recent trading range. The S&P 500 index got back above the level of 2,700. It currently trades 6.7% below September the 21st record high of 2,940.91. The Dow Jones Industrial Average gained 2.5% and the Nasdaq Composite gained 3.0% on Wednesday.
The nearest important level of resistance of the S&P 500 index is now at 2,750, marked by some previous local highs. The resistance level is also at 2,780-2,800, among others. On the other hand, the level of support is at 2,680-2,700, marked by the recent resistance level.
The broad stock market got closer to its late October low recently. The S&P 500 index traded more than 10% below the record high. It was a bottoming pattern before an upward reversal. The market is now at the long-term upward trend line again. So will the short-term uptrend continue? For now, it looks like a two-month-long consolidation following the October rout:

Negative Expectations, Just Correction?
Expectations before the opening of today’s trading session are negative, because the index futures contracts trade 0.2-0.5% below their Wednesday’s closing prices. The European stock market indexes have gained 0.2-0.6% so far. Investors will wait for another series of economic data announcements today: Personal Spending, Personal Income, Initial Claims at 8:30 a.m., Pending Home Sales at 10:00 a.m., the FOMC Meeting Minutes release at 2:00 p.m. The broad stock market will likely retrace some of its yesterday’s rally today. We can see some short-term overbought conditions. However, there have been no confirmed negative signals so far.
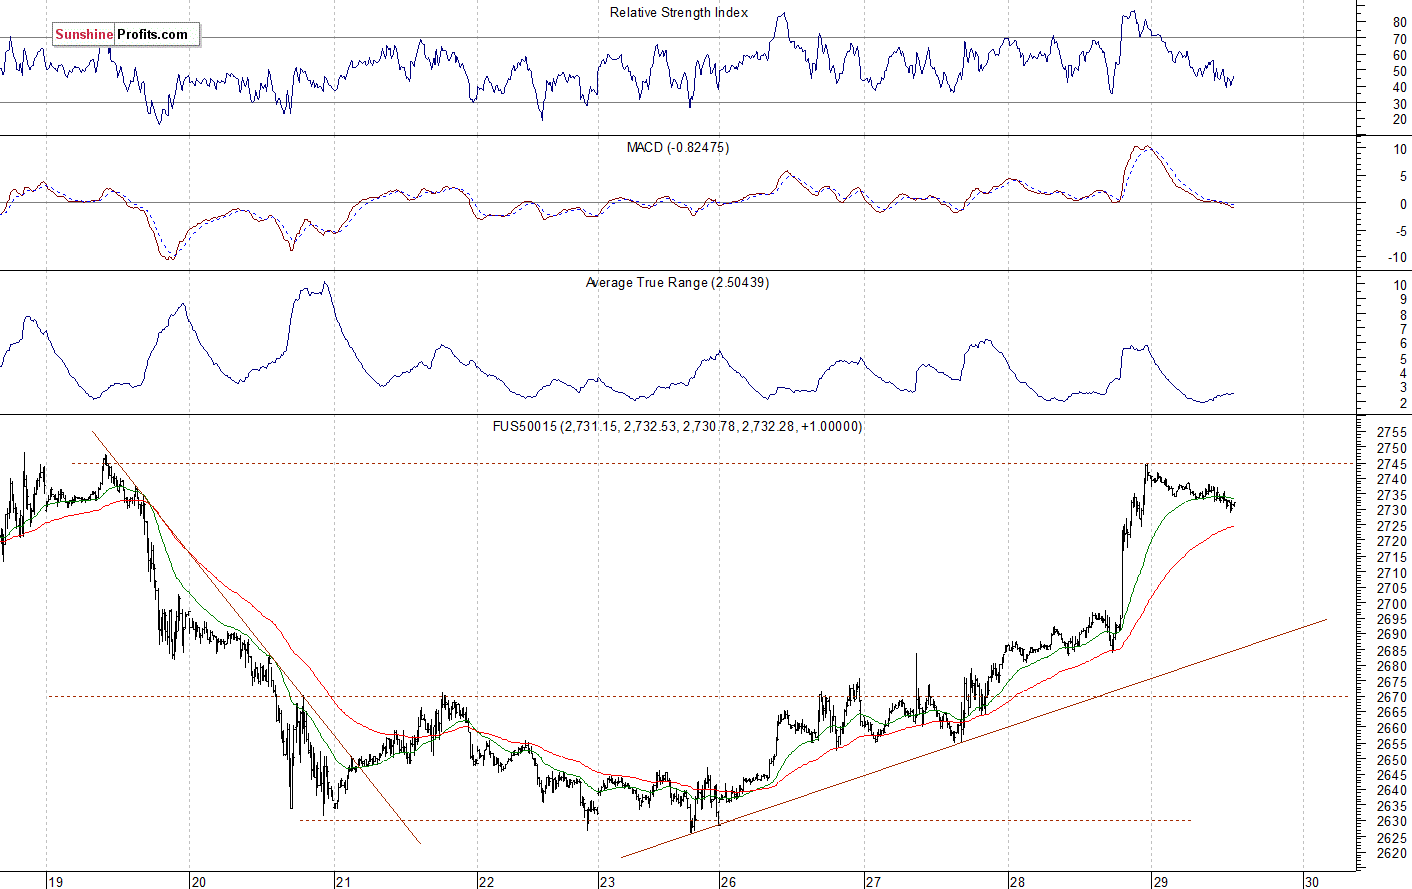
The S&P 500 futures contract trades within an intraday downtrend, as it retraces some of its yesterday’s advance. The market bounced off the resistance level of around 2,740-2,750. The nearest important support level is now at 2,700-2,720. The futures contract trades at its previous local high, as we can see on the 15-minute chart:
Nasdaq Close to 6,900 Again
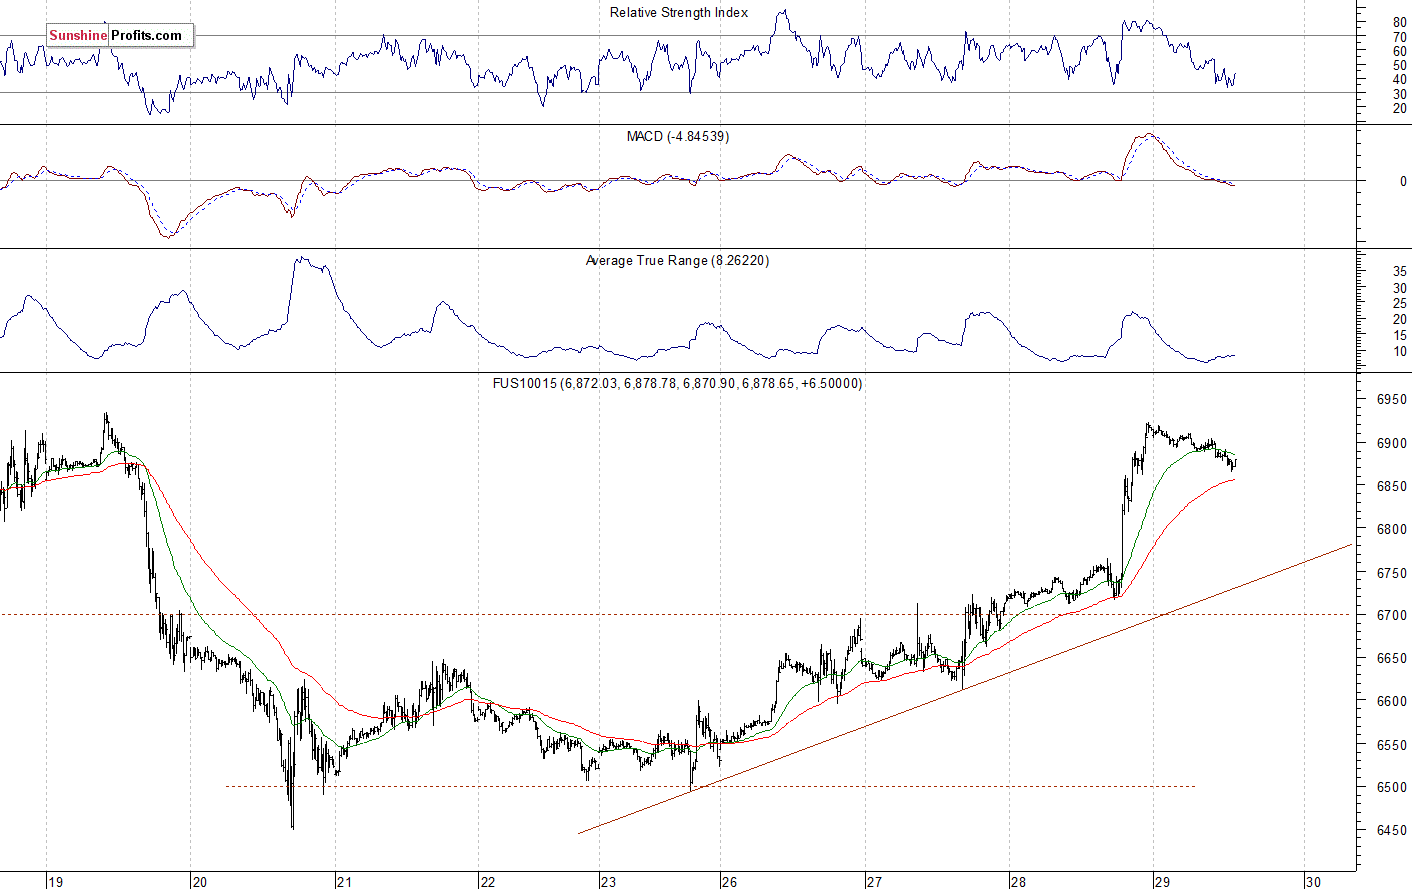
The technology Nasdaq 100 futures contract follows a similar path, as it retraces some of its yesterday’s rally. The nearest important level of resistance is now at 6,900-6,920, marked by the local high. On the other hand, the support level is at 6,800-6,850, marked by the previous resistance level. The tech stocks’ gauge accelerated its downtrend on Tuesday a week ago and it reached the new low of around 6,450. It was the lowest since the late April. Then the market fluctuated along the level of 6,500-6,550. And now it is trading close to 6,900 mark. We could see more short-term volatility. The Nasdaq futures contract trades along 6,900 mark this morning, as the 15-minute chart shows:
Big Cap Tech Stocks Rebounding
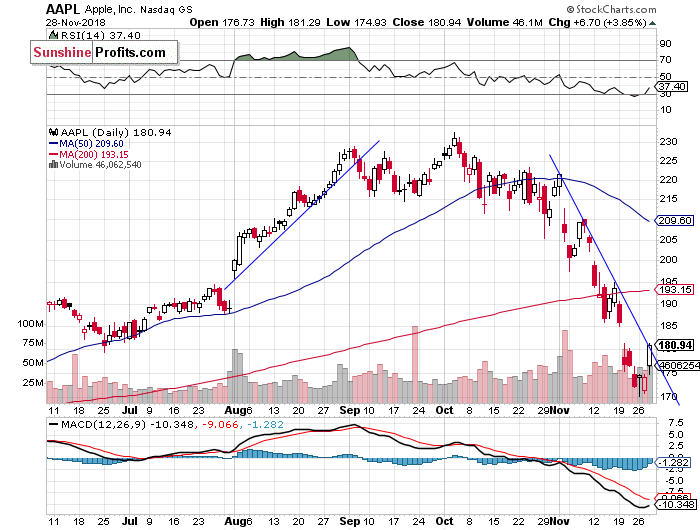
Let’s take a look at Apple, Inc. stock (AAPL) daily chart (chart courtesy of http://stockcharts.com). The stock accelerated its sell-off on last week’s Friday following Tuesday’s breakdown below the support level of $185-190. It fell closer to $170 on Monday. The market has reached a temporary bottom of around $170-175. It rallied yesterday, and it closed at the month-long downward trend line. We may see some short-term uncertainty here:
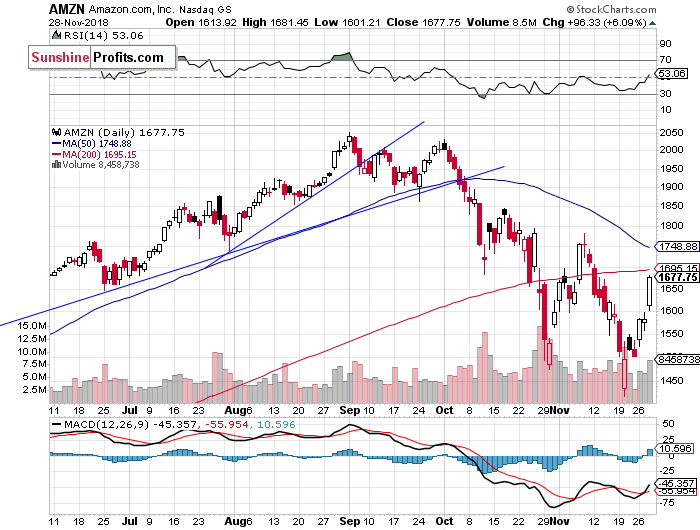
Now let’s take a look at Amazon.com, Inc. stock (AMZN) daily chart. It was relatively stronger recently, as it retraced some more of the recent sell-off. On Tuesday a week ago, the stock fell closer to the price of $1,400, before rebounding off the support level. Then the market got back above the resistance level of $1,500, and it accelerated higher yesterday. The nearest important resistance level is now at $1,700-1,800, marked by some previous local highs:
Dow Jones Also Higher
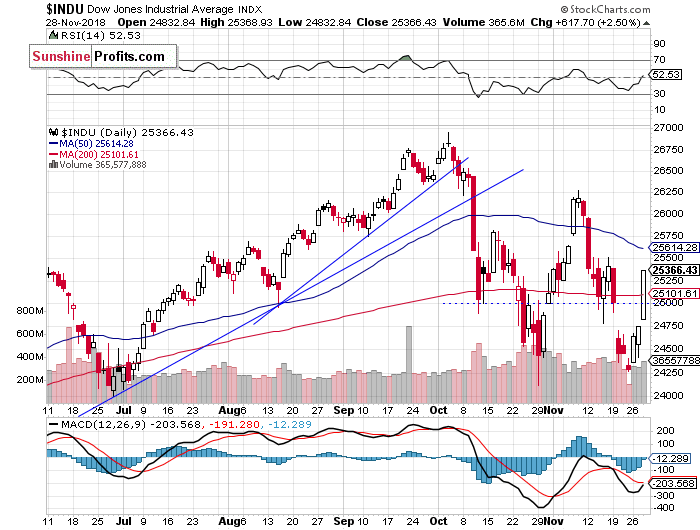
The Dow Jones Industrial Average broke above 25,000 mark yesterday, as it accelerated its short-term uptrend. The market got back to the resistance level of around 25,500, marked by the mid-November local highs. Will it continue towards the early November highs of 26,000-26,250? For now, it looks like a volatile consolidation following the October sell-off:
Japanese Nikkei at Previous High
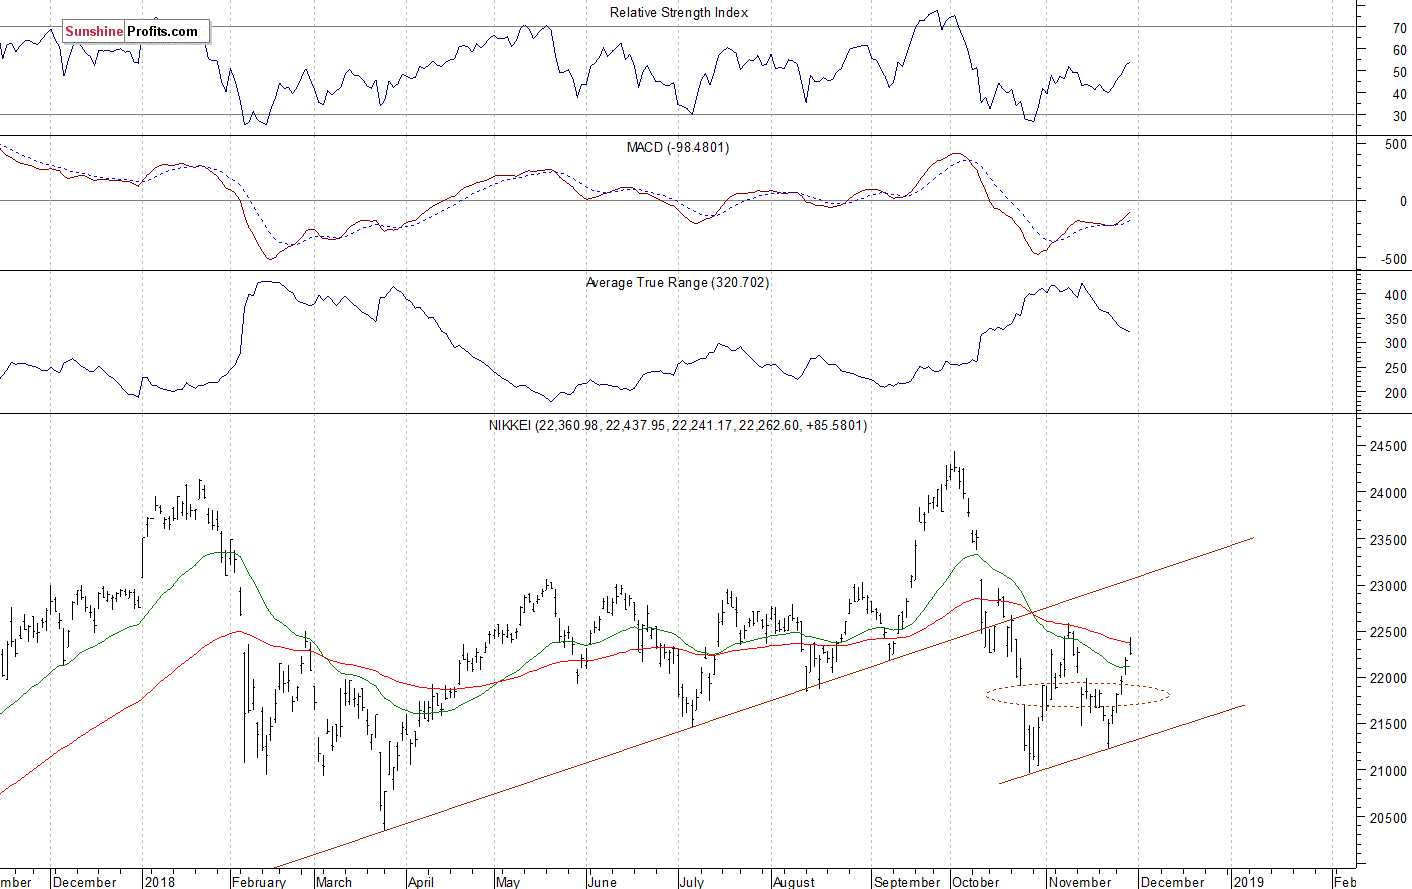
Let’s take a look at the Japanese Nikkei 225 index. It got back closer to the early November local high of around 22,580 today. However, the Nikkei continues to trade below its broken long-term upward trend line. For now, it looks like a relatively flat correction within a medium-term downtrend:
The S&P 500 index accelerated its short-term uptrend yesterday after breaking above its week-long trading range and the resistance level of 2,700. For now it looks like an upward correction or an advance within almost two-month long consolidation. There have been no confirmed short-term negative signals so far. However we can see some technical overbought conditions.
Concluding, the S&P 500 index will likely open lower today. The market may correct some of its yesterday’s rally this morning. However, it doesn’t look like a downward reversal. We could see some more short-term volatility.
If you enjoyed the above analysis and would like to receive free follow-ups, we encourage you to sign up for our daily newsletter – it’s free and if you don’t like it, you can unsubscribe with just 2 clicks. If you sign up today, you’ll also get 7 days of free access to our premium daily Gold & Silver trading Alerts. Sign up today!
Thank you.
Paul Rejczak
Stock trading Strategist
Stock trading Alerts
Sunshine Profits – Free Stock Market Analysis


