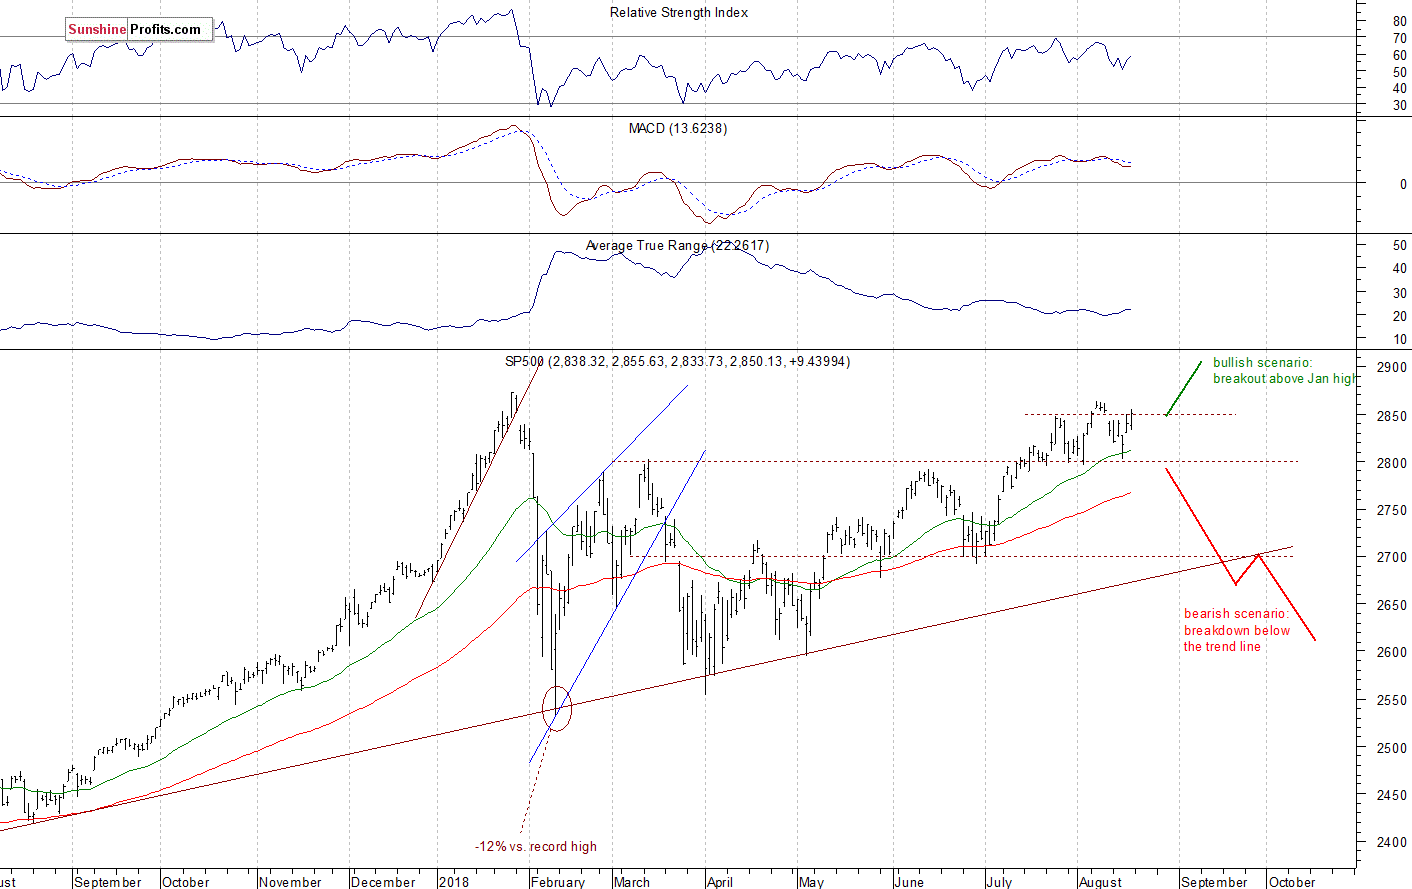
The U.S. stock market indexes gained 0.1-0.4% on Friday, extending their short-term consolidation on Friday, as investors hesitated following the recent advance. The S&P 500 index closed at 2,850 mark and it is currently just 0.8% below the January’s 26th record high of 2,872.87. The Dow Jones Industrial Average gained 0.4% and the technology Nasdaq Composite gained just 0.1% on Friday.
The nearest important level of support of the S&P 500 index remains at around 2,825-2,830, marked by the last Thursday’s daily gap up of 2,827.95-2,831.44. The next support level remains at 2,800-2,805, marked by the recent local lows. On the other hand, the level of resistance is at 2,850, marked the previous Friday’s daily gap down of 2,842.20-2,851.98. The next resistance level is at 2,860-2,865, marked by the early August local highs. The resistance level is also at 2,870-2,875, marked by the record high.
The broad stock market got close to its January’s record high recently, as investors’ sentiment improved following quarterly corporate earnings, economic data releases. The S&P 500 index is less than 1% below the mentioned January’s record high. Will it break higher? There are still two possible medium-term scenarios – bearish that will lead us towards the February low again, and the bullish one – breakout higher towards 3,000 mark. The latter one got very real recently:

Breaking Higher?
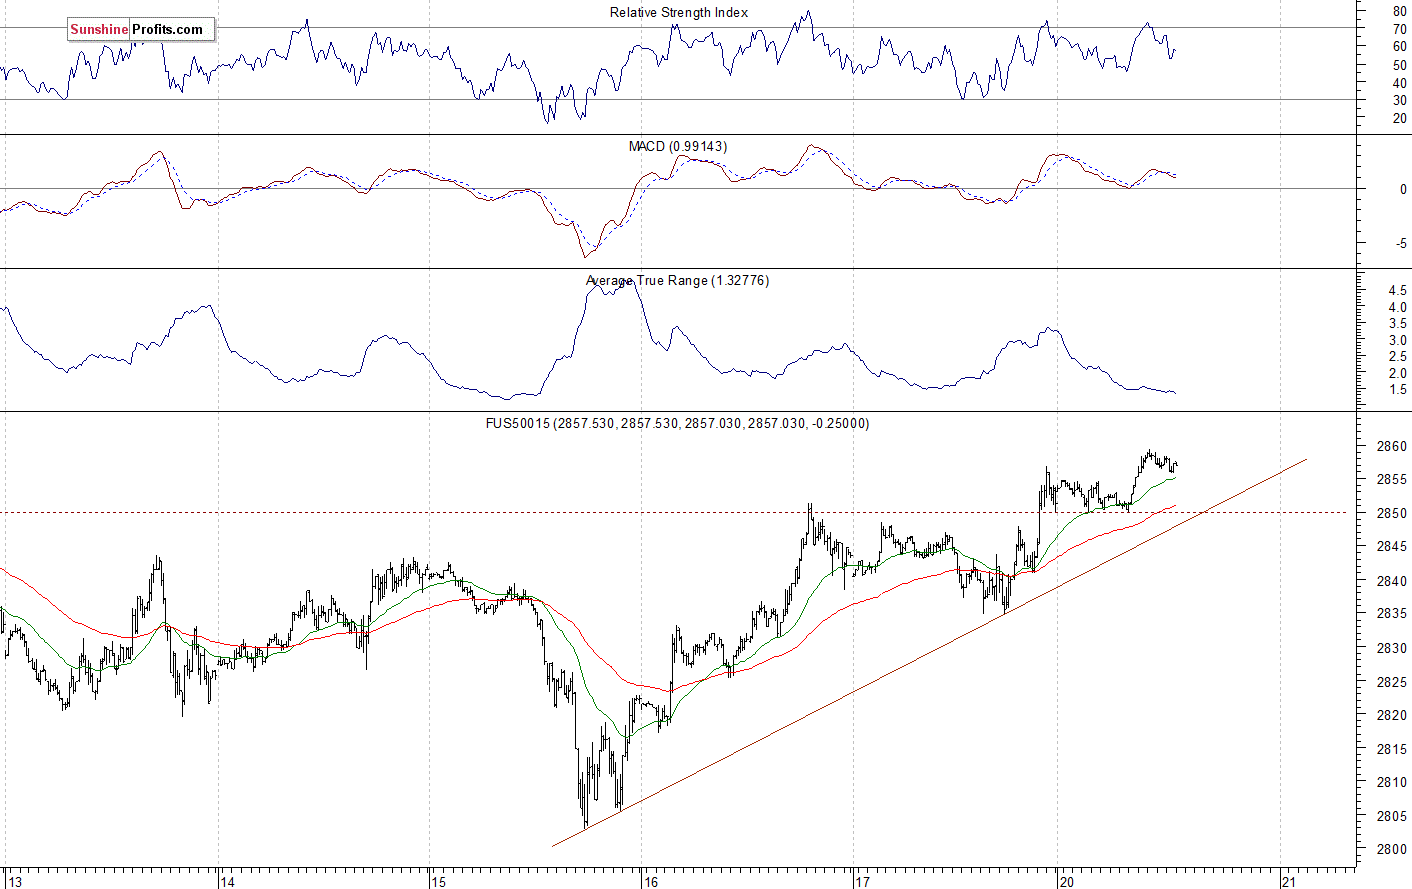
Expectations before the opening of today’s trading session are slightly positive, because the index futures contracts trade between +0.2% and +0.3% vs. their Friday’s closing prices. The European stock market indexes have gained 0.4-1.0% so far. There will be no new important economic data announcements today. The broad stock market will probably open higher. We may see an attempt at breaking above the early August local highs. If the S&P 500 index breaks above the mentioned resistance level of around 2,865, we could see another leg up.
The S&P 500 futures contract trades within an intraday uptrend, as it slightly extends its Friday’s advance. The nearest important level of resistance is now at around 2,860-2,865, marked by the recent local highs. On the other hand, support level is at 2,850, and the next level of support is at 2,835-2,840, marked by some recent local lows. The futures contract is now above its Thursday’s local high, as we can see on the 15-minute chart:
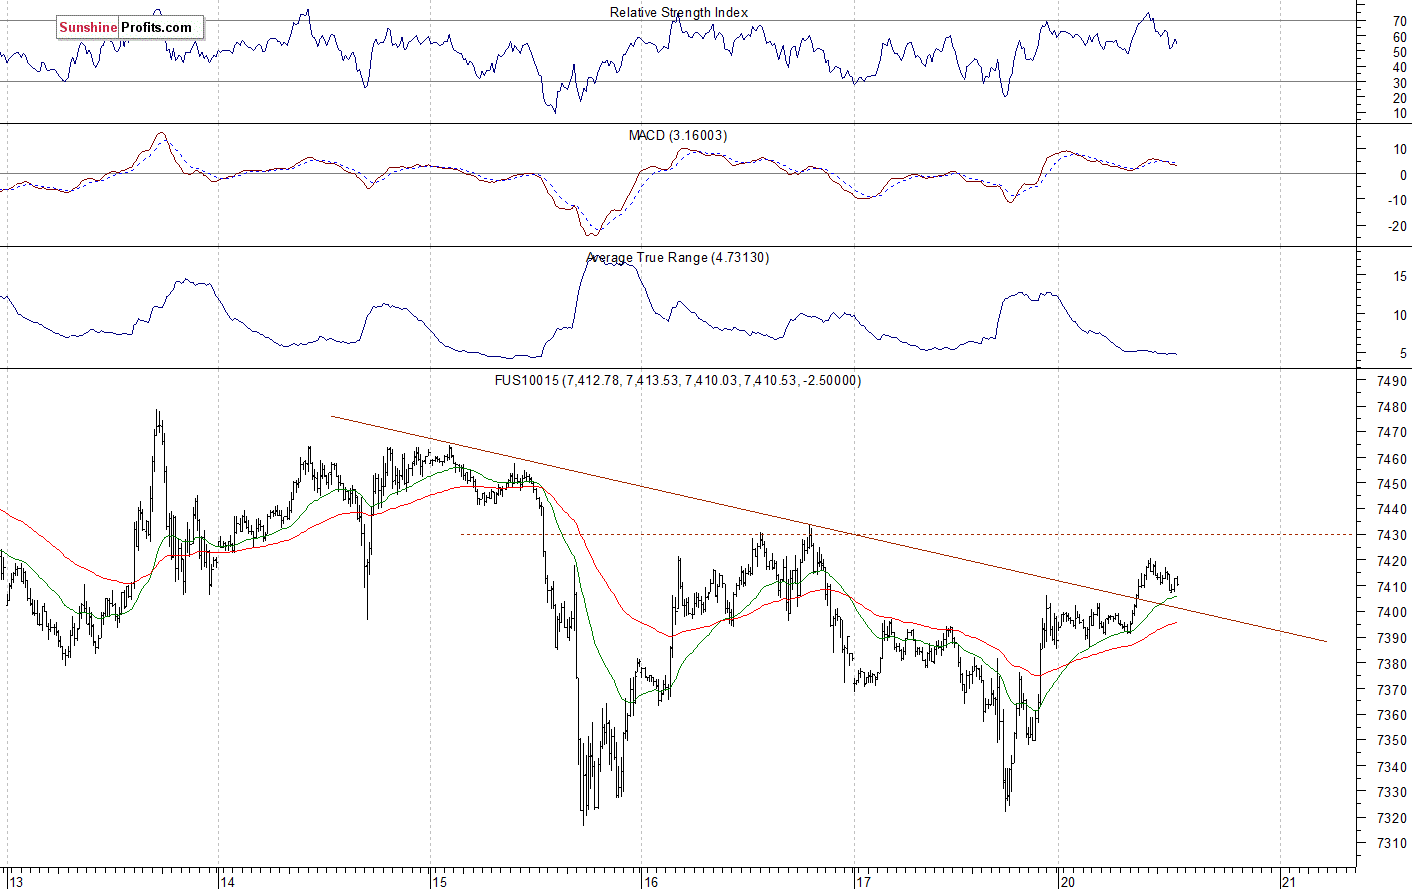
Nasdaq Back Above 7,400
The technology Nasdaq 100 futures contract follows a similar path, as it extends its last week’s advance. The market got back above 7,400 mark. However, it continues to trade below its last week’s local highs. The nearest important level of resistance is now at around 7,430, marked by the recent local highs. The next resistance level is at 7,450-7,470, among others. The Nasdaq futures contract trades slightly above its short-term downward trend line, as the 15-minute chart shows:
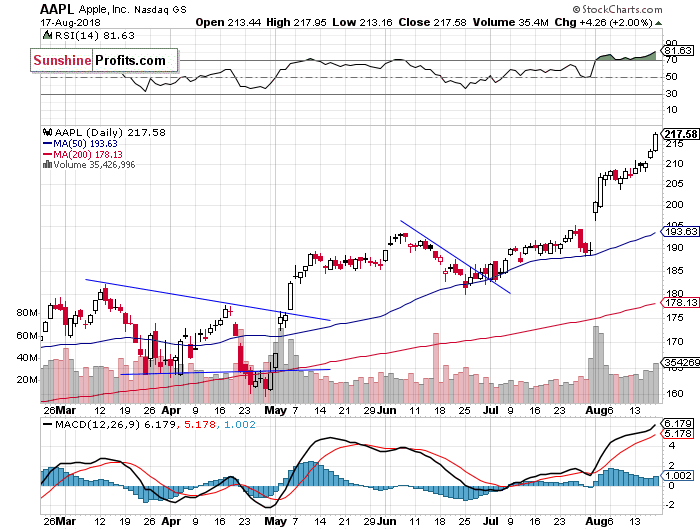
Apple Keeps Rallying Above One Trillion Dollars
Let’s take a look at Apple, Inc. stock (AAPL) daily chart (chart courtesy of http://stockcharts.com). Despite the recent broad stock market weakness, it reached the new record high at the level of $217.95 on Friday. Its current market capitalization is now at a spectacular $1.05 trillion. But will it last? There have been no confirmed negative signals so far. However, we may see a downward correction at some point. The nearest important level of support is now at $205-210, marked by the recent consolidation:
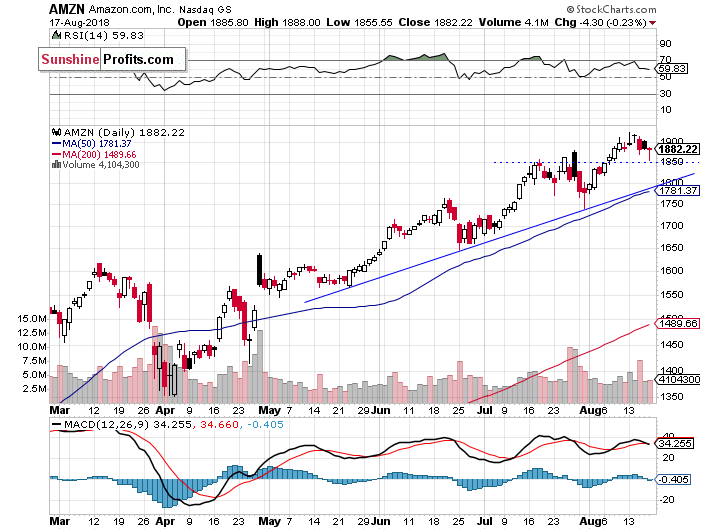
Now let’s take a look at Amazon.com, Inc. stock (AMZN) daily chart. It has reached the new record high on Monday a week ago at the level of $1,925.00. Since then it traded within a short-term consolidation. The nearest important level of resistance remains at around $1,925. On the other hand, support level is at 1,850. The stock continues to trade above its medium-term upward trend line, as we can see on the daily chart:
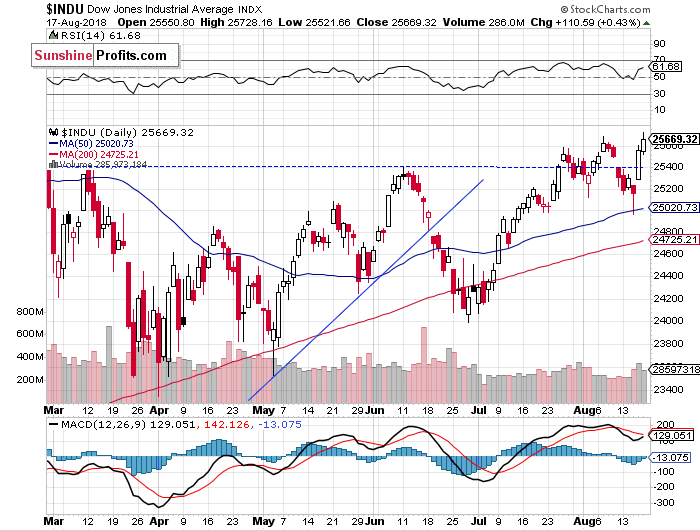
Dow Jones at New Local High
The Dow Jones Industrial Average reached a new local high on Friday, as it broke slightly above the level of 25,700. Is this a new uptrend? We can see some short-term overbought conditions, so the market may fluctuate along its local high for a while. The nearest important level of resistance is at around 25,800, marked by the late February local high. On the other hand, support level remains at 25,400, among others:
The S&P 500 index continued its short-term uptrend on Friday, as investors’ sentiment remained pretty bullish following Wednesday’s bounce off support level of 2,800. The market gets closer to its early August local highs of around 2,865, so we may see some short-term uncertainty.
Concluding, the broad stock market will likely open higher today. We may see some more short-term consolidation along the resistance level of around 2,850. For now, it looks like a month-long consolidation following the July rally. There are some close resistance levels ahead.
If you enjoyed the above analysis and would like to receive free follow-ups, we encourage you to sign up for our daily newsletter – it’s free and if you don’t like it, you can unsubscribe with just 2 clicks. If you sign up today, you’ll also get 7 days of free access to our premium daily Gold & Silver Trading Alerts. Sign up today!
Thank you.
Paul Rejczak
Stock Trading Strategist
Stock Trading Alerts
Sunshine Profits – Free Stock Market Analysis


