Stock Trading Alert originally sent to subscribers on June 1, 2017, 6:56 AM.
Our intraday outlook remains neutral, and our short-term outlook is neutral. Our medium-term outlook remains neutral, following S&P 500 index breakout above last year’s all-time high:
Intraday outlook (next 24 hours): neutral
Short-term outlook (next 1-2 weeks): neutral
Medium-term outlook (next 1-3 months): neutral
Long-term outlook (next year): neutral
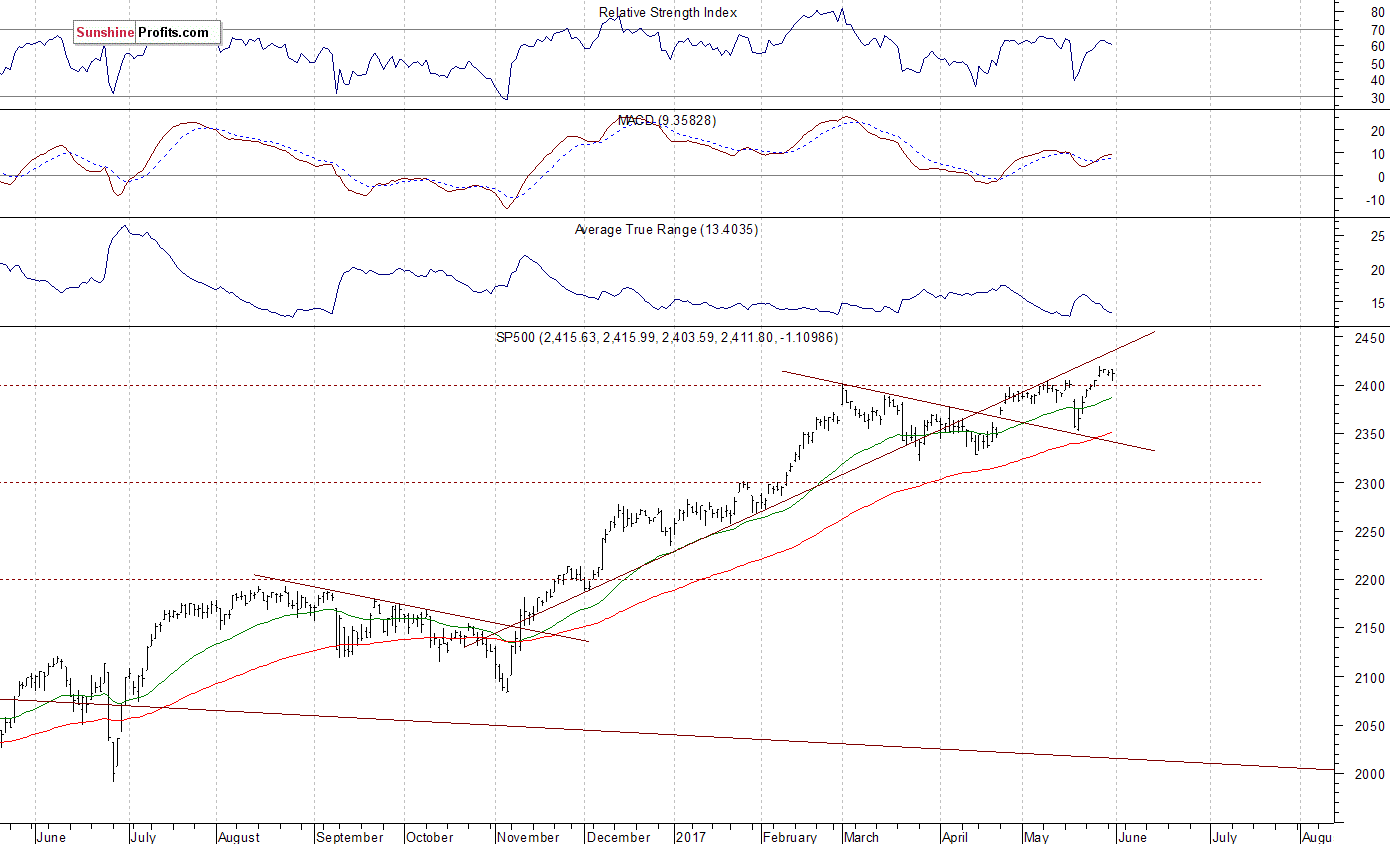
The U.S. stock market indexes lost 0.1% on Wednesday, following a bigger move down right after the opening of the trading session, as investors took some short-term profits off the table. Stocks have rebounded strongly after their mid-month quick two-session sell-off. The S&P 500 index is now trading close to its last week’s Thursday’s new all-time high of 2,418.71 after retracing the whole move down. The Dow Jones Industrial Average remains above the level of 21,000, however, it continues to trade below the March 1 all-time high. The technology Nasdaq Composite is still trading close to the level of 6,200, along its new all-time high. The nearest important resistance level of the S&P 500 index is at around 2,415-2,420, marked by new record high. On the other hand, support level is currently at around 2,400-2,410, marked by previous level of resistance, along with last Thursday’s daily gap up of 2,405.58-2,408.01. The next level of support remains at 2,390-2,395, marked by some short-term local lows. The support level is also at 2,385, marked by local low. Will the uptrend continue towards 2,500 mark? There have been no confirmed negative signals so far. However, we can see some overbought conditions and negative technical divergences. The S&P 500 index continues to trade slightly below its November-April upward trend line, as we can see on the daily chart:

Lots Of Economic Data Releases Today
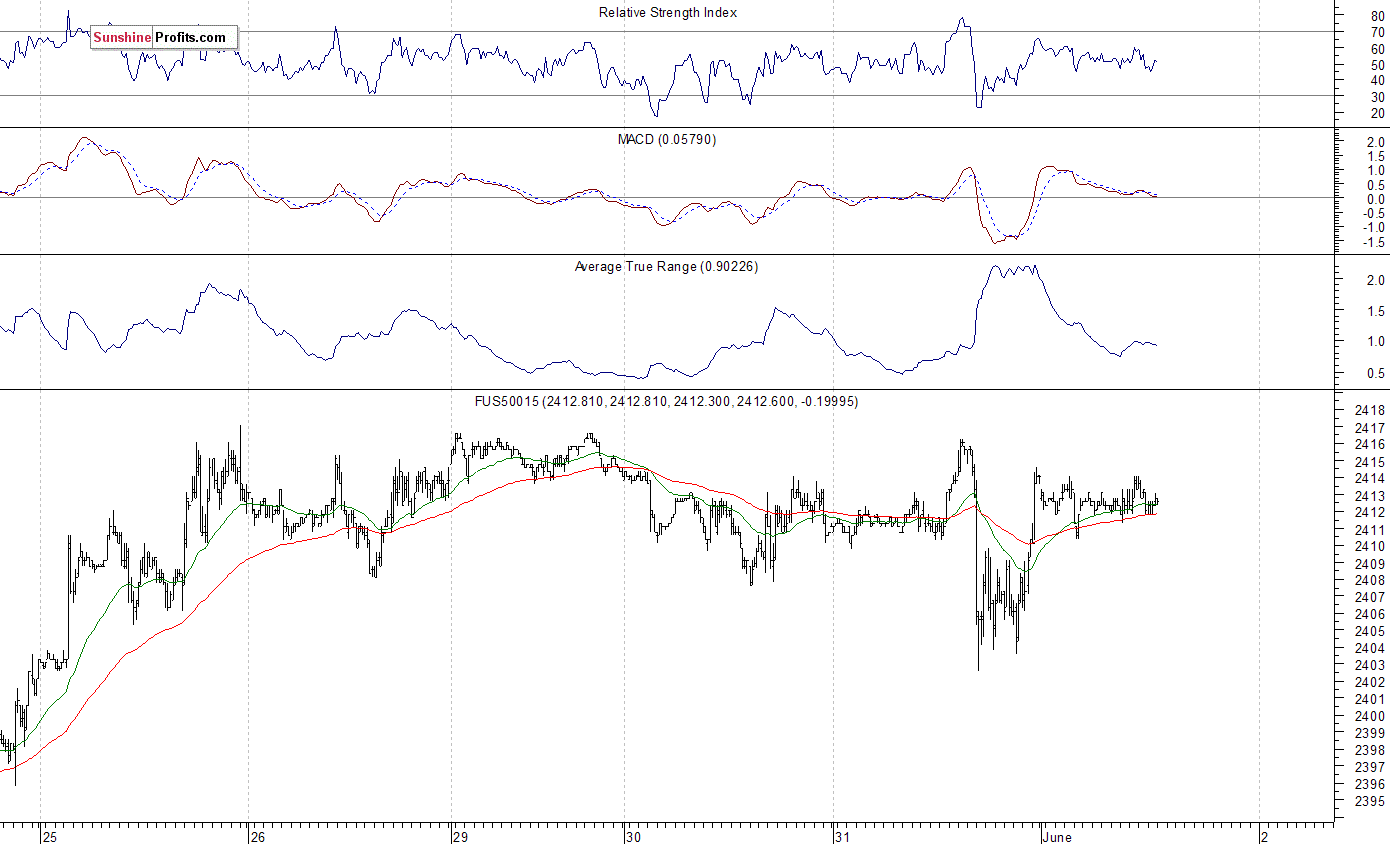
Expectations before the opening of today’s trading session are virtually flat, with index futures currently between -0.1% and 0.0% vs. their Wednesday’s closing prices. The European stock market indexes have gained 0.4-0.8% so far. Investors will now wait for series of economic data announcements: ADP Employment Change Report at 8:15 a.m., Initial Claims, Productivity at 8:30 a.m., ISM Index, Construction Spending at 10:00 a.m., Crude Inventories at 11:00 a.m. The market expects that the ADP Employment Change was at +181,000 in May, and the ISM Manufacturing PMI was at 54.7. The S&P 500 futures contract trades within an intraday consolidation, following yesterday’s move down and a quick rebound off support level at around 2,400-2,405. It continues to trade along new record high. The nearest important level of resistance is at around 2,415-2,420, marked by that new all-time high. On the other hand, support level is at 2,400-2,405, marked by previous level of resistance. The next important level of support is at 2,390-2,395, marked by recent fluctuations. The market trades within a relatively flat correction following recent rally reaching new all-time high. There have been no confirmed negative signals so far. However, we can see some short-term overbought conditions, along with negative technical divergences:
Are Technology Stocks Overbought?
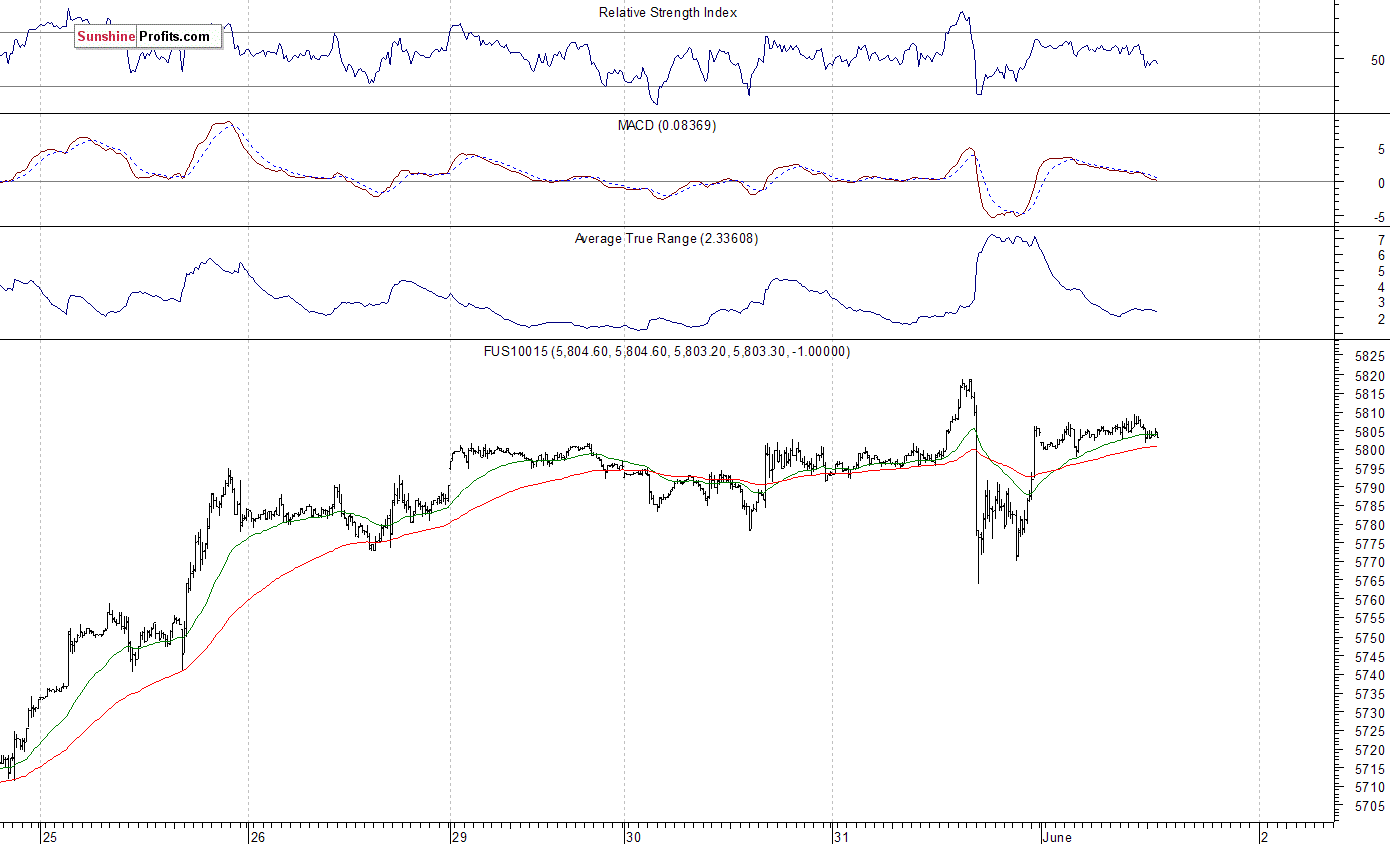
The technology Nasdaq 100 futures contract continues to trade close to its new record high above the level of 5,800. The nearest important level of resistance is at around 5,815-5,820, marked by new all-time high. On the other hand, support level is at 5,770-5,790, marked by yesterday’s intraday consolidation, among others. There have been no confirmed negative signals so far. But will technology stocks continue their uptrend despite some short-term overbought conditions? We can see some negative technical divergences:
Concluding, the S&P 500 index extended its short-term fluctuations on Wednesday, following recent rally reaching new all-time high of 2,418.71. For now, it looks like a flat correction within an uptrend. The market continues its eight-year-long bull market. The index broke above three-month-long medium-term consolidation along the level of 2,400. But will the uptrend accelerate? Or is this some topping pattern before downward reversal? We still can see some negative medium-term technical divergences. However, there have been no confirmed negative signals so far.
If you enjoyed the above analysis, we invite you to check out our other services. We focus on fundamental analysis in our monthly Market Overview reports and we provide daily Gold & Silver Trading Alerts with clear buy and sell signals. If you’re not ready to subscribe yet and are not on our mailing list yet, we urge you to join our gold newsletter today. It’s free and if you don’t like it, you can easily unsubscribe.
Thank you.
Paul Rejczak
Stock Trading Strategist
Stock Trading Alerts


