Financial markets remain caught in a period of clear distress, and this negative activity can be viewed in the charts detailing the action in the major stock benchmarks. In recent weeks, we have seen some two-way activity that may have helped traders feel at ease after recent declines. However, if we take a closer look, we can see that things are actually much more bearish than they might appear at first glance.
When dealing with the market valuations of the S&P 500, I prefer to watch for developing activity in the SPDR S&P 500 ETF [
In this first chart, we can see that the real market destruction (in terms of valuation) began at the end of July. Up to this point, markets had pushed forward in a stable bull trend that was accompanied by higher lows in the process:
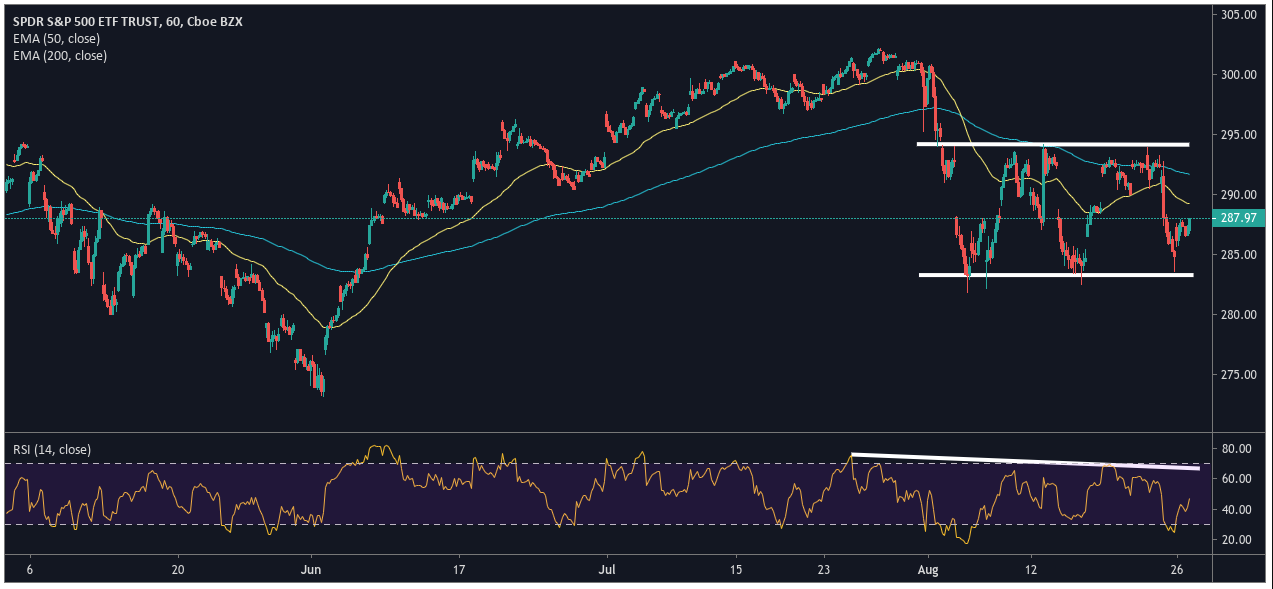
However, the recent declines (which began to accelerate in early August) forced prices through their 50-day and 200-day exponential moving averages. This is often a clear indication that daytraders in the market have shifted sentiment to the bearish side of the equation. Indicator readings have largely confirmed these moves as we are clearly declining and show the potential to extend lower.

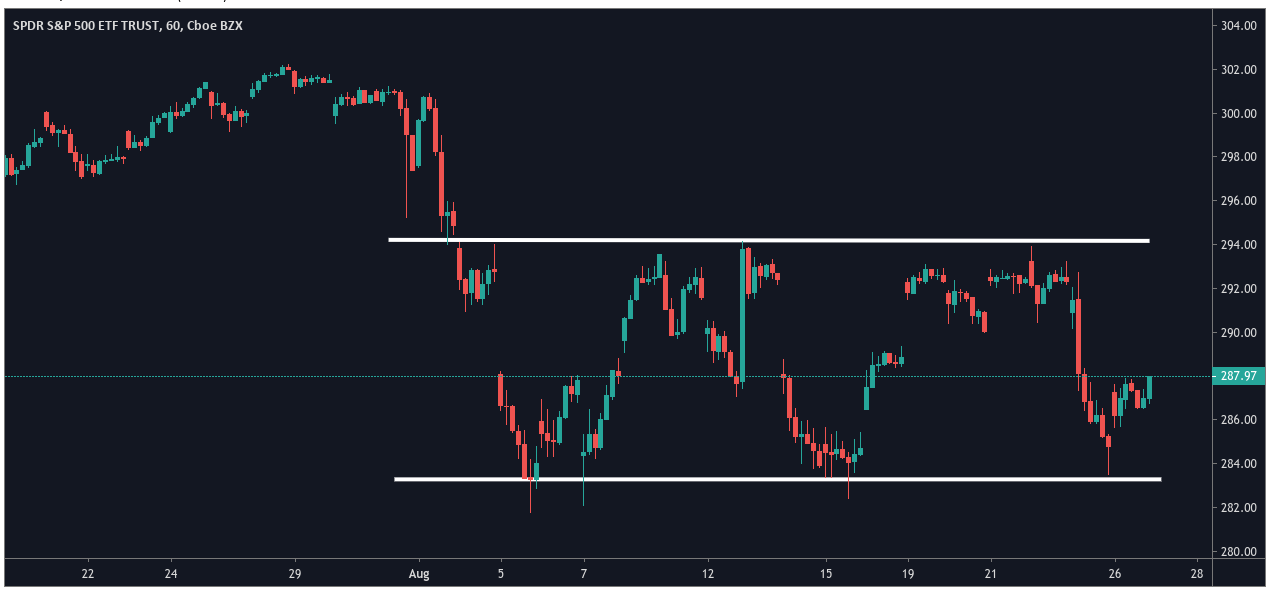
Perhaps more useful in defining short-term trading stances will be the recent range area that has been carved out during the month of August. Specifically, we can see that range support comes in near 283.30 while the upper boundary has defined supply as being present at 294.20.
As long as this trading range holds, investors might find themselves in something of a quandary as there is no clear indication that we will be able to post new highs again before the end of the year. Most of the evidence suggests that the ultimate move will actually be to the downside, given the fact that we have broken our short-term moving averages and the relative strength index is still holding at mid-levels. As long as this continues, we might see daytraders maintain a bias that is geared toward selling on rallies.
___
Equities Contributor: Dividend Investments
Source: Equities News


