The S&P 500 fell to a new low this week, but various measures of liquidity, breadth, momentum and sentiment show surprisingly little panic (compared to October). Does the lack of fear mean increased down side risk?
Below is a free excerpt of the December 9, Profit Radar Report, which takes a detailed look at various sentiment, liquidity, breadth and moment indicators to gauge the down side risk. Since this update is published out of context with all the other updates, an additional “Summary” section is provided at the end of the December 9 Profit Radar Report to provide bigger picture context.
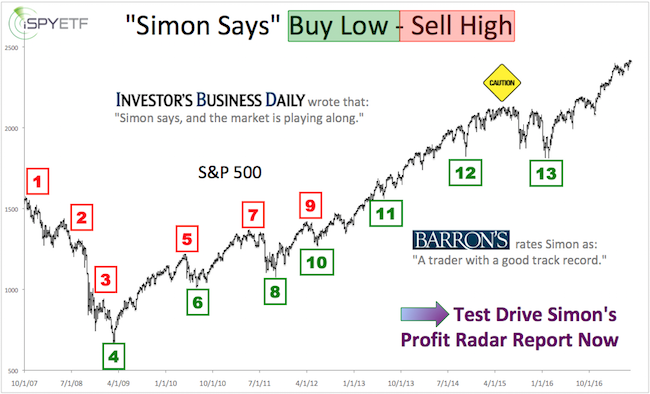
Barron’s rates iSPYETF as “trader with a good track record” and Investor’s Business Daily says: “When Simon says, the market listens.” Find out why Barron’s and IBD endorse Simon Maierhofer’s Profit Radar Report.
* * * * * December 9, 2018 Profit Radar Report * * * * *
The S&P 500 closed at 2,633.08 on Friday. That’s only 1.99 points higher than the November 23 low. If the S&P would have closed at a new low, it would have been interesting to see if there are any bullish divergences.

Well, futures are down 20+ points in Sunday’s trading, so let’s just pretend the S&P closed at new lows, and look for potential divergences anyway. The blue box highlights the price action since the September high.
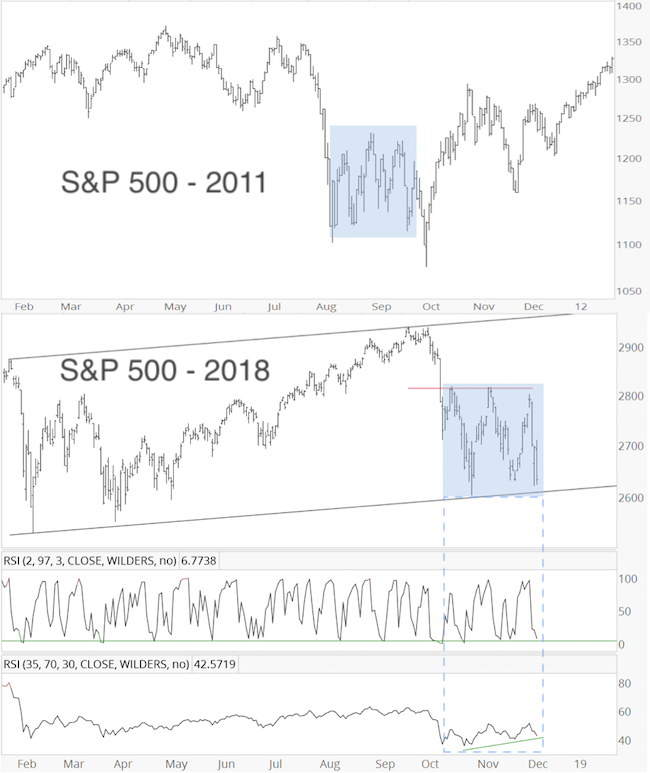
- RSI-35 did not confirm the ‘new low’ (RSI-2 is near over-sold)
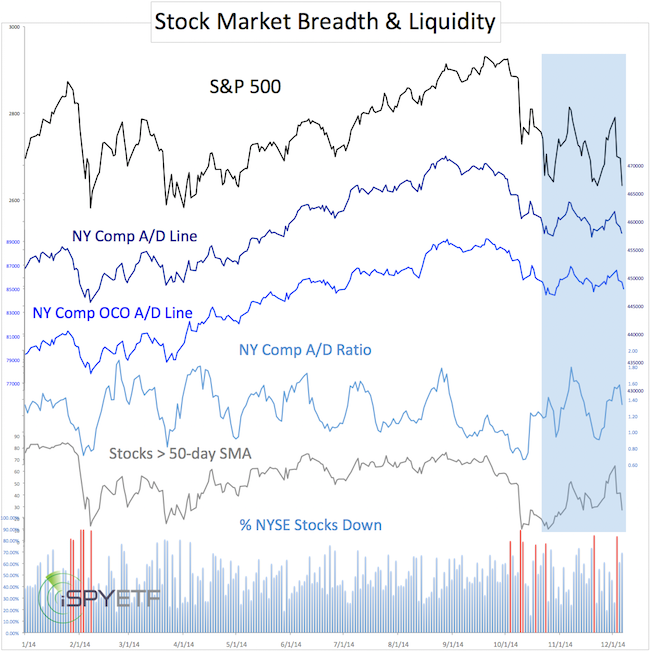
- The cumulative NY Composite a/d lines did not confirm
- The NY Composite a/d ratio did not confirm
- The percentage of stocks below their 50-day SMA did not confirm
If you enjoy quality, hand-crafted research, >> Sign up for the FREE iSPYETF e-Newsletter
How about different sentiment gauges?
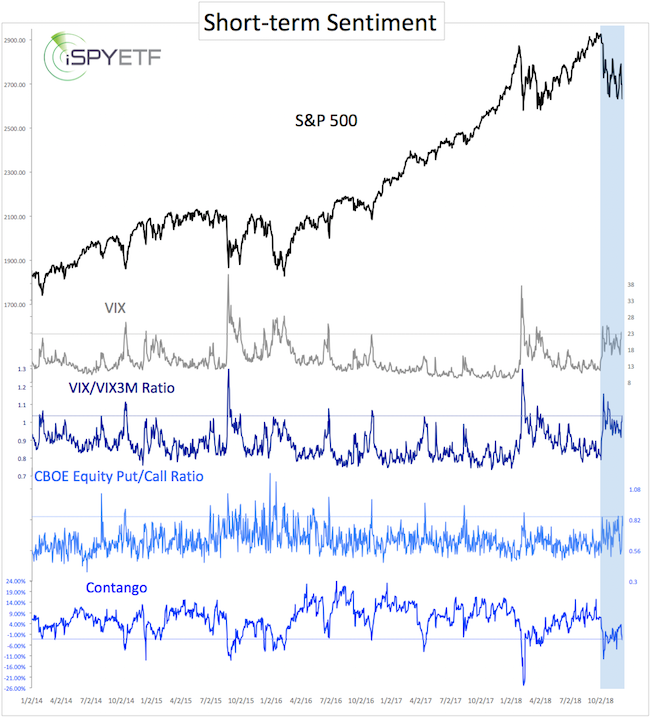
- The VIX is below its October extreme
- The VIX/VIX3M ratio is below its October extreme
- The CBOE equity put/call ratio is at the same level
- Contango is above its October extreme
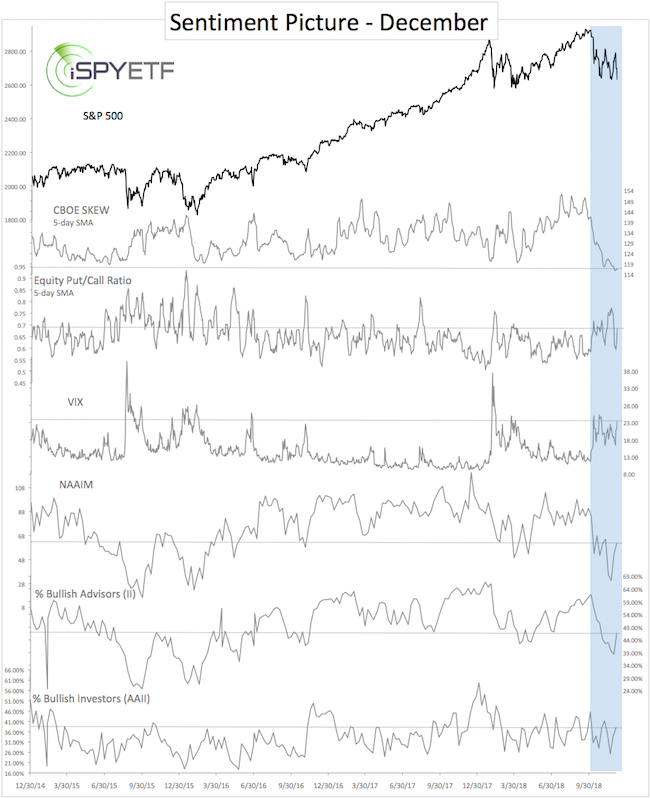
- The SKEW carved out a new low
- The CBOE equity put/call ratio (5-day SMA) is below its November extreme
- NAAIM equity exposure is about even, but above its November extreme
- Bullish Advisors polled by II are less bearish than last week
- Bullish Investors polled by AAII are less bearish than last week
All the above indicators show that there is little panic, certainly less panic than in October or November. This could be viewed as either 1) a bullish divergence or 2) there is enough room for the market to fall further.
Based on Elliott Wave Theory, the S&P 500 could be 1) nearing the exhaustion point of this down leg, or 2) be in a strong and sustained wave 3 lower (S&P could still rally towards or into 2,700s before next down move). The summary section below discusses which scenario is more likely.
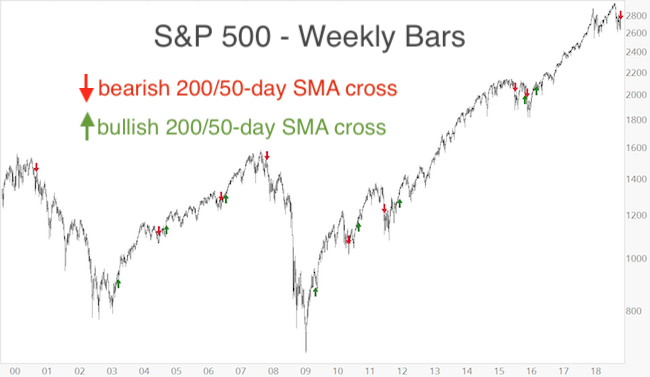
Another attention grabber was last week’s ‘death cross,’ where the 50-day SMA fell below the 200-day SMA.
The last time death cross that received a lot of attention was in May 2016, when the 50-week SMA fell below the 100-week SMA. This was supposed to be an ‘irrefutable sell signal,’ but ultimately turned out to be one of the best buying opportunities ever.
At best, SMA crossovers have a spotty track record, and we don’t base our anlysis on such lagging indicators. For those interested, the arrows in the weekly chart below mark all bearish and bullish 200/50-day SMA crosses over the past 20 years (weekly chart shown to capture longer-term history of signals).
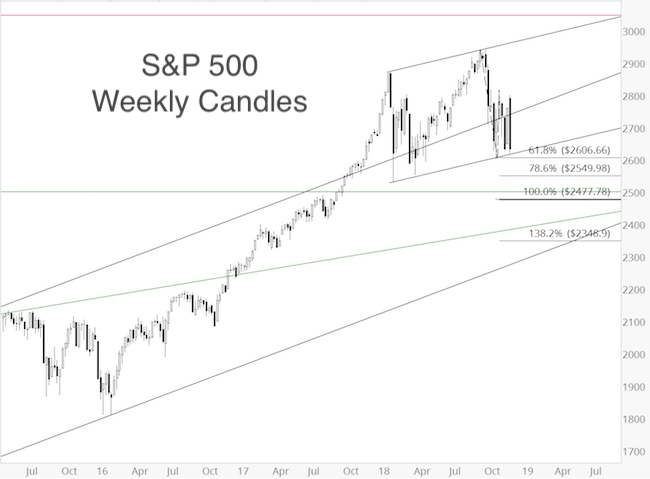
Shown below are various support levels that may help navigate the coming weeks, and answer the question posed above: What’ next? Sustained move lower, or quick wash out decline followed by snap-back rally?
If you enjoy quality, hand-crafted research, >> Sign up for the FREE iSPYETF e-Newsletter
- 2,618: Black trend channel
- 2,607: Wave C = 61.8% wave A
- 2,550: Wave C = 78.6% wave A
- 2,500: Fibonacci support going back to 2011
- 2,478: Wave C = 100% wave A
- 2,385: Trend line support going back to 1998
- 2,280: Trend channel support going back to 2009
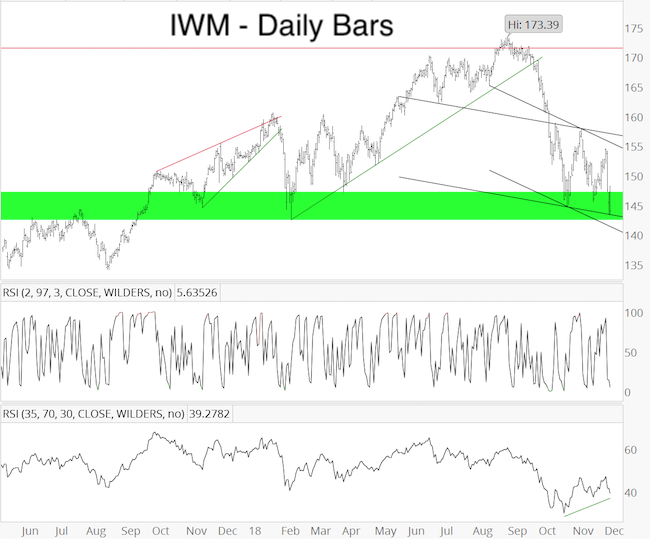
The Russell 2000 IWM is in the general green support range, with trend channel support at 143.25 and 141.30. A bounce from 143.25 – 141.30 seems likely, but sustained trade below the lower trend channel would unlock lower targets.
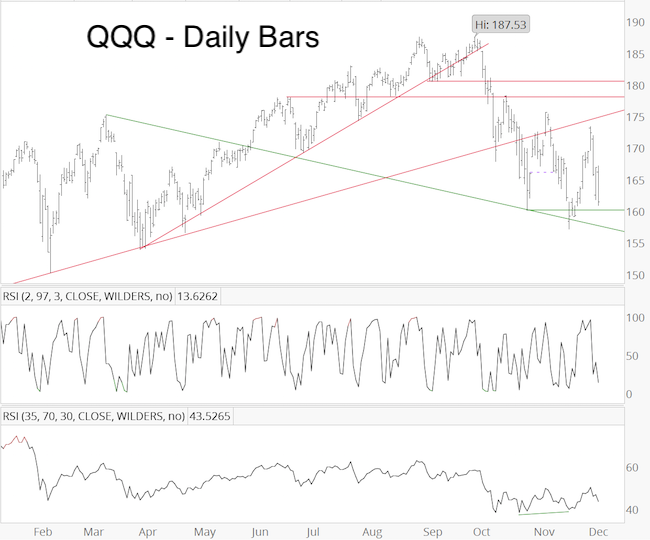
The Nasdaq-100 QQQ has a general range of support at 161 – 157. A break below, would likely lead to a retest of the February/March lows at 154-150.
Summary: The above analysis was based on Friday’s closing price. The S&P 500 futures chart below includes Sunday’s 20+ point drop. Trade is right around black trend channel support. Anytime prices reaches support, odds of a bounce increase.
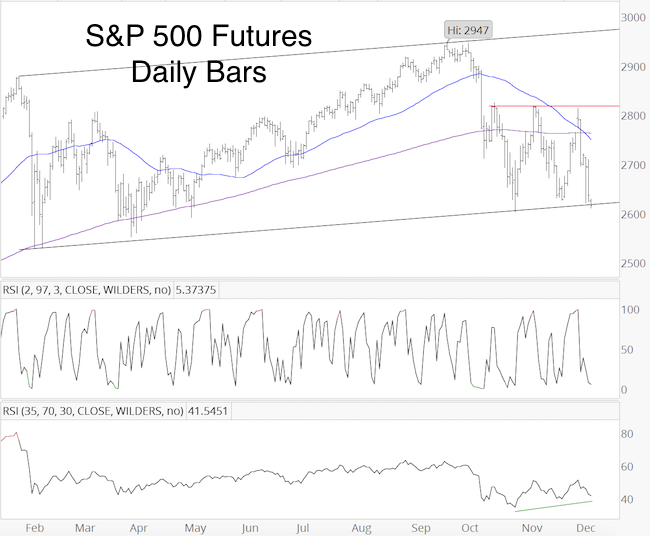
Based on the Elliott Wave Theory structure, we are trying to figure out whether we are nearing the end of this down leg (with a potential wash out decline), or if trade will accelerate lower (as a wave 3 would).
A brief drop (1-3 days) below 2,618 (with next support at 2,607, 2,550 and perhaps as low as 2,500) followed by a quick recovery would preserve the bullish divergences and suggest sellers got ‘washed out’ and a year-end rally is underway.
Persistent trade below 2,618 and 2,607 means we need to allow for more weakness.
We will take a stab at going long (only with a small amount as this correction may carve out lower lows eventually) if the S&P 500 drops below 2,607 and subsequently rallies above 2,620 (stop-loss to be set at that day’s low). The SPY buy level is thus linked to the S&P 500 (approximate corresponding SPY levels: buy on drop below 261 followed by move above 262.10 with stop-loss at day’s low).
The very first graph of today’s update (S&P 500 in 2011 – blue box) illustrates what a wash out decline may look like.
* * * * * December 9, 2018 Profit Radar Report * * * * *
SUMMARY: The lack of fear, expressed by various ‘bullish divergences,’ is likely to result in a short-term bounce. Back in September, we expected a correction toward 2,400, and that seems still likely (longer-ter S&P 500 outlook available here). A drop toward 2,400 (or at least below 2,500), would probably trigger the kind of ‘panic readings’ commensurate with a more significant bottom.
Continued updates are available via the Profit Radar Report.
Simon Maierhofer is the founder of iSPYETF and the publisher of the Profit Radar Report. Barron’s rated iSPYETF as a “trader with a good track record” (click here for Barron’s evaluation of the Profit Radar Report). The Profit Radar Report presents complex market analysis (S&P 500, Dow Jones, gold, silver, euro and bonds) in an easy format. Technical analysis, sentiment indicators, seasonal patterns and common sense are all wrapped up into two or more easy-to-read weekly updates. All Profit Radar Report recommendations resulted in a 59.51% net gain in 2013, 17.59% in 2014, 24.52% in 2015, 52.26% in 2016, and 23.39% in 2017.
Follow Simon on Twitter @ iSPYETF or sign up for the FREE iSPYETF e-Newsletter to get actionable ETF trade ideas delivered for free.
If you enjoy quality, hand-crafted research, >> Sign up for the FREE iSPYETF e-Newsletter
Read more at https://www.ispyetf.com/view_article.php?slug=S&…


