
Before committing any money into equities or anything else these days consider the following lyrics penned by the currently on tour heavy metal icons Judas Priest: “never turn your back on the ripper.”
Despite last week’s Federal Reserve and news-induced price volatility, the market held up. It’s a sign that while many are confused, some are still sneaking money into stocks.
It’s lonely being a contrarian, although after my commentary on the 200-day moving average recently, I wonder if I’m suddenly in a crowded theater. It seems other market analysts and commentators have started discussing the once venerable but until recently mostly forgotten indicator which was once known as the dividing line between bull and bear markets.
Out of curiosity I did a quick Google search before I wrote this week’s installment, and I found nine mentions of the 200-day line on May 3 and May 4 alone. A quick search of my usual weekend haunts also showed increased attention is suddenly being paid to the indicator with an informational well-written piece on the indicator featured on Zero Hedge by Lance Roberts.

Indeed, last week I suggested the market was ripe for a rally, and although it took a few days, most of what I expected may have started, at least as of the close of business on May 4.
Of course, one day is not a rally, and there are no guarantees that Friday’s big gains will extend given the way the market has behaved over the last three months. Still, because of the posture of the continuously improving technical indicators it may be worth moving some money cautiously back into the market albeit with fully operational night vision glasses, unglazed eyes in the backs of our heads, and with the proverbial foot in the door.
Yawn Inducing Support Holds Again
As I noted last week, the least monitored indicator in the stock market in these days of CTA, quant driven formulas and robot algo brewed and stewed trading strategies, is probably the most meaningful indicator of the moment. Yes, the yawn inducing 200-day moving average. And ironically, that’s because the algos seem to focus on it along with other simple technical analysis indicators which they combine with headline scanning in order to move the market.
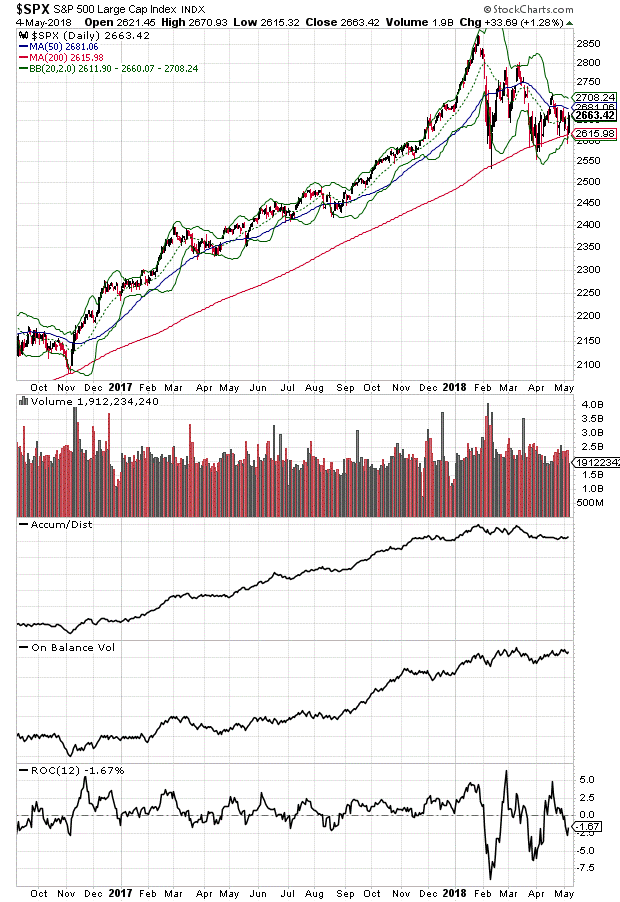
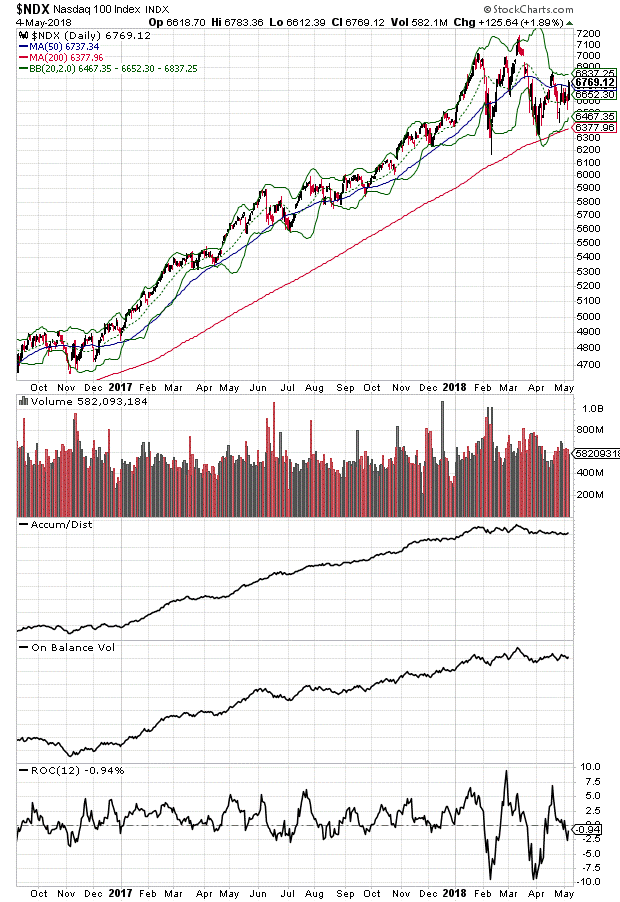
Starting with the chart of the S & P 500 one thing stands out. The 200-day moving average has held the market in a long-term uptrend since the correction started back in January. And although the picture is not quite as digitally precise with the Nasdaq 100, the action there is technically similar.
Certainly, it’s still not fully clear whether a new bull market leg is upon us. For one volume was less than one could hope for on May 4 and thus the Accumulation Distribution (ADI), On Balance Volume (OBV) and Rate of Change (ROC) indicators were less encouraging than they were a week earlier.
But none of these indicators turned particularly negative either, which is a moderate positive and keeps the lights on for now, especially if prices continue higher over the next few days and upside momentum builds as algos start piling on.
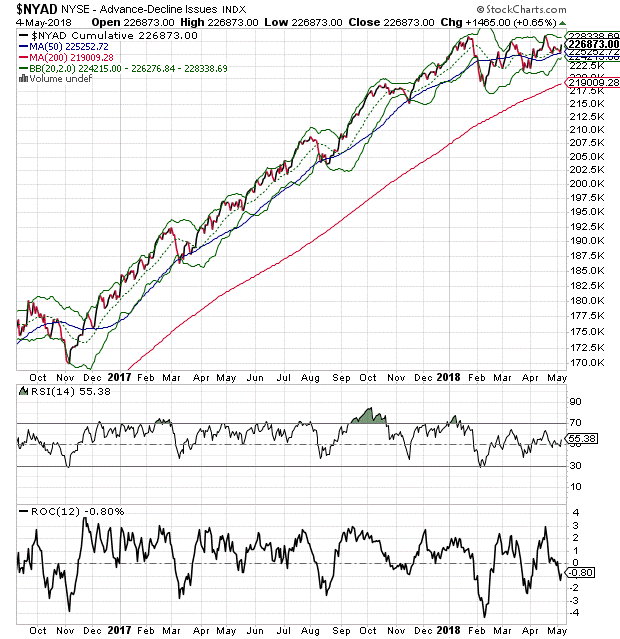
Even in the face of some doubts creeping into the bullish case, the New York Stock Exchange Advance Decline line (NYAD), which remains as the most reliable indicator of the stock market’s dominant trend since the November 2016 presidential election, is still giving the uptrend the benefit of the doubt as it remained above meaningful support areas and turned in a very strong performance on the May 4 rally.
Focus on Price Action, Not News
With the world and the markets on edge this is one of those periods when watching price charts and blocking out the ambient noise of news, opinions, and extraordinary events is the best way to stay solvent.
Of course, I am not recommending life in a news vacuum. But surviving to trade another day in this market is more about the reaction of any stock, ETF or other asset class to the news and how the robots decide to trade the headlines.
This dynamic is best viewed and analyzed on technical price charts whose visual cues often filter out the ambient noise while letting traders focus on what matters most, price action. In addition, proper use of price charts coupled with sound trading principles, planning, and risk management techniques generally increases the chances of successful trades – nice wins or manageable losses.
Moreover, in this market, the big screen in the trading room should be on the price charts while the smaller ones should be on the news feeds. Furthermore, until the 200-day moving average for the S&P 500 gets completely destroyed beyond the shadow of a doubt, the bulls still get to plead plausible deniability.
Finally, given the potentially treacherous nature of the moment, it makes no sense for anyone – including me – to think they’ve figured out the market. In fact, events can turn any trend on its ear at any moment.
Dr. Joe Duarte is author of Trading Options for Dummies, now in its third edition. He writes about options and stocks at www.joeduarteinthemoneyoptions.com.
About MoneyShow.com: Founded in 1981, MoneyShow is a privately held financial media company headquartered in Sarasota, Florida. As a global network of investing and trading education, MoneyShow presents an extensive agenda of live and online events that attract over 75,000 investors, traders and financial advisors around the world.


