The most prominent action in the precious metals market that we saw last week, took place in silver – the white metal closed the week below the important long-term support/resistance line, thus invalidating the previous breakout. However, there’s more to the precious metals market than just the action in silver. In today’s free gold analysis, we discuss both the developments in silver and other factors.
Let’s start with silver itself (charts courtesy of http://stockcharts.com).

In Friday’s alert, we wrote the following:
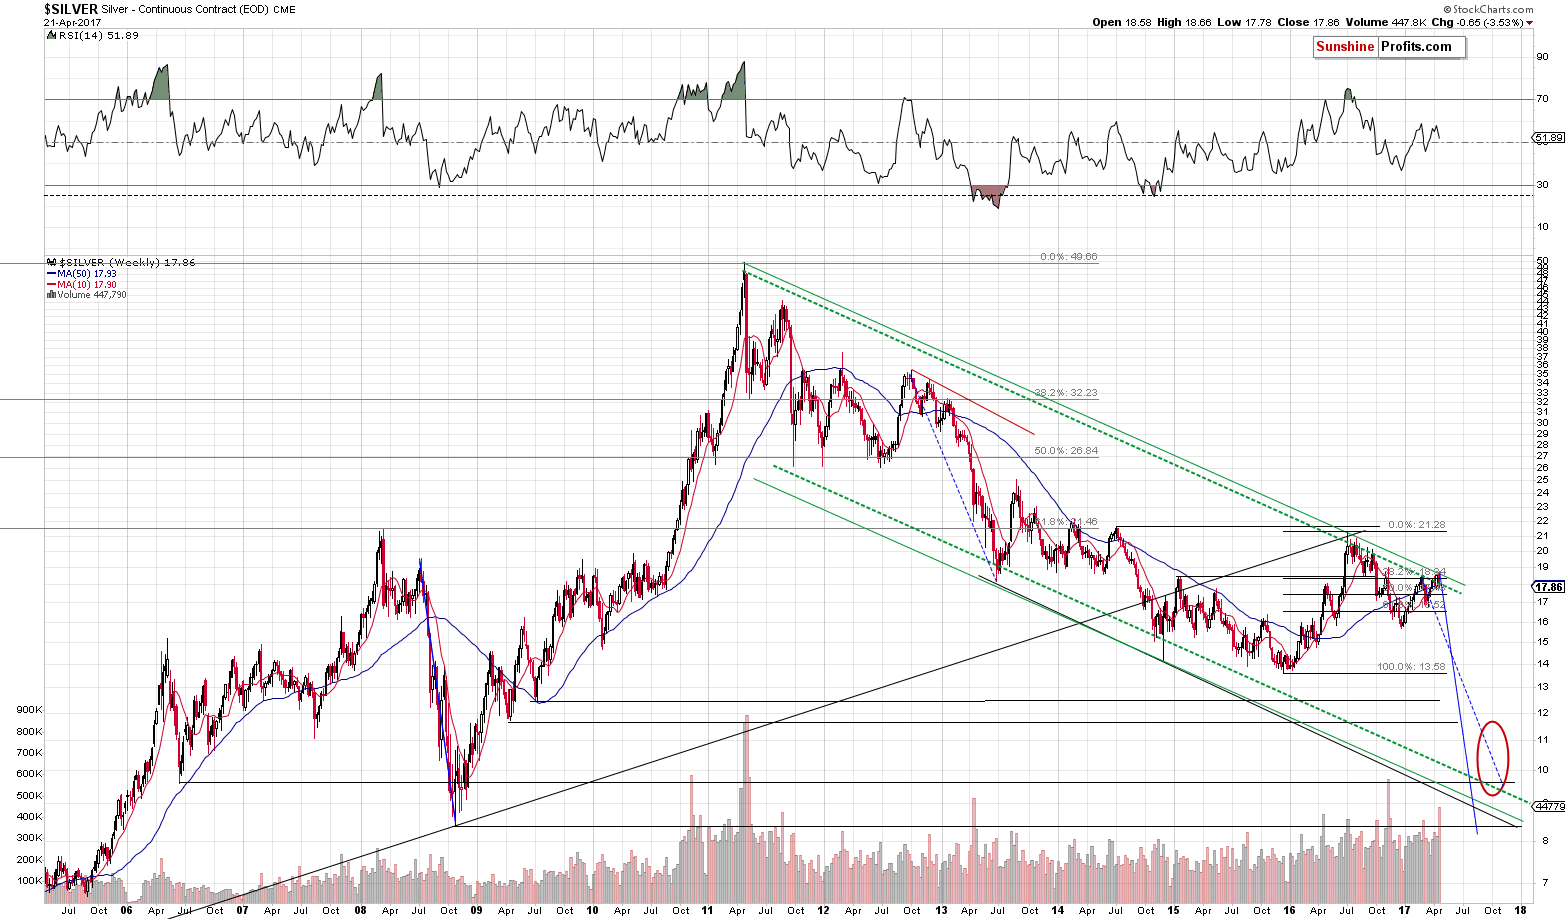
(…) Still, if gold was to move higher (to $1,310 or so), then the above chart provides us with an analogous upside target – the upper, long-term green line (based on the same major tops as the lower line, but drawn through intra-day tops). It’s currently at about $18.70 – just 10 cents above this week’s high. So, the upside is quite limited.
Silver has indeed moved lower after it reached the upper of the declining, long-term, green resistance lines. The lower one (based on weekly closes) is currently at about $18, so if silver manages to close the week below it (which seems likely), the previous breakout will be invalidated and it would likely trigger another powerful decline. For now, the fact that the upper resistance line held, continues to have bearish implications – the upside is very limited and the downside is huge.
It didn’t take long for silver to slide below $18 – it did so a few hours after we posted the above and it’s been trading below it since that time. At the moment of writing these words, silver is at $17.92, so the odds are that it will indeed close the week below $18.
The volume on which silver declined was significant as well, so the implications are definitely bearish.
Naturally, if silver’s signals are not confirmed by other markets, one shouldn’t rely on them, but this time they are. In addition to multiple factors that we discussed in the previous alerts, we would like to emphasize that the breakdown in mining stocks was not invalidated yesterday.
The invalidation of the breakdown is now a clear fact. It’s no longer bearish, somewhat bearish, or a bit bearish – it’s very bearish. It’s been confirmed by the weekly closing price, and since the support/resistance line is based on the same kind of prices, the invalidation of the breakout is meaningful and clearly bearish.
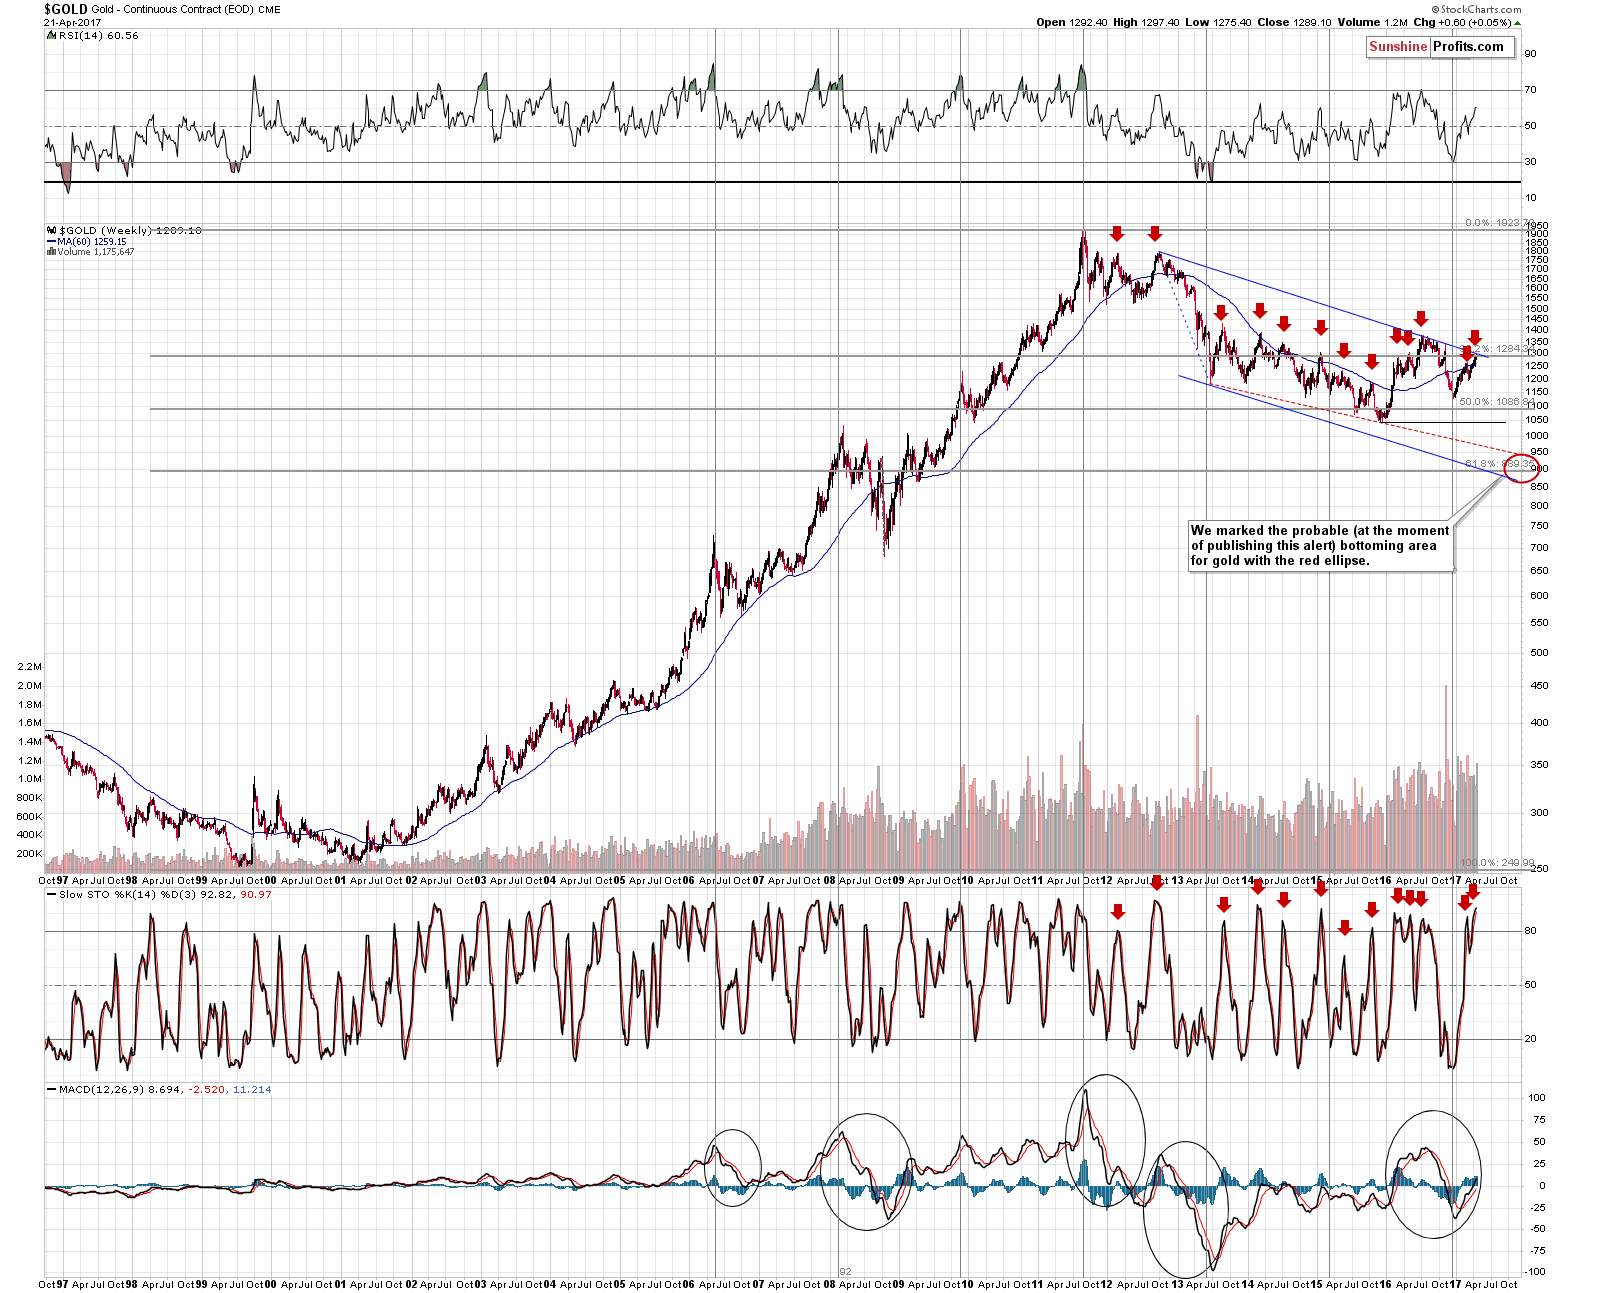
The long-term gold chart confirms the above bearish comments. The yellow metal moved to the declining long-term resistance line and then declined once again. There was no breakout, so the trend remains down.
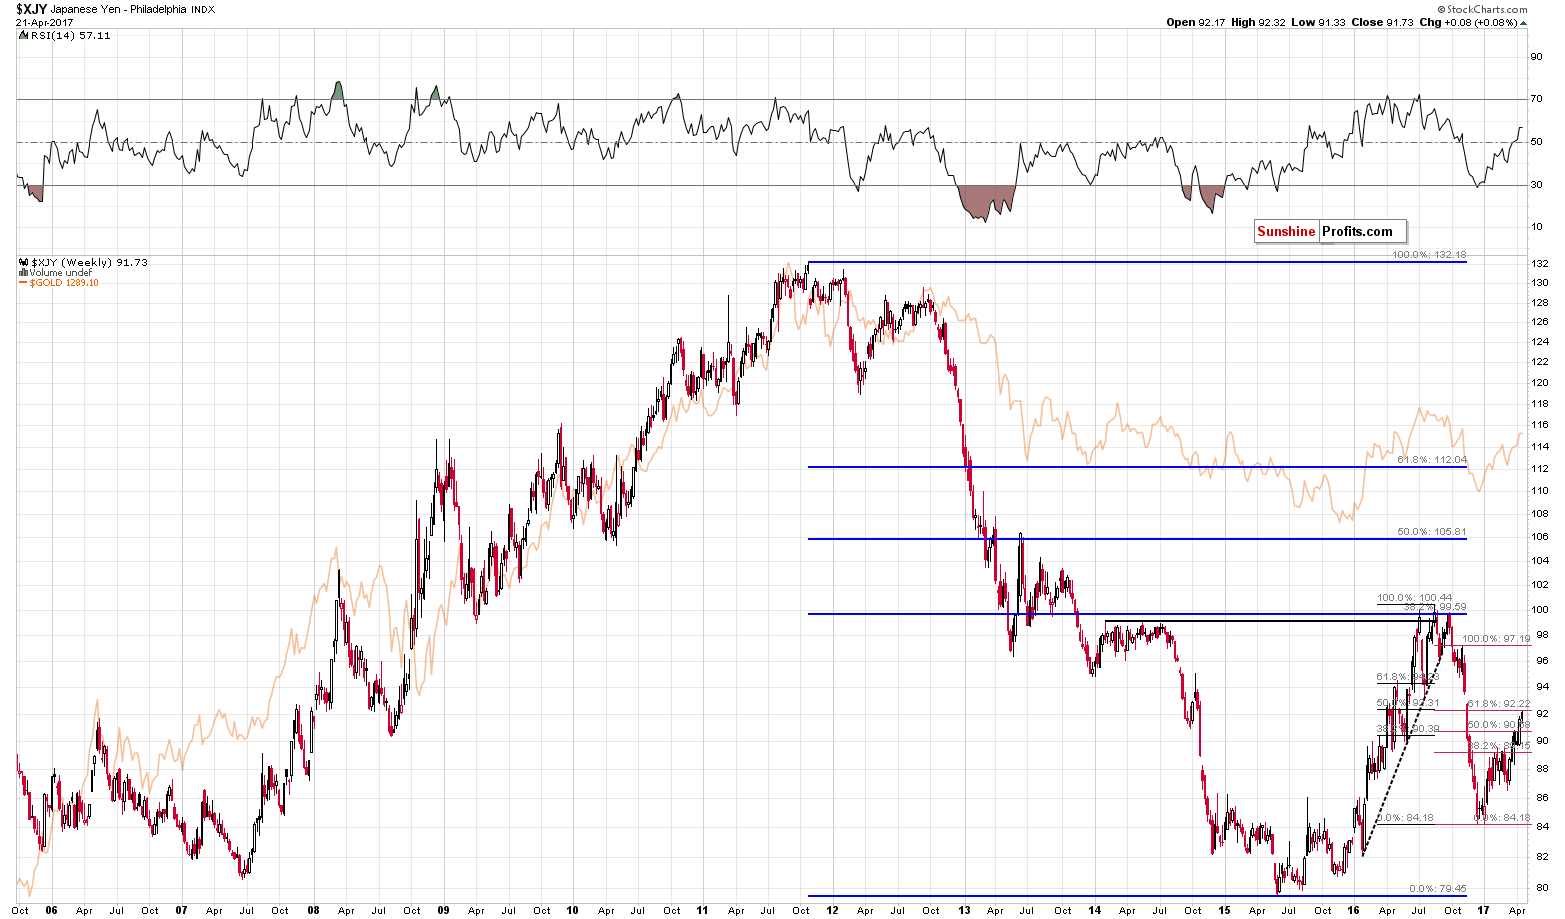
The Japanese yen which is closely linked to the price of gold, also moved to its critical resistance level (further supported by the zigzag corrective pattern) and thus it’s likely to have reversed its recent direction and decline in the coming days – and so is gold.
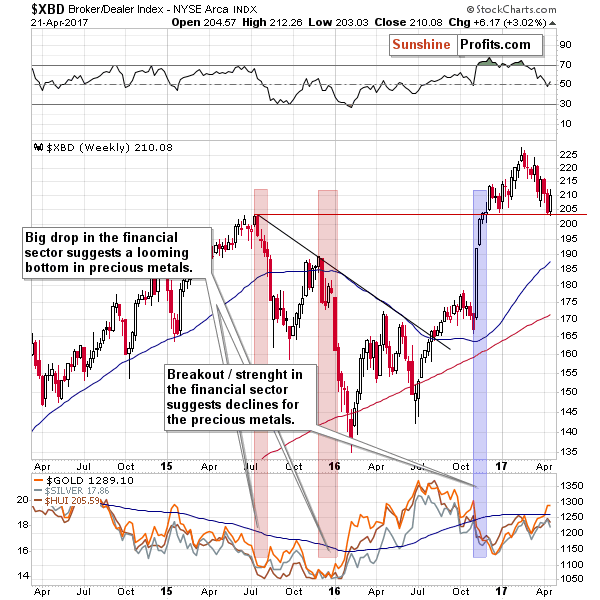
The financials were more clear as far as their signals are concerned. They too moved to an important level, but their bounce after reaching it was very visible. That’s a major medium-term development. This description is particularly important as the precious metals sector tends to react to major (!) moves in financial stocks (moving in the opposite way). Since the major move up is now (given the confirmation of the breakout above the 2015 high) likely for the financial stocks, a major move lower is likely for the precious metals sector.
Let’s take a look at the short-term mining stock chart that appears to be leading gold once again (miners moved ahead of gold in the past months).
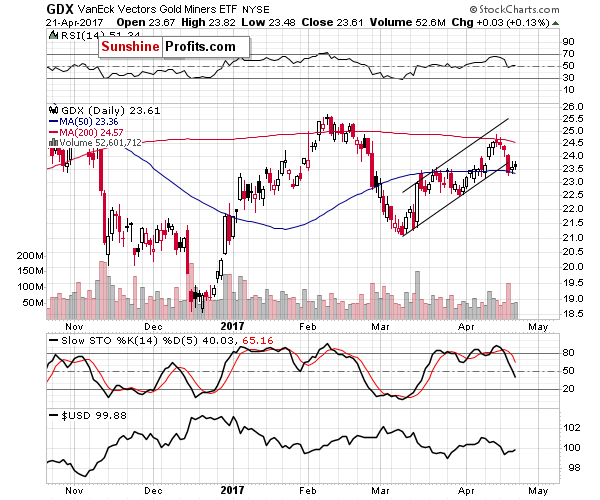
Gold and silver stocks confirmed the breakdown below the rising short-term support line by closing below it for 3 consecutive trading days, moving back to it without invaliding it and by closing the week below it. The volume on which Thursday’s and Friday’s upswing materialized was low, which also confirms that the move lower is the current true direction and the upswings should be treated as corrections.
Summing up, the precious metals market appears to be starting to decline even despite the lack of direct reasons to do so and that’s a particularly bearish situation. Precious metals had all the reasons to rally – tensions regarding North Korea, the unresolved situation regarding the U.S. airstrike in Syria and tensions before the elections in France… And it didn’t do anything substantial. Silver declined and miners have not only broken below the rising support line, but they also confirmed the aforementioned breakdown. This, plus other factors discussed previously support the expectation of lower precious metals prices in the coming weeks. Naturally, the above could change in the coming days and we’ll keep our subscribers informed, but that’s what appears likely based on the data that we have right now. If you enjoyed reading our analysis, we encourage you to subscribe to our daily Gold & Silver Trading Alerts.
Thank you.
Sincerely,
Przemyslaw Radomski, CFA
Founder, Editor-in-chief, Gold & Silver Fund Manager
Gold & Silver Trading Alerts
Forex Trading Alerts
Oil Investment Updates
Oil Trading Alerts


