Briefly:
Intraday trade: Our Friday’s intraday trading outlook was bearish. It proved partly wrong because the S&P 500 index lost 0.1% (neutral), following slightly lower opening of the trading session. The market remained within relatively narrow intraday trading range. We still can see technical overbought conditions along with negative divergences. Therefore, intraday short position is favored again. Stop-loss is at the level of 2,600 and potential profit target is at 2,555 (S&P 500 index).
Our intraday outlook is bearish today. Our short-term outlook is neutral, and our medium-term outlook is neutral:
Intraday outlook (next 24 hours): bearish
Short-term outlook (next 1-2 weeks): neutral
Medium-term outlook (next 1-3 months): neutral
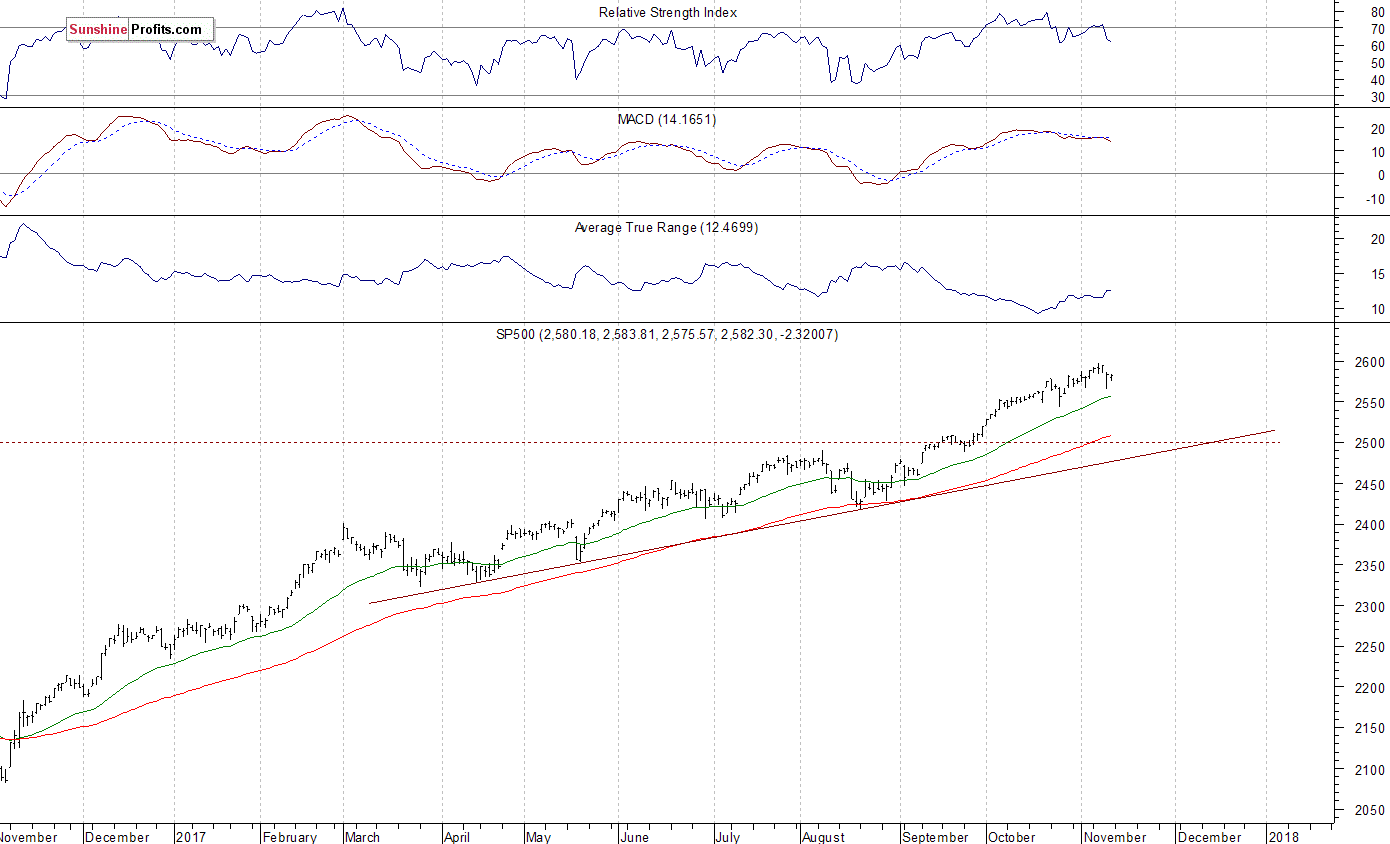
The main U.S. stock market indexes were mixed between -0.2% and 0.0% on Friday, as investors hesitated following Thursday’s volatility. The S&P 500 index retraced its week-long advance on Thursday, as it fell below the level of 2,570, before bouncing off support level. It currently trades around 0.6% below last week’s Tuesday’s new all-time high of 2,597.02. The Dow Jones Industrial Average lost 0.2% on Thursday, after falling the lowest since late October. The technology Nasdaq Composite was unchanged on Friday. The nearest important level of support of the S&P 500 index is now at 2,565-2,570, marked by Thursday’s local low. The next support level is at 2,545-2,560, marked by some previous local lows. On the other hand, the nearest important level of resistance is at 2,585-2,590, marked by recent fluctuations. The next resistance level is at around 2,600, marked by Tuesday’s record high of 2,597.02. The S&P 500 index fluctuates following its September-November rally. Is this a topping pattern or just pause before another leg up? There have been no confirmed negative signals so far. However, we still can see medium-term technical overbought conditions:

Slightly Negative Expectations
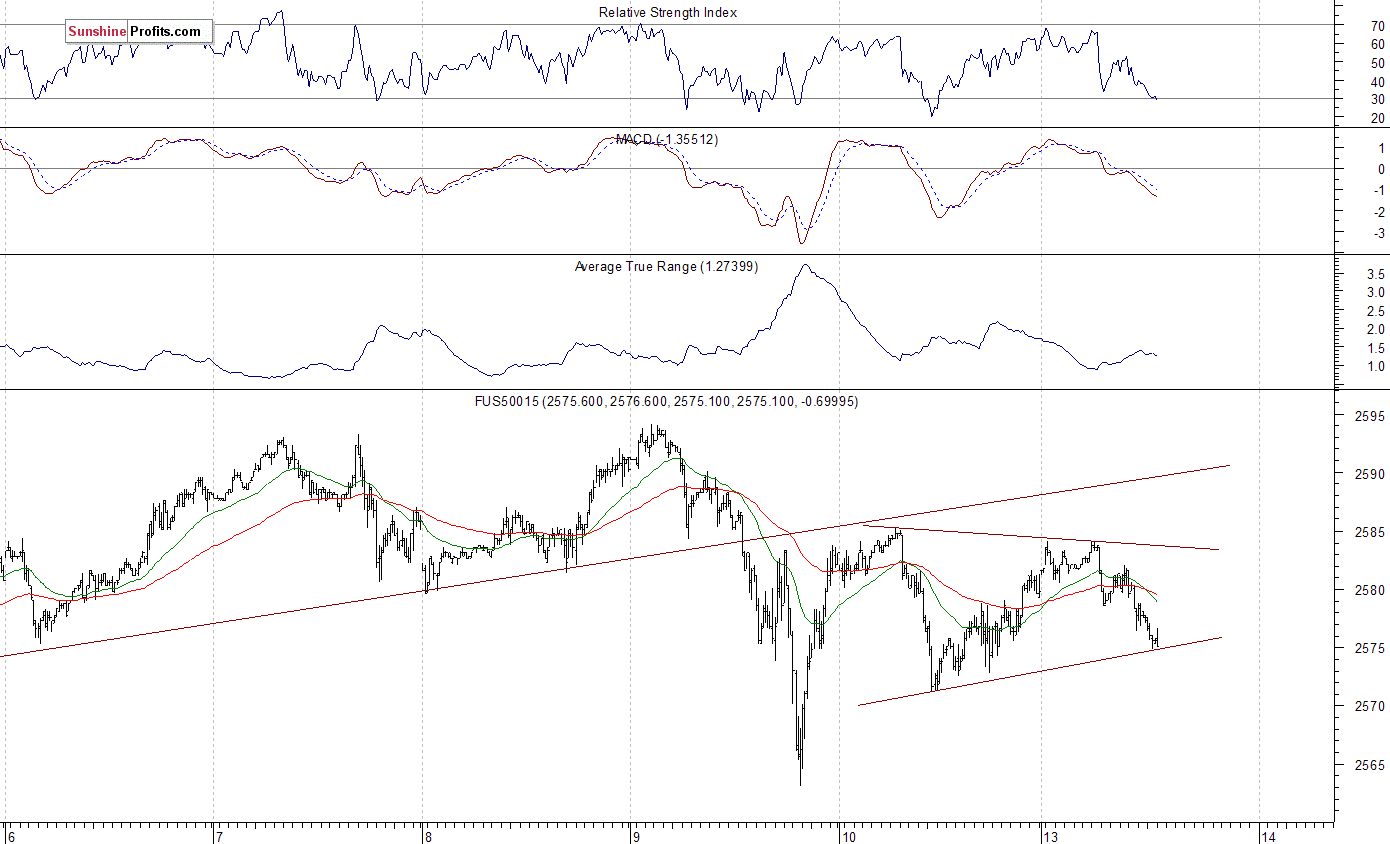
Expectations before the opening of today’s trading session are slightly negative, with index futures currently between -0.2% and -0.1% vs. their Friday’s closing prices. The European stock market indexes have been mixed so far. There will be no new important economic data announcements today. The S&P 500 futures contract trades within an intraday downtrend following overnight advance. The nearest important level of support is at around 2,565-2,570, marked by local lows. On the other hand, resistance level is at 2,585, among others. The futures contract trades below its recent upward trend line, as we can see on the 15-minute chart:
Nasdaq Relatively Stronger
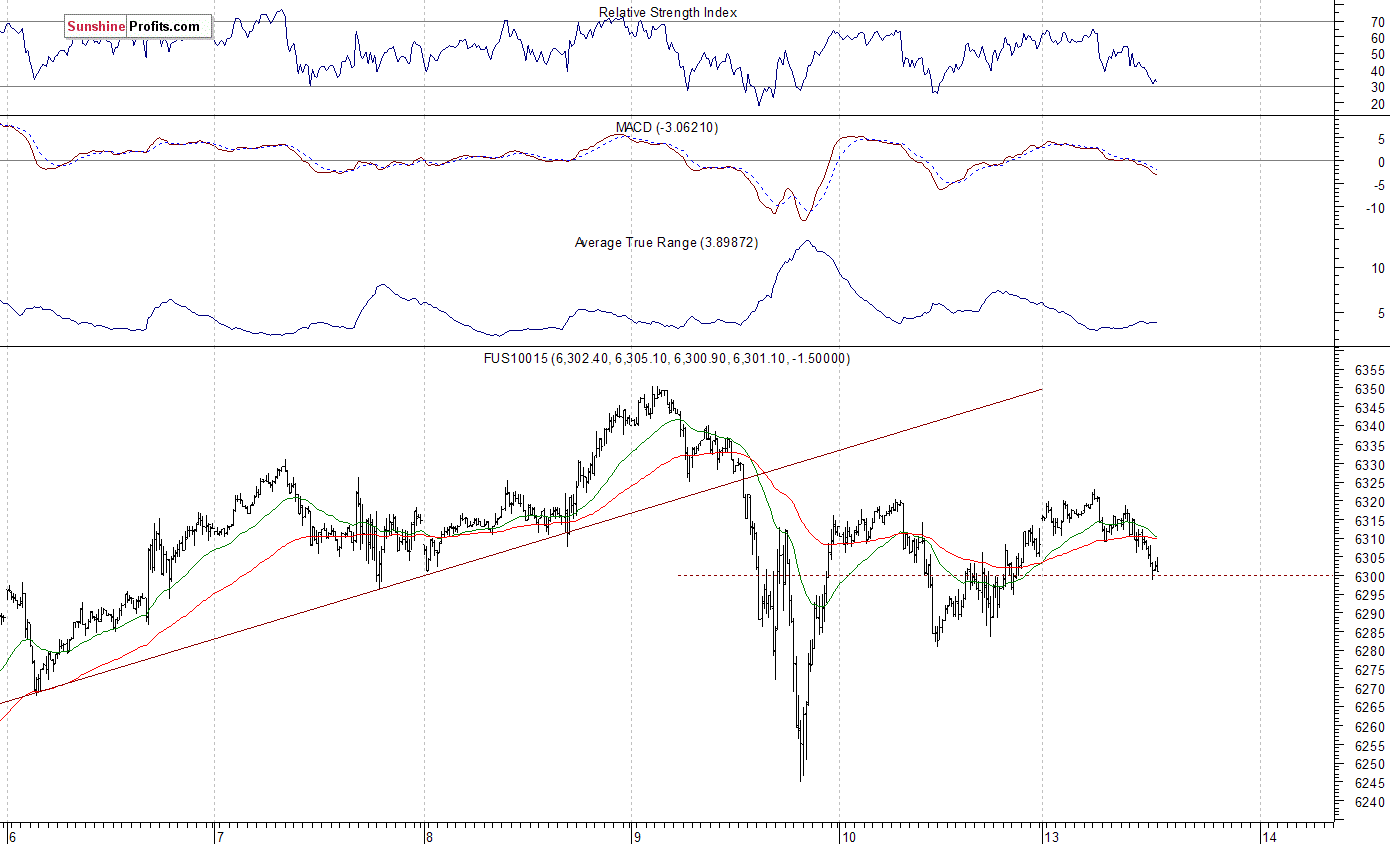
The technology Nasdaq 100 futures contract trades within an intraday consolidation, as it remains slightly above 6,300 mark. The nearest important level of support is at around 2,580, marked by Friday’s local low. The next level of support is at 2,540-2,560, marked by short-term local lows. On the other hand, resistance level is at around 6,330-6,350, marked by record high. The Nasdaq 100 futures contract trades along the level of 6,300, as the 15-minute chart shows:
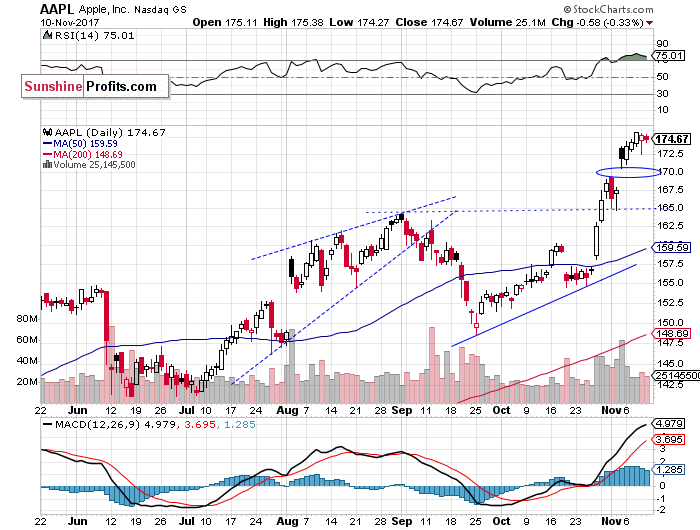
Let’s take a look at Apple, Inc. stock (AAPL) daily chart (chart courtesy of http://stockcharts.com) again. The price reached new record high on Wednesday, as it extended its uptrend following last week’s quarterly earnings release. Apple stock traded close to record high on Thursday and Friday, after retracing some of its recent rally. But will the uptrend continue despite some clear technical overbought conditions? We can say that something (i.e. individual asset, entire market, technical indicator) is overbought when its value rises so high that (according to the technical analysis) it’s unlikely to advance even further. Generally, an overbought market is a sign that a downward correction is likely to occur. Traders use indicators such as Relative Strength Index (RSI), Stochastic Oscillator, Money Flow Index to identify overbought conditions. For example, one can view a given market as “overbought” if the RSI indicator for this market is above 70.
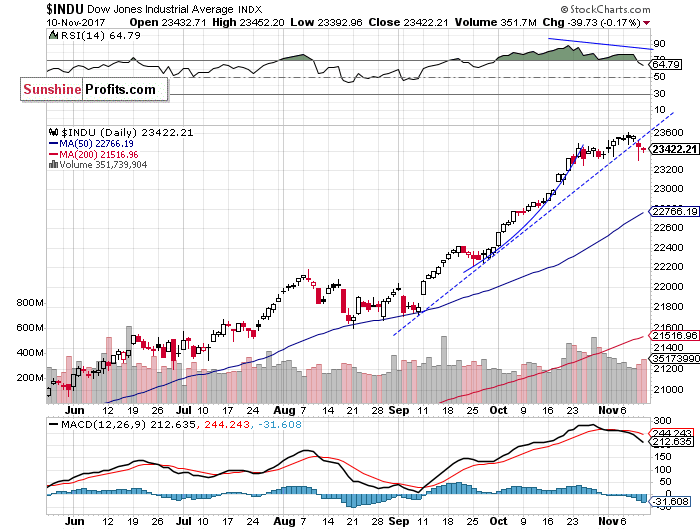
The Dow Jones Industrial Average daily chart (chart courtesy of http://stockcharts.com) shows that blue-chip index broke slightly below its two-month-long upward trend line on Thursday. Is this a downward reversal or just quick downward correction? We still can see some short-term negative technical divergences:
Concluding, the S&P 500 index remained virtually flat on Friday, as it fluctuated along Thursday’s session close. Is this a topping pattern or just consolidation within medium-term uptrend? There have been no confirmed negative signals so far. However, we still can see medium-term overbought conditions along with negative technical divergences. But will they lead to a downward correction?
If you enjoyed the above analysis and would like to receive free follow-ups, we encourage you to sign up for our daily newsletter – it’s free and if you don’t like it, you can unsubscribe with just 2 clicks. If you sign up today, you’ll also get 7 days of free access to our premium daily Gold & Silver Trading Alerts. Sign up today!.
Thank you.
Paul Rejczak
Stock Trading Strategist
Stock Trading Alerts


