Stocks in the Consumer Cyclicals sector have the most misleading earnings (as measured by economic earnings vs. GAAP net income) of any sector. In 2018, the GAAP net income for the 430 Consumer Cyclicals stocks under coverage grew 21% year-over-year. Meanwhile, economic earnings fell 12% over the same time.
Building on this analysis, we’ve identified which firms in the Consumer Cyclicals sector have misleading GAAP net income growth over the last twelve months now that 1Q19 results are in. Of the 440 Consumer Cyclicals stocks under coverage, 20% currently earn an Unattractive or Very Unattractive economic vs. reported EPS rating. One of these stocks stands out for its falling return on invested capital (ROIC) and overvalued stock price. Add in slowing revenue growth and declining guest traffic and Shake Shack (SHAK) is in the Danger Zone.
Reported Results Mislead Investors
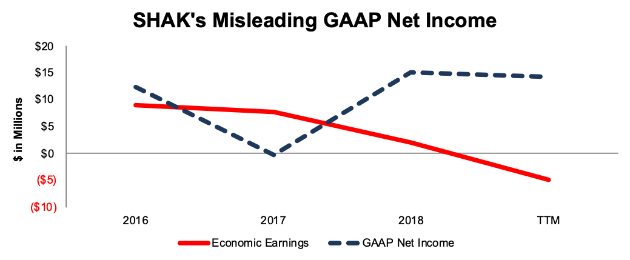
From 2016-TTM, SHAK’s GAAP net income improved from $12 million to $14 million. TTM GAAP net income is up over 13 times the prior TTM period. Meanwhile, over the same time, economic earnings, the true cash flows of the business, fell from $9 million to -$5 million, per Figure 1.
Figure 1: SHAK’s GAAP Net Income Hides Falling Economic Earnings

This disconnect between GAAP net income and economic earnings is largely attributed to a ballooning balance sheet. From 2016-2018, SHAK’s invested capital grew 28% compounded annually, or nearly twice as fast as after-tax operating profit (NOPAT). Off-balance sheet operating leases have grown from $175 million in 2016 to $258 million TTM, or 14% compounded annually. The expansion of the balance sheet, when combined with a rising weighted average cost of capital(7.6% TTM, up from 6.1% in 2016), increases the capital charge and decreases economic earnings.
Non-GAAP Metrics Further Mislead Investors
SHAK would rather investors focus on non-GAAP metrics such as “shack-level operating profit” and adjusted EBITDA. By focusing on such flawed metrics, management ignores real costs of doing business and gives investors an incomplete picture of the company’s financials.
Worse yet, management is aware of the shortcomings of adjusted EBITDA, and notes in its press release accompanying its 1Q19 earnings results,
“EBITDA and Adjusted EBITDA exclude certain normal recurring expenses. Therefore, these measures may not provide a complete understanding of the Company’s performance.”
The largest item SHAK removes to calculate adjusted EBITDA (apart from interest, depreciation, and amortization) is equity-based compensation. In 2018 SHAK removed $6.1 million (8% of adjusted EBITDA) in equity-based compensation.
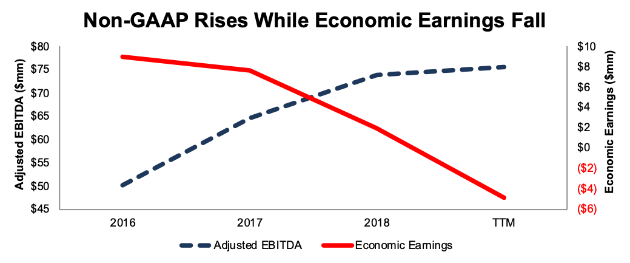
Per Figure 2 SHAK’s adjusted EBITDA has improved from $50 million in 2016 to $75 million TTM while economic earnings have fallen from $9 million to -$5 million.
Figure 2: SHAK’s Adjusted EBITDA Is Misleading
SHAK’s Profitability Lags in a Competitive Business
SHAK faces significant competition and has yet to prove it can create shareholder value in the competitive restaurant industry.
Since 2016, SHAK’s NOPAT margins have fallen from 10% to 6% TTM. Over the same time, the market cap weighted average of the peers listed in SHAK’s proxy statement, which include companies such as Chipotle Mexican Grill (CMG), El Pollo Loco Holdings (LOCO), Red Robin Gourmet Burgers (RRGB), Wingstop (WING), Zoe’s Kitchen (ZOES) and more, has improved from 10% to 11%.
Figure 3: SHAK’s NOPAT Margin Vs. Peers
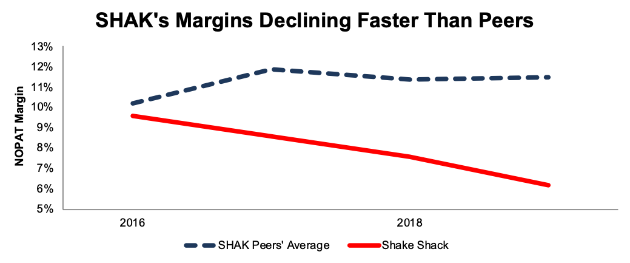
SHAK’s current NOPAT margin (6%) also ranks below the average (10%) of the 37 restaurant and bar firms under coverage. The market-weighted average of those 37 firms is even higher, at 21%.
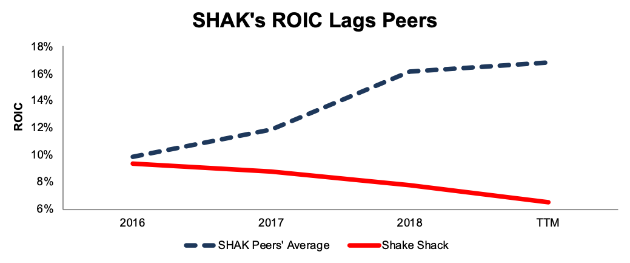
The combination of margin contraction and a growing capital base drives SHAK’s already low ROIC even farther below competitors. Per Figure 4, SHAK and its peers earned a similar ROIC in 2016, and have completely diverged since. In the TTM period, the market cap weighted peer average ROIC stands at 17%, compared to SHAK’s ROIC of 6%.
Figure 4: SHAK’s ROIC Vs. Peers
Bulls may argue that SHAK’s ROIC is artificially deflated because its balance sheet represents investment in future (or recent) store openings that aren’t generating meaningful profits yet. Shake Shack itself only includes stores that have been open for 24 months or longer when calculating its same-shack sales (SHAK’s term for same-store sales). Using this methodology, we can assume invested capitalfrom two years ago theoretically captures the capital that supports the stores that are in same-shack sales.
SHAK earned $35 million in NOPAT in 2018, while its invested capital in 2016 was $308 million, which gives the company an ROIC of 11%, well below its peer group average of 17%.
Bulls Ignore Shack’s Slowing Growth, Rising Costs, and Reliance on Price Increases
Despite the deterioration in fundamentals noted above, bulls will argue that Shake Shack’s growing store base can drive future shareholder value. However, this argument overlooks the deceleration in growth and success from new stores.
Long-Term Decline in Guest Traffic: restaurants grow sales in two ways, (1) increase traffic or (2) increase prices. For Shake Shack, a “growth story”, one would expect traffic to be rising across its locations. However, Shake Shack’s guest traffic has declined YoY in 10 of the past 11 quarters.
Prices are responsible for all of the same-shack sales growth. Price increases may work in a growing economy and for a popular new restaurant concept. Should the economy weaken, price increases may drive consumers away and traffic even lower.
Guidance for the rest of 2019 suggests that Shake Shack’s positive guest traffic in 1Q19 was just a blip too. Management expects same-shack sales to grow 1%-2% in 2019. This estimate includes a 1.5% price increase. Should same-shack sales come in at the low end of expectations, it would mean that, once again, all the growth in the existing business was driven by a price increase, not growing demand.
Revenue Growth Is Less than New Store Growth: SHAK’s revenue growth rate has fallen YoY in each of the past three years. In 2017 and 2018, the revenue growth rate is below the growth in number of stores. See Figure 5.
Figure 5: SHAK’s Store Openings Drive Less & Less Revenue
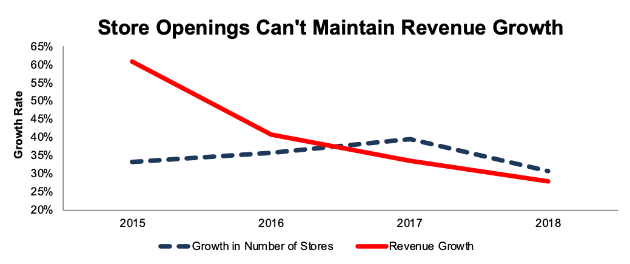
Clearly, the “growth” story is in jeopardy if SHAK’s new stores continue to generate less sales than previous new stores.
The average unit volume (AUV), which represents the average annualized sales of domestic company-operated stores, has fallen from $5 million per store in 2016 to $4.4 million in 2018, per Figure 6. Management expects AUV for company operated stores to fall to $4.0-$4.1 million in 2019. Note that management’s AUV statistics adjust for stores[1] not open during the entire measurement period.
Figure 6: Average Unit Volume Declines as SHAK Opens More Stores

Sources: New Constructs, LLC and company filings.
Cost Structure Undercuts Revenue Growth: making the situation more troubling, SHAK’s operating expenses have grown from 69% of revenue in 2016 to 72% of revenue in 2018. Both operating expenses and general and administrative expenses have grown faster than revenue on a compounded annual basis over the past three years. SHAK is not achieving the economies of scale one would expect from a “growth” business.
SHAK Is Significantly Overvalued
Numerous case studies show that getting ROIC right is an important part of making smart investments. This paper compares our analytics on a mega cap company to other major providers. The Appendix details exactly how we stack up. The technology that enables this research is featured by Harvard Business School.
Per Figure 7, ROIC explains 90% of the difference in valuation for the 37 bar & restaurant firms under coverage. SHAK trades at a premium to peers as shown by its position above the trend line.
Figure 7: ROIC Explains 90% of Valuation for Bar & Restaurant Firms
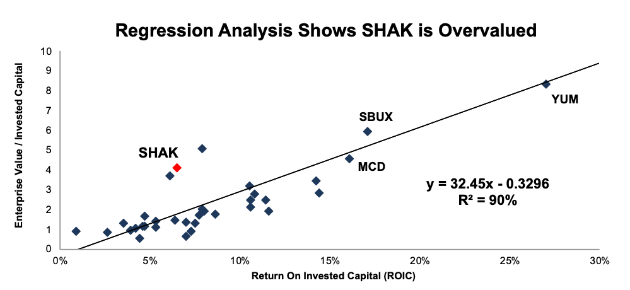
If the stock were to trade at parity with its peers, it would be worth $21/share – 72% below the current stock price. With SHAK’s profitability and growth trending downward, it’s hard to argue it deserves any premium valuation compared to peers.
Below we’ll use our reverse DCF model to quantify the future cash flow expectations baked into the current stock price.
Reverse DCF Model Reveals SHAK is Priced for Perfection
Given the issues above, one would expect SHAK to have significantly underperformed the market instead of rising 35% year-to-date (S&P up 13%). This rise in SHAK has left shares significantly overvalued.
To justify its current price of $74/share, SHAK must maintain 6% NOPAT margins (after declining in 2017, 2018, and TTM) and grow NOPAT by 17% compounded annually for the next 12 years. See the math behind this dynamic DCF scenario.
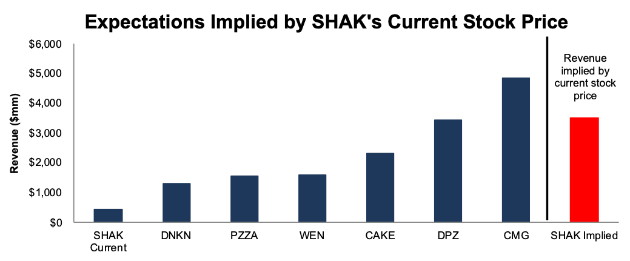
In this scenario, SHAK would be generating $3.5 billion in revenue (12 years from now), which is slightly greater than Domino’s Pizza (DPZ) and more than double The Wendy’s Company (WEN) 2018 revenue. Figure 8 compares SHAK’s current revenue and peak revenue, as implied by its current stock price, to numerous restaurant and fast food competitors.
Figure 8: SHAK’s Current Valuation Implies Highly Optimistic Revenue Growth
Even if SHAK can maintain margins and grow NOPAT by 12% compounded annually for the next decade, the stock is worth just $33/share today – a 55% downside. See the math behind this dynamic DCF scenario.
Each of these scenarios also assumes SHAK is able to grow revenue, NOPAT and FCF without increasing working capital or fixed assets. This assumption is unlikely given Shake Shack’s plans to expand its store location count but allows us to create best-case scenarios that demonstrate how high expectations embedded in the current valuation are. For reference, SHAK’s invested capital has grown on average $93 million (20% of 2018 revenue) each year over the past three years.
Acquisition Is Unlikely
Often the largest risk to any bear thesis is what we call “stupid money risk”, which means an acquirer comes in and pays for SHAK at the current, or higher, share price despite the stock being overvalued. Given the competitiveness in the industry, we think it would be unwise for a larger firm to acquire Shake Shack, when it would be easier to simply replicate the stores using existing suppliers, distribution networks, and industry expertise.
However, we think it helps to quantify what, if any, acquisition hopes are priced into the stock.
Walking Through the Acquisition Math
First, investors need to know that Shake Shack has large (hidden) liabilities that make it more expensive than the accounting numbers would initially suggest.
- $258 million in operating leases (15% of market cap)
- $49 million in minority interests (3% of market cap)
- $39 million in outstanding employee stock options (2% of market cap)
After adjusting for these liabilities, we can model multiple purchase price scenarios.
Even in the most optimistic of scenarios, SHAK is worth no more than its current share price. For this analysis, let’s assume McDonalds, with its existing footprint in the burger industry, wishes to acquire SHAK. We think MCD would be much more likely to develop a Shake Shack style competitor from within, (a la Chipotle), but regardless, this scenario allows us to model any acquisition premium baked into the stock price.
Figures 9 and 10 show what we think MCD should pay for SHAK to ensure it does not destroy shareholder value. There are limits on how much MCD would pay for SHAK to earn a proper return, given the NOPAT or free cash flows being acquired.
Each implied price is based on a ‘goal ROIC’ assuming different levels of revenue growth. In both scenarios, the estimated revenue growth rate is 27% in year one and 24% in year two, which are the consensus estimates for SHAK’s revenue growth. For the subsequent years, we use 24% in scenario one because it represents a continuation of consensus estimates. We use 30% in scenario two because it assumes SHAK could expand faster with the large support and resources of McDonalds.
We conservatively assume that MCD can grow SHAK’s revenue and NOPAT without spending anything on working capital or fixed assets beyond the original purchase price. We also assume SHAK stops its margin decline and achieves a 6% NOPAT margin.
Figure 9: Implied Acquisition Prices for MCD to Achieve 5% ROIC
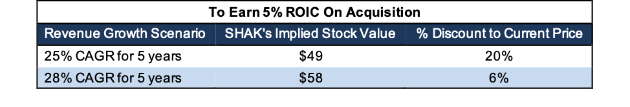
Figure 9 shows the ‘goal ROIC’ for MCD as its WACC or 5%. Even if SHAK can grow revenue by 28% compounded annually for the next five years, the firm is worth less than its current price of $74/share. It’s worth noting that any deal that only achieves a 5% ROIC would only be value neutral and not accretive, as the return on the deal would equal MCD’s WACC.
Figure 10: Implied Acquisition Prices for MCD to Achieve 16% ROIC
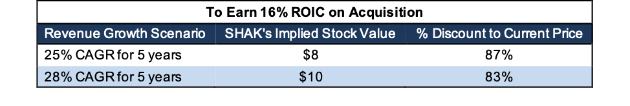
Figure 10 shows the next ‘goal ROIC’ of 16%, which is MCD’s current ROIC. Acquisitions completed at these prices would be truly accretive to MCD shareholders. Even in the best-case growth scenario, the implied stock value is significantly less than the current price. Any scenario assuming less than 28% compound annual growth in revenue would result in further capital destruction for MCD.
Multiple Catalysts Could Sink Shares
Missed Earnings: SHAK has met or beaten EPS expectations in each quarterly report since its first post-IPO earnings report in March 2015. As price increases drag on into their fourth year, the decline in AUV could continue or accelerate and blow up SHAK’s “growth” story. After years of beats, even the slightest miss on earnings could push investors to sell as they’re forced to face reality of SHAK’s deteriorating fundamentals.
Slowdown in Store Openings: investment in Shake Shack is predicated on the idea that the company is growing rapidly and taking market share in the restaurant industry.Should the global economy slowdown, consumers may take their dollars elsewhere, or cut discretionary eating-out altogether. An economic slowdown would likely put a limit on the number of stores Shake Shack would open moving forward, and put an end to the “growth” story. Without the growth of new stores, it seems unlikely Shake Shack could justify the expectations baked into its stock price. This realization by investors would also send shares lower.
What Noise Traders Miss With SHAK
In general, markets aren’t good at identifying value destroying companies that waste shareholder capital. Instead, due to the proliferation of noise traders, markets are great at amplifying volatility, and therefore risk, in popular momentum stocks, while high-quality unconflicted & comprehensive fundamental research is overlooked. Here’s a quick summary for what noise traders miss when analyzing SHAK:
- New stores are generating less revenue than they have in the past (average unit volume has fallen in each of the past two years).
- Economic earnings declining despite improving GAAP results.
- Revenue growth through store openings and price increases, not increased demand.
- Stock price that is significantly overvalued compared to peers.
- Valuation that implies significant reverse in margins and market share gains.
Executive Compensation Adds More Risk
Part of the reason SHAK’s executives can ignore the ongoing problems is their compensation is tied to adjusted EBITDA, a flawed and easily manipulated metric. Adjusted EBITDA, as noted above, allows SHAK to exclude real costs such as depreciation, amortization, and equity-based compensation.
By excluding these real costs, SHAK maintains the illusion of profitability. In 2018, 40% of SHAK’s executives’ annual cash incentive was tied to adjusted EBITDA while 40% and 20% was tied to total revenue and individual performance respectively. 50% of long-term incentives were tied to adjusted EBITDA as well.
As long as SHAK continues to use this flawed metric, its executives will be incentivized to boost their growth numbers with no accountability to real shareholder value creation. Instead of incentivizing executives with adjusted EBITDA and revenue goals, we’d prefer ROIC improvement, which is directly correlated with creating shareholder value.
Shake Shack Offers No Shareholder Yield
Shake Shack does not currently pay a cash dividend nor have a buyback program in place. As such, the stock offers none of the downside protection that a solid shareholder yield can provide. Given the level of risk we see in the valuation and forward expectations, this downside protection could be sorely missed.
Insiders are Selling and Short Interest is High
Over the past 12 months, 3.2 million insider shares have been purchased and 4.3 million have been sold for a net effect of 1.1 million insider shares sold. These sales make up 4% of shares outstanding.
Short interest is currently 4.7 million shares, which equates to 16% of shares outstanding and just over 6 days to cover. Short interest is down 4% from the prior month despite the firm’s fundamentals deteriorating and the stock getting more overvalued.
Critical Details Found in Financial Filings by Our Robo-Analyst Technology
As investors focus more on fundamental research, research automation technology is needed to analyze all the critical financial details in financial filings. Below are specifics on the adjustments we make based on Robo-Analyst findings in Shake Shack’s 2018 10-K:
Income Statement: we made $34 million of adjustments with a net effect of removing $20 million in non-operating expense (4% of revenue). We removed $27 million related to non-operating expenses and $7 million related to non-operating income. You can see all the adjustments made to SHAK’s income statement here.
Balance Sheet: we made $622 million of adjustments to calculate invested capital with a net decrease of $104 million. The most notable adjustment was $258 million (47% of reported net assets) in off-balance sheet operating leases. You can see all the adjustments made to SHAK’s balance sheet here.
Valuation: we made $400 million of adjustments with a net effect of decreasing shareholder value by $290 million. Apart from the operating leases noted above, the largest adjustment was $55 million in excess cash. This cash adjustment represents 3% of SHAK’s market value. See all adjustments to SHAK’s valuation here.
Unattractive Funds That Hold SHAK
The following funds receive our Unattractive rating and allocate significantly to Shake Shack.
- Delaware Group Small Mid Cap Growth Fund (DFCIX) – 4.5% allocation and Very Unattractive rating
- Virtus Zevenbergen Innovative Growth Stock (SCATX) – 2.1% allocation and Very Unattractive rating
- Rational Dynamic Brands Fund (HSUAX) – 2.1% allocation and Very Unattractive rating
- Zevenbergen Growth Fund (ZVNBX) – 2.1% allocation and Very Unattractive rating
This article originally published on June 10, 2019.
Disclosure: David Trainer, Sam McBride and Kyle Guske II receive no compensation to write about any specific stock, sector, style, or theme.
[1] Taken from SHAK’s Fiscal Year Ended 2018 Financial Results press release


