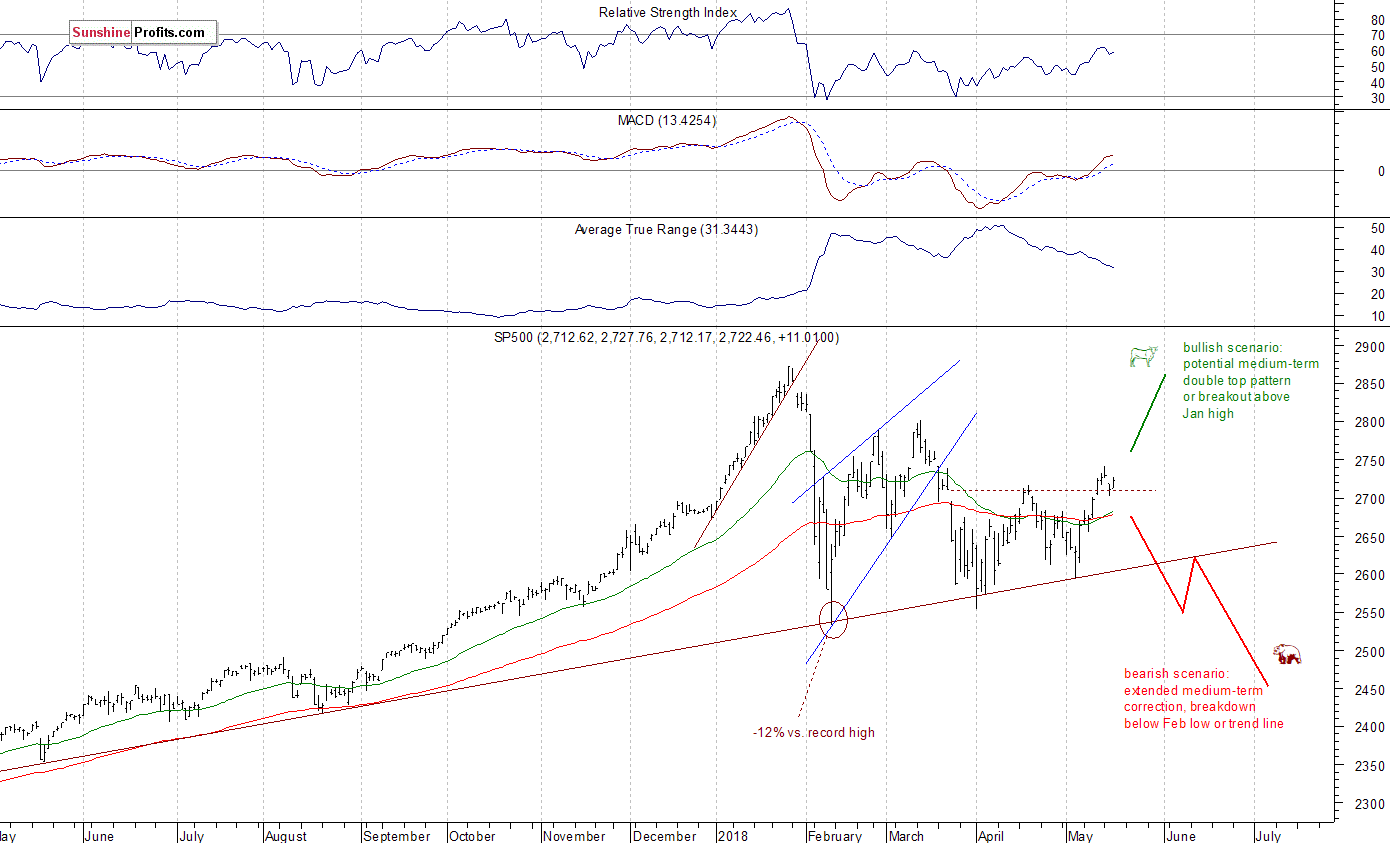
The U.S. stock market indexes gained 0.3-0.6% on Wednesday, retracing some of their Tuesday’s move down, as investors’ sentiment slightly improved despite rising bond yield. The S&P 500 index bounced off 2,700 mark and it extended its short-term consolidation. It currently trades 5.3% below January 26 record high of 2,872.87. The Dow Jones Industrial Average gained 0.3% and the technology Nasdaq Composite gained 0.6% yesterday.
The nearest important level of resistance of the S&P 500 index is at around 2,720-2,725, marked by Tuesday’s daily gap down of 2,718.59-2,725.47, among others. The next resistance level remains at 2,740-2,750, marked by mid-March local high. On the other hand, support level is at around 2,700-2,710, marked by last Thursday’s daily gap up of 2,701.27-2,704.54 and yesterday’s daily low. The support level is also at 2,680-2,685, marked by previous resistance level.
The broad stock market extended its short-term uptrend recently, as the S&P 500 index broke above the level of 2,700 again. Stocks lost some ground on Tuesday, but it didn’t look like a new downtrend. So, will the run-up continue towards 2,800? There are still two possible medium-term scenarios – bearish that will lead us below February low following trend line breakdown, and the bullish one in a form of medium-term double top pattern or breakout towards 3,000 mark. There is also a chance that the market will just go sideways for some time, and that would be positive for bulls in the long run (some kind of an extended flat correction):

Mixed Expectations – Correction or New Downtrend?
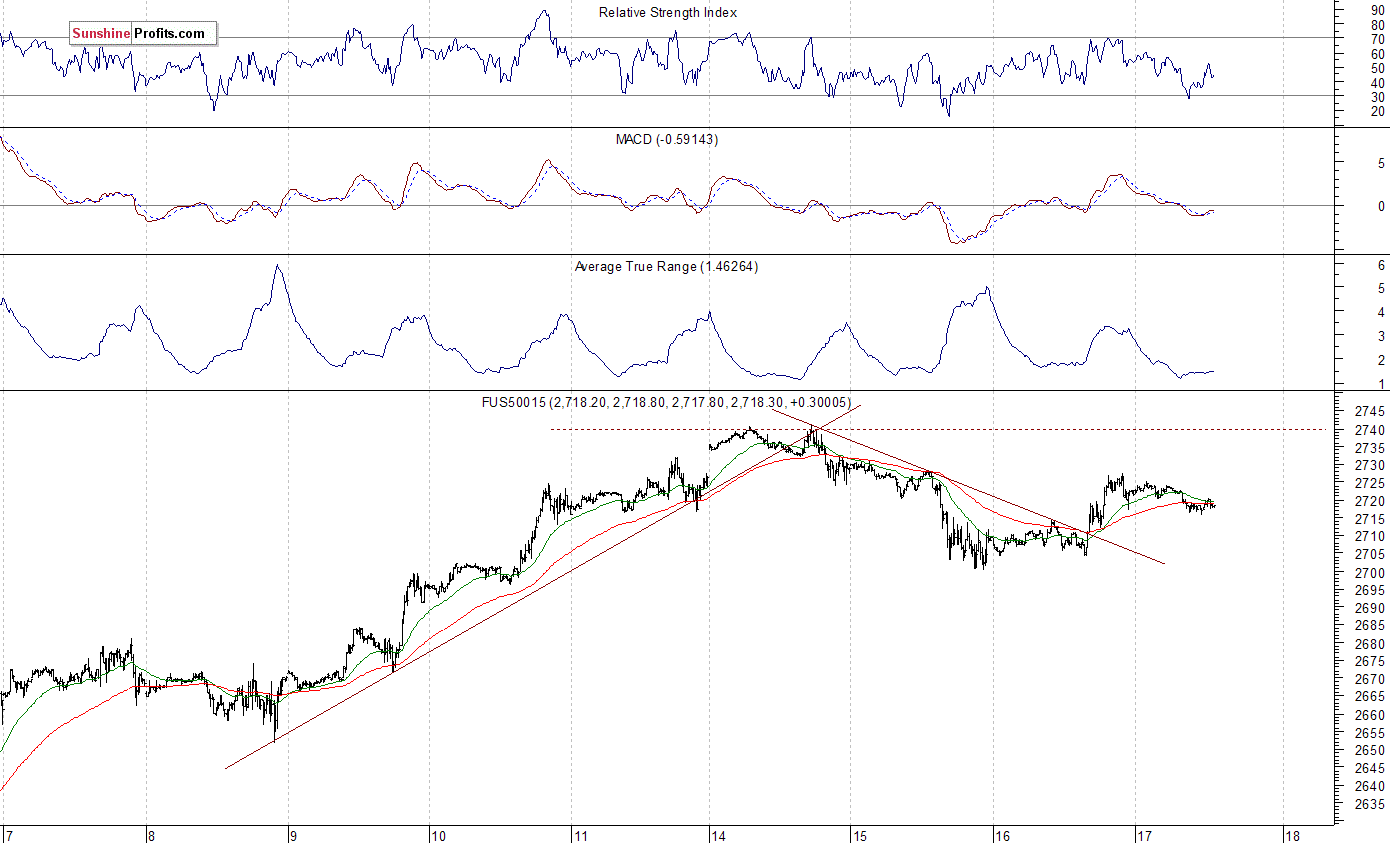
The index futures contracts trade between -0.1% and -0.4% vs. their Wednesday’s closing prices right now. So, expectations before the opening of today’s trading session are slightly negative. The European stock market indexes have gained 0.2-0.3% so far. Investors will wait for some economic data announcements: Philadelphia Fed, Initial Claims at 8:30 a.m., Leading Indicators at 10:00 a.m. The broad stock market may extend its short-term fluctuations today. The S&P 500 index bounced off support level of around 2,700, so it is still just consolidation following the early May run-up. There have been no confirmed negative signals so far.
The S&P 500 futures contract trades within an intraday consolidation following overnight move down. The nearest important level of support is at around 2,715, marked by local low. The next support level is at 2,700-2,705. On the other hand, short-term resistance level is at 2,720-2,725. The futures contract continues to trade sideways, slightly below its recent local highs, as the 15-minute chart shows:
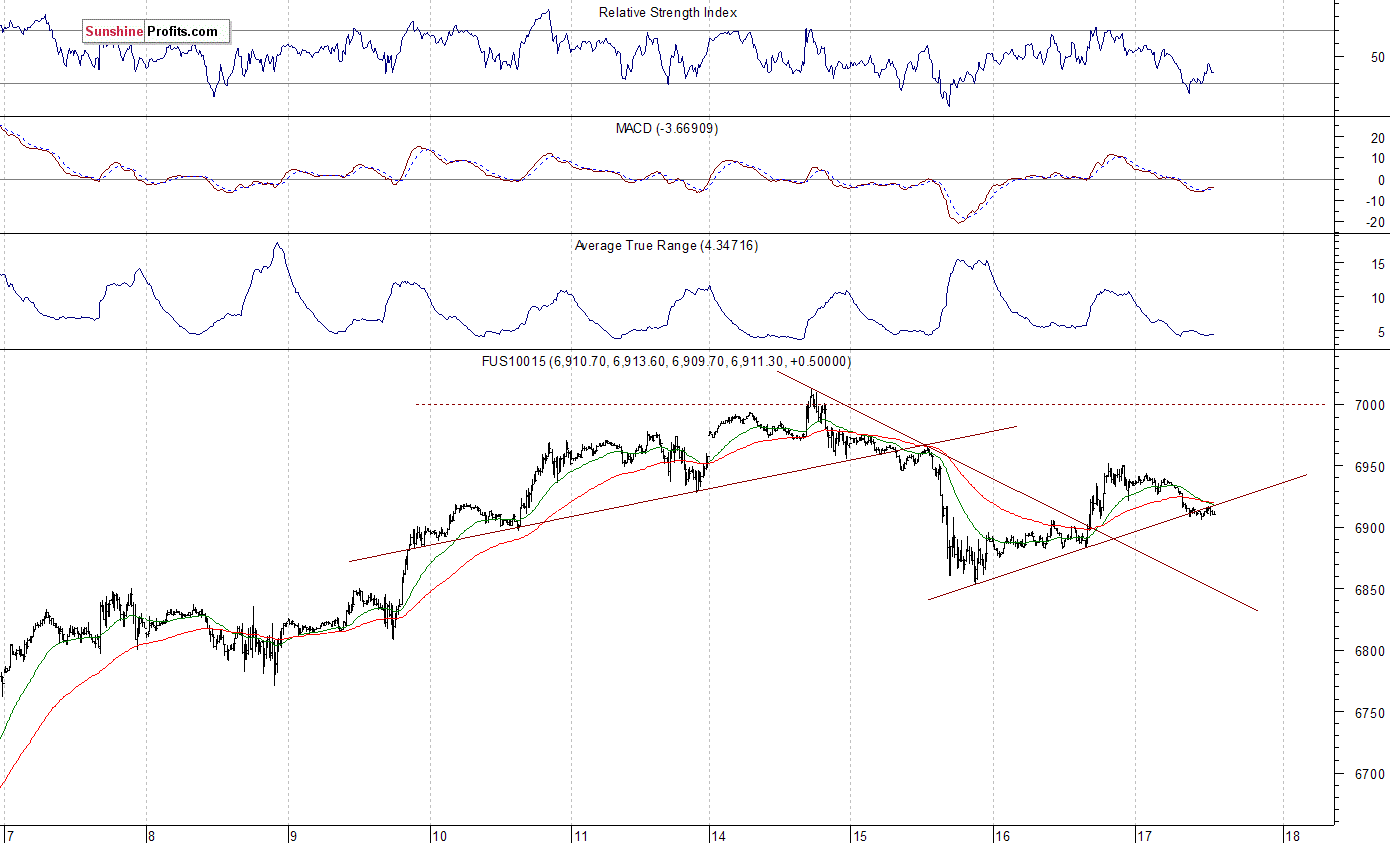
Nasdaq Close to 6,900 Mark
The technology Nasdaq 100 futures contract follows a similar path, as it fluctuates after an overnight decline. The market fluctuates after bouncing off 7,000 mark on Monday. It retraced some of its recent run-up on Tuesday, but it got back above the level of 6,900 yesterday. Is this just a downward correction or some topping pattern ahead of downward reversal? It’s hard to say. However, tech stocks remain relatively close to their all-time highs. The nearest important support level of the Nasdaq 100 futures contract is at around 6,900, and the next support level is at 6,850, marked by local low. On the other hand, resistance level is at 6,930-6,950, among others. The Nasdaq futures contract extends its short-term consolidation, as we can see on the 15-minute chart:
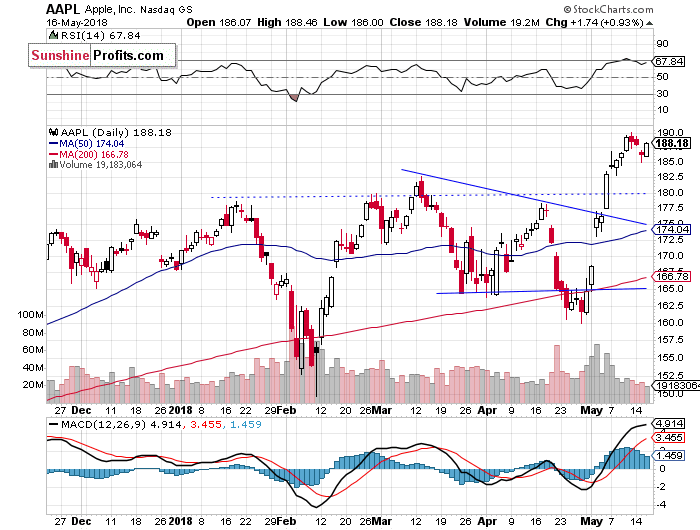
Big Cap Tech Stocks Remain Close to Record Highs
Let’s take a look at Apple, Inc. stock (AAPL) daily chart (chart courtesy of http://stockcharts.com). It reached new record high on Friday, as it extended its short-term uptrend. Then the price bounced off resistance level of around $190-200. It came back higher yesterday, as it got close to record high again. We may see some more short-term uncertainty here:
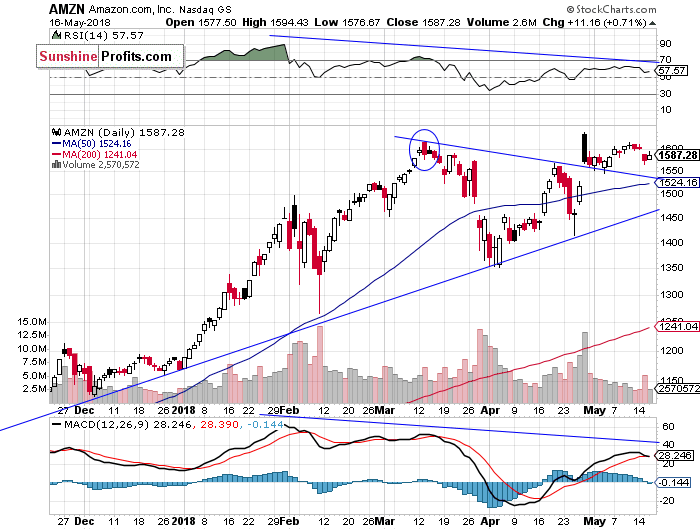
Now let’s take a look at Amazon.com, Inc. stock (AMZN) daily chart. The price reached new record high in the late April, as investors reacted to better-than-expected quarterly earnings release. Then, on the same trading day it sold off below $1,600. Was this a downward reversal or just correction following breakout higher? The recent price action looked pretty bullish, as price got back to the all-time high level. However, the stock retraced some of its recent advance on Tuesday. We may see some more short-term uncertainty following late April rally:
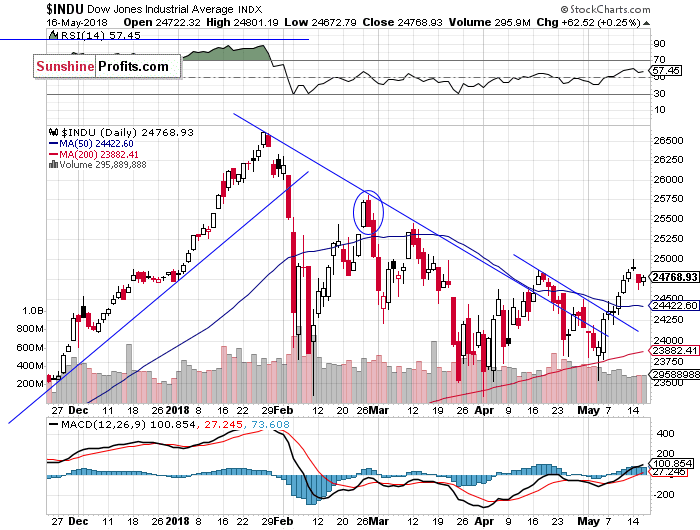
Dow Jones Still Close to 25,000 Mark
The Dow Jones Industrial Average broke above its medium-term downward trend line recently. Then it continued higher above a few-week-long downward trend line. The blue-chip index bounced off resistance level of 25,000 on Monday, and then it retraced some of its recent advance on Tuesday. It continues to fluctuate relatively close to resistance level. Topping pattern or just flat correction? It looks like a correction:
The broad stock market reached the highest since March 21 on Monday, following S&P 500 index breakout above 2,700 mark, but it retraced some of its recent advance on Tuesday. Then it came back slightly higher yesterday. Is this a new downtrend or just downward correction? For now, it looks like a correction within an uptrend. The market extends its medium-term fluctuations. Just like we wrote in our several Stocks Trading Alerts, the early February sell-off set the negative tone for weeks or months to come.
Concluding, the S&P 500 index will likely fluctuate today following its Tuesday’s weakness. It doesn’t look like new downtrend, but we may see some more uncertainty, as investors take profits off the table. There have been no confirmed negative signals so far.
If you enjoyed the above analysis and would like to receive free follow-ups, we encourage you to sign up for our daily newsletter – it’s free and if you don’t like it, you can unsubscribe with just 2 clicks. If you sign up today, you’ll also get 7 days of free access to our premium daily Gold & Silver Trading Alerts. Sign up today!
Thank you.
Paul Rejczak
Stock Trading Strategist
Stock Trading Alerts
Sunshine Profits – Free Stock Market Analysis


