Briefly:
Intraday trade: Our Wednesday’s intraday trading outlook was bearish. It proved partly accurate, because the S&P 500 lost 0.1% following slightly lower opening of the trading session (-0.2%). The broad stock market fluctuates after its record-setting rally. There have been no confirmed negative signals so far. However, we can see some clear short-term overbought conditions along with an overly bullish investors’ sentiment. Therefore, intraday short position is favored again. Stop-loss is at the level of 2,765 and potential profit target is at 2,710 (S&P 500 index).
Our intraday outlook is bearish today. Our short-term outlook is neutral, and our medium-term outlook is neutral:
Intraday outlook (next 24 hours): bearish
Short-term outlook (next 1-2 weeks): neutral
Medium-term outlook (next 1-3 months): neutral
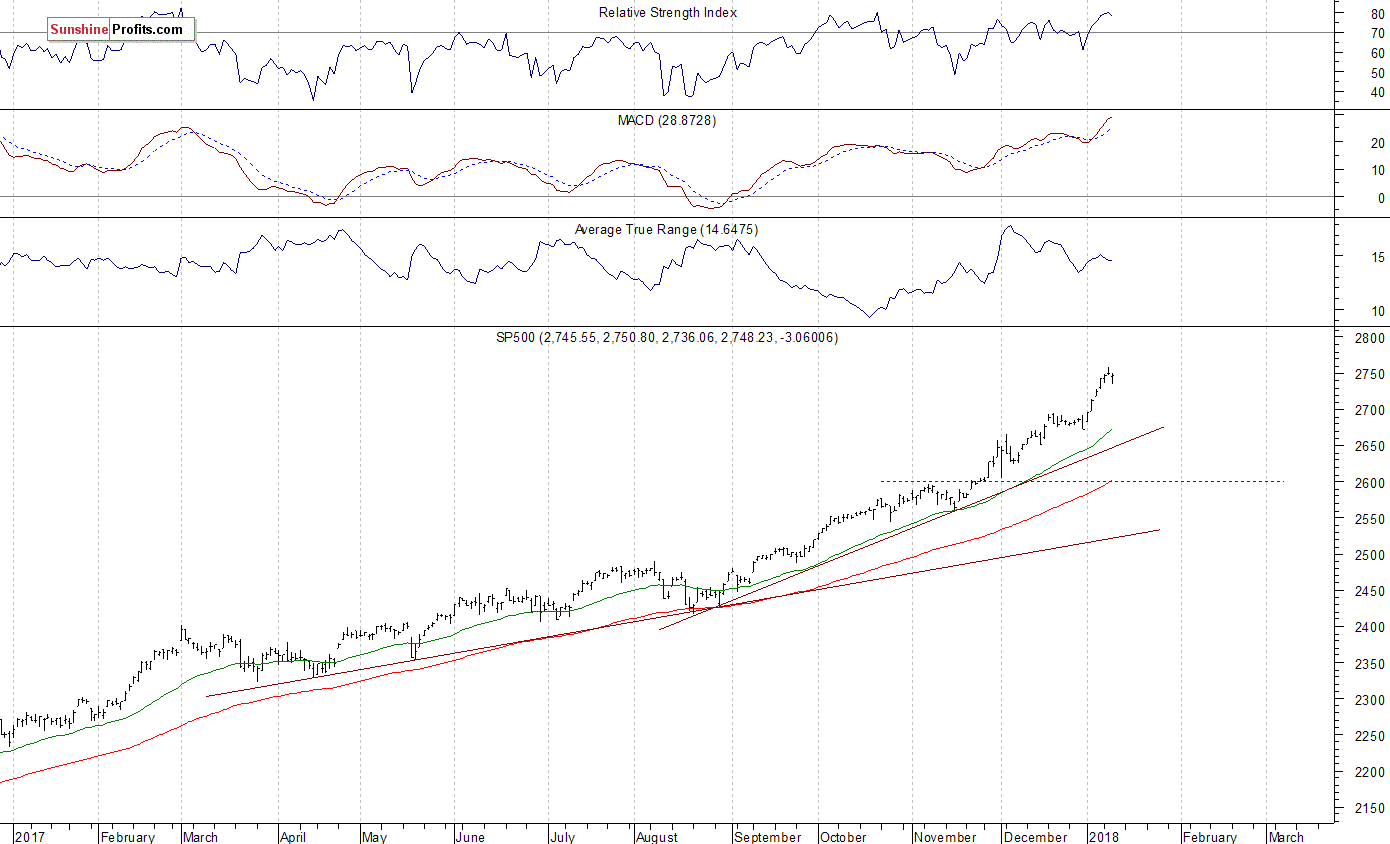
The main U.S. stock market indexes lost 0.1% on Wednesday, as stocks fluctuated following their week-long record setting rally. The S&P 500 index retraced some of its recent move up, before bouncing off support level and closing virtually flat. The Dow Jones Industrial Average remained relatively close to its Tuesday’s new record high of 25,439.78, and the technology Nasdaq Composite traded above 7,100 mark. The nearest important level of support of the S&P 500 index is at around 2,735-2,740, marked by recent fluctuations. The next support level is at 2,730, marked by Friday’s daily low. The support level is also at 2,715-2,720, marked by last Thursday’s daily gap up of 2,714.37-2,719.07. On the other hand, potential resistance level is at 2,760, marked by new all-time high. There have been no confirmed negative signals so far. However, we still can see medium-term technical overbought conditions along with negative technical divergences:

Mixed Expectations
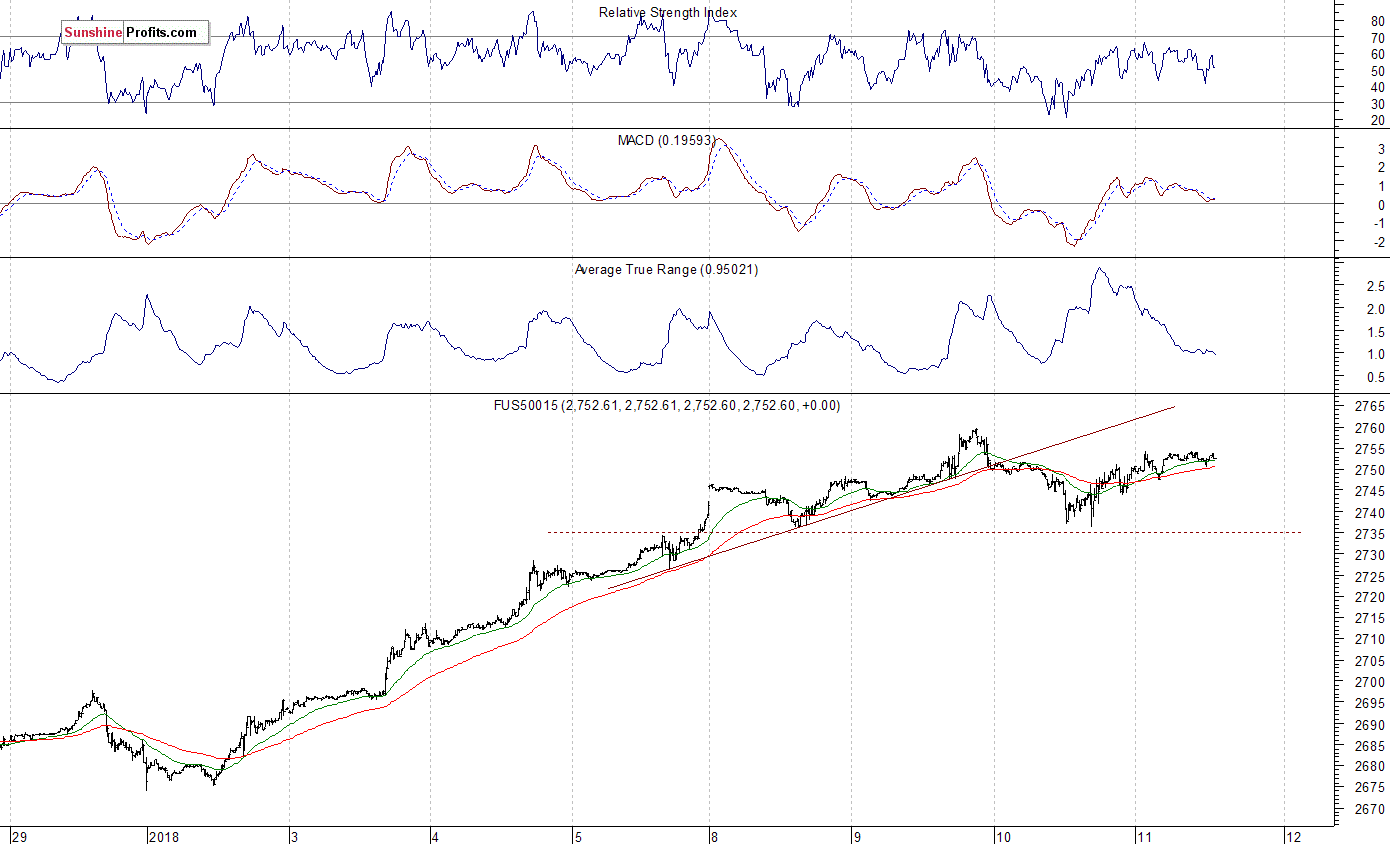
Expectations before the opening of today’s trading session are virtually flat, with index futures currently up 0.1% vs. their Wednesday’s closing prices. The European stock market indexes have been mixed so far. Investors will wait for some economic data announcements: Producer Price Index, Initial Claims at 8:30 a.m. The market expects that Producer Prices grew 0.2% in December. The S&P 500 futures contract trades within an intraday consolidation, following yesterday’s rebound. The nearest important level of resistance is at around 2,760, marked by record high. On the other hand, support level is at 2,735-2,740, marked by yesterday’s daily lows. The futures contract remains close to its record high, as we can see on the 15-minute chart:
Nasdaq 100 Just Below 6,700 Mark
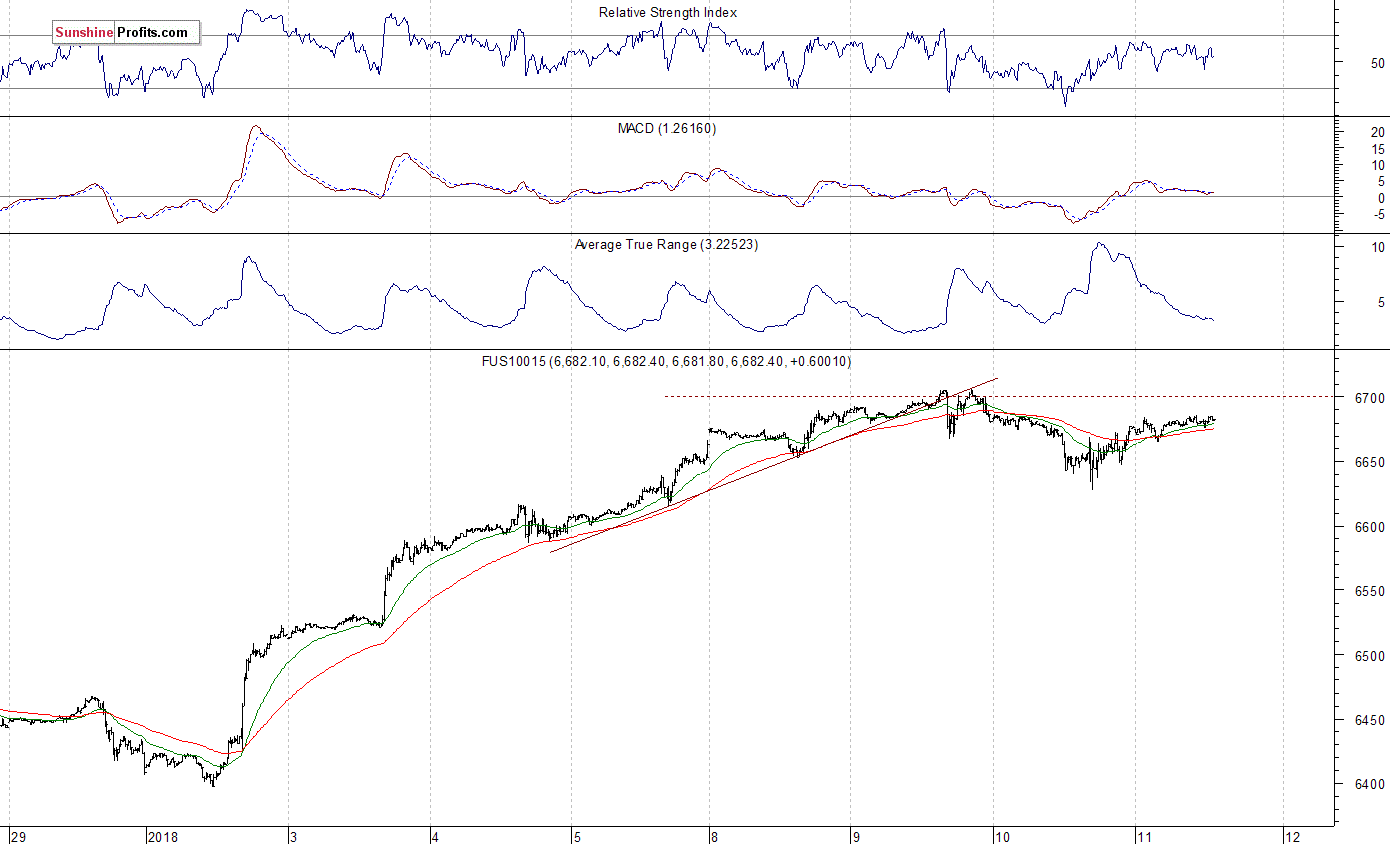
The technology Nasdaq 100 futures contract follows a similar path, as it trades within an intraday consolidation. The market retraced most of its yesterday’s weakness. The nearest important level of resistance is at around 6,700, marked by new all-time high. On the other hand, support level is at 6,650. The next level of support remains at around 6,630, marked by yesterday’s daily low. The Nasdaq 100 futures contract trades within a short-term consolidation along its new all-time high, as the 15-minute chart shows:
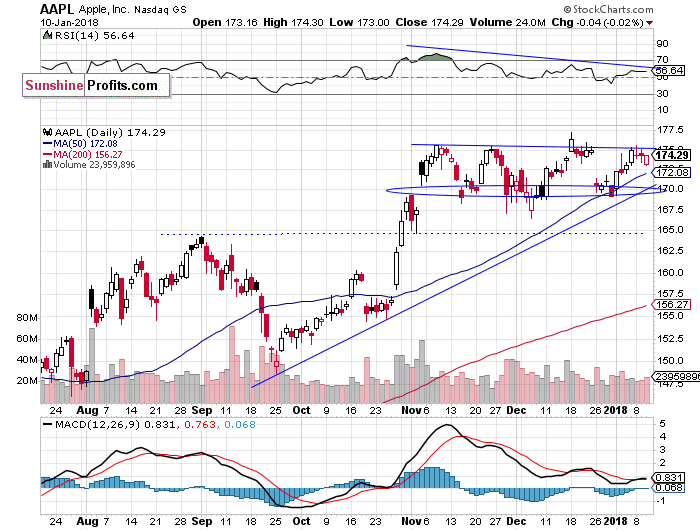
Let’s take a look at Apple, Inc. stock (AAPL) daily chart (chart courtesy of http://stockcharts.com) again. The price reached new record high three weeks ago, as it broke above $175 mark. It failed to continue that rally and fluctuated along the level of $175. Then, the stock fell to support level of around $170 again, marked by the early November daily gap up. It bounced off the support level recently. The price is close to resistance level, but will it break above record high?
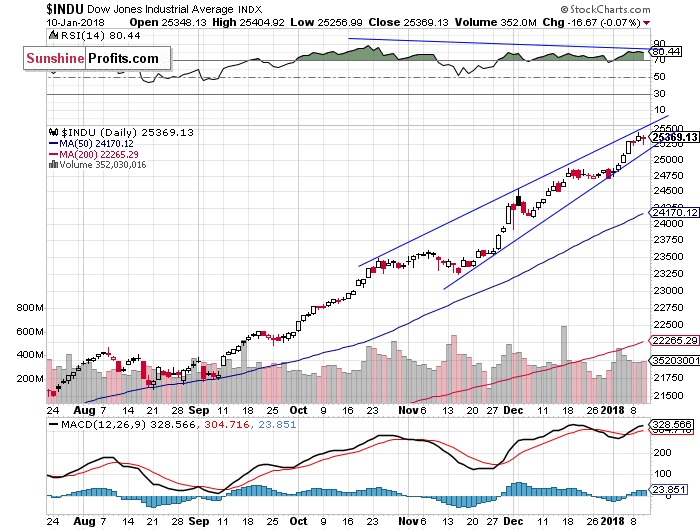
The Dow Jones Industrial Average daily chart shows that blue-chip index broke above its short-term consolidation last week. Then it continued reaching several new record highs. We still can see negative technical divergences. The most common divergences are between asset’s price and some indicator based on it (for instance the index and RSI based on the index). In this case, the divergence occurs when price forms a higher high and the indicator forms a lower high. It shows us that even though price reaches new highs, the fuel for the uptrend starts running low. The index trades within a two-month-long rising wedge pattern. Is this some medium-term topping pattern?
Concluding, the S&P 500 index lost 0.1% yesterday, after bouncing off support level. The market remains relatively close to Tuesday’s record high. Will it extend its medium-term uptrend? Or is this some topping pattern ahead of downward correction? We still can see medium-term overbought conditions along with negative technical divergences. However, there have been no confirmed negative signals so far.
If you enjoyed the above analysis and would like to receive free follow-ups, we encourage you to sign up for our daily newsletter – it’s free and if you don’t like it, you can unsubscribe with just 2 clicks. If you sign up today, you’ll also get 7 days of free access to our premium daily Gold & Silver Trading Alerts. Sign up today!.
Thank you.
Paul Rejczak
Stock Trading Strategist
Stock Trading Alerts
Sunshine Profits – Free Stock Market Analysis


