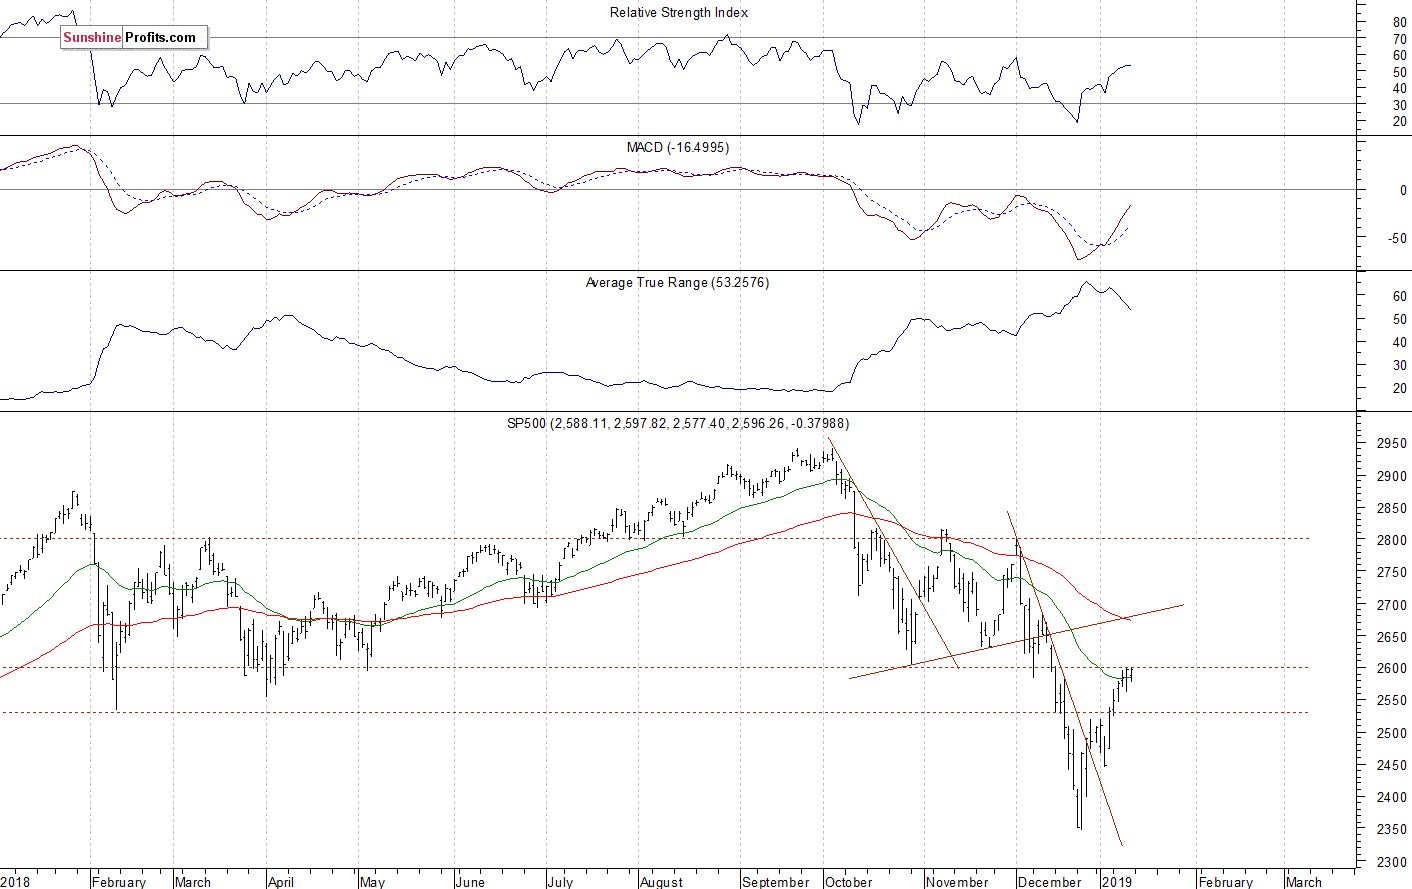
The U.S. stock market indexes were mixed between -0.2% and 0.0% on Friday, as investors hesitated following the recent advance. The broad stock market has retraced its recent decline following the S&P 500’s breakdown below 2,600. It continued its recent rebound off the December the 26th medium-term low of 2,346.58 recently. The index traded 20.2% below September the 21st record high of 2,940.91 on that day. Then the market rallied and retraced some of the downtrend. It got very close to 2,600 mark again. The Dow Jones Industrial Average was unchanged and the Nasdaq Composite lost 0.2% on Friday.
The nearest important level of resistance of the S&P 500 index remains at 2,600, marked by the previous local lows. The resistance level is also at 2,635-2,640, marked by December the 14th daily gap down of 2,635.07-2,637.27. On the other hand, the level of support is at 2,550-2,570, and the next support level remains at 2,500, marked by some recent local highs.
The broad stock market broke below its two-month-long trading range in the mid-December, as the S&P 500 index fell below the level of 2,600. Then the market accelerated lower and it broke below the level of 2,400. The downward correction reached 20.2% from the September all-time high, surpassing January-February correction of around 12%. Is this a long-term bear market? It still looks like a medium-term downward correction, but the index remains slightly below the October-December consolidation, as we can see on the daily chart:

Negative Expectations, Downward Reversal?
The index futures contracts trade 0.9-1.1% below their Friday’s closing prices. So expectations before the opening of today’s trading session are negative. The European stock market indexes have lost 0.7-1.0% so far. There will be no new important economic data announcements today. The broad stock market may retrace some of its recent advance. Despite last week’s gains, we saw some profit-taking action following the recent rally.
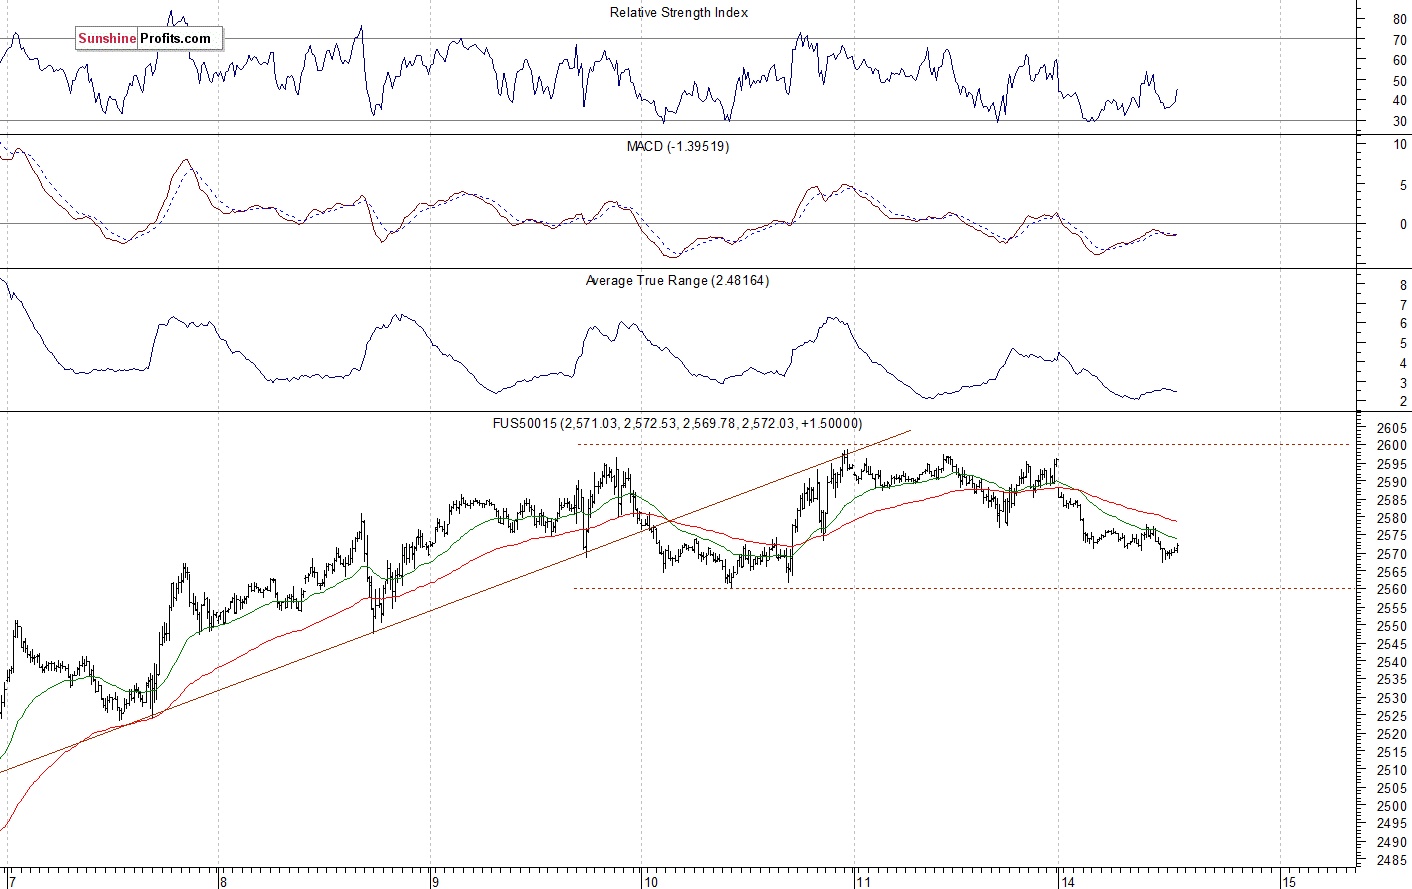
The S&P 500 futures contract trades within an intraday downtrend, as it extends its overnight decline. The nearest important level of support is now at around 2,560-2,570, marked by some recent fluctuations. On the other hand, the resistance level is at 2,590-2,600. The futures contract remains below the level of 2,600, as the 15-minute chart shows:
Nasdaq Also Lower
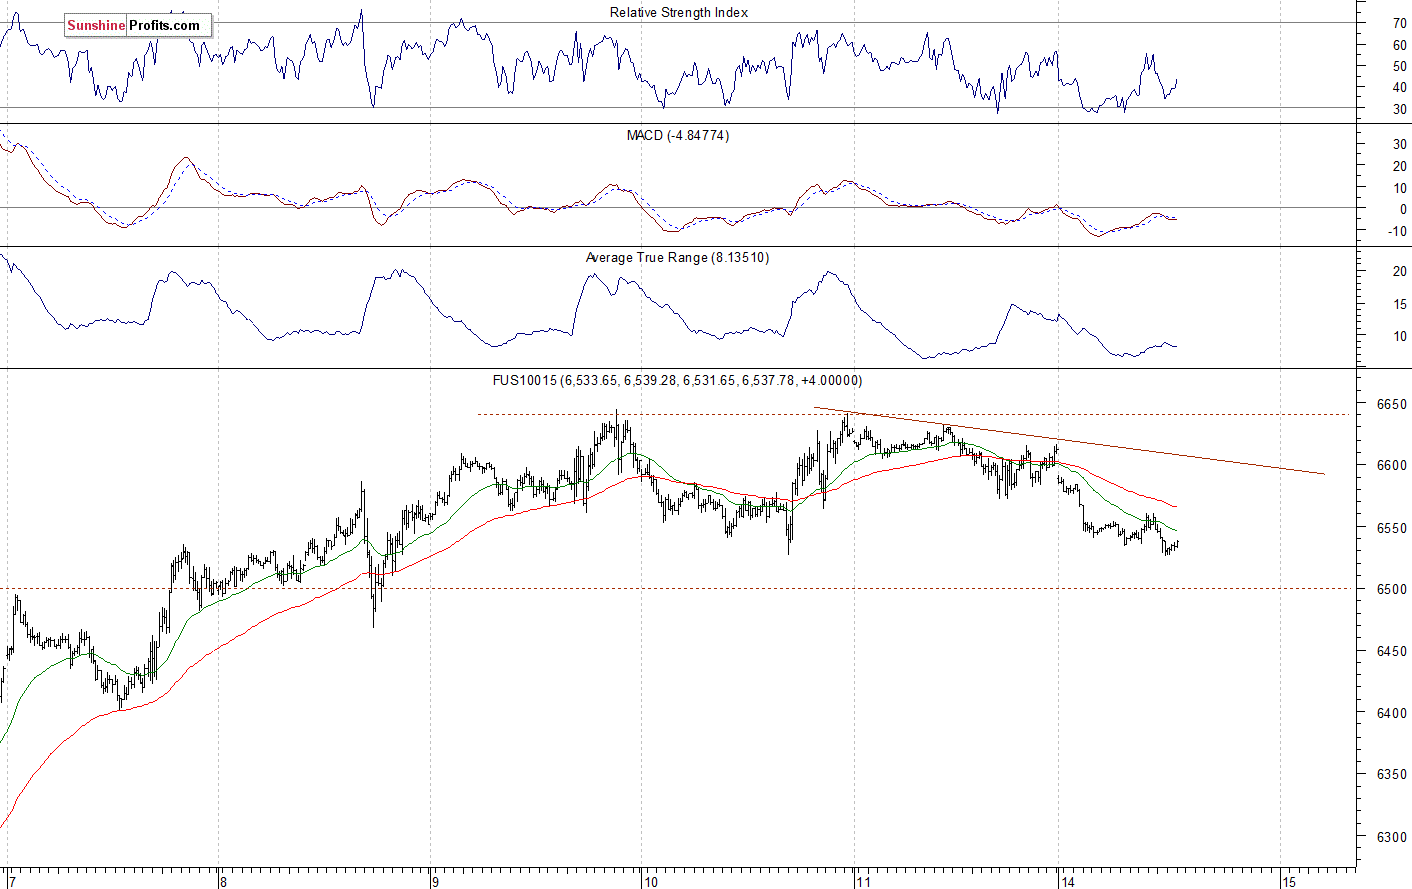
The technology Nasdaq 100 futures contract follows a similar path, as it trades within an intraday downtrend. It broke above the level of 6,600 recently, but then it failed to continue higher. It gained more than 800 points from December the 26th local low of around 5,820 and then we saw some technical overbought conditions. The Nasdaq futures contract extends its short-term consolidation, as we can see on the 15-minute chart:
Tech Stocks Going Sideways, Short-Term Topping Pattern?
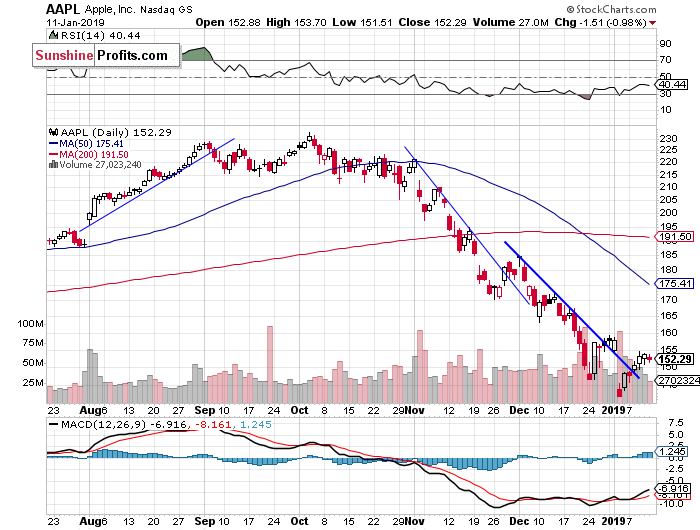
Let’s take a look at Apple, Inc. stock (AAPL) daily chart (chart courtesy of http://stockcharts.com). The stock sold off recently, as it reached the new medium-term low of $142. We saw clear short-term oversold conditions and then the stock retraced some of its recent decline. It broke above the month-long downward trend line, but it remains below the resistance level of $155-160:
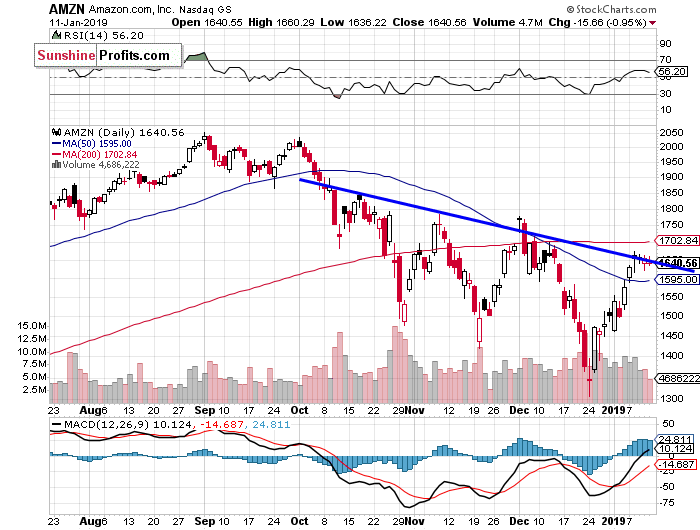
Now let’s take a look at Amazon.com, Inc. stock (AMZN) daily chart. The stock accelerated its downtrend in the late December and it reached the new medium-term low of $1,307. Since then it was consequently advancing. On Tuesday the market reached its three-month-long downward trend line. We may see an attempt at breaking higher:
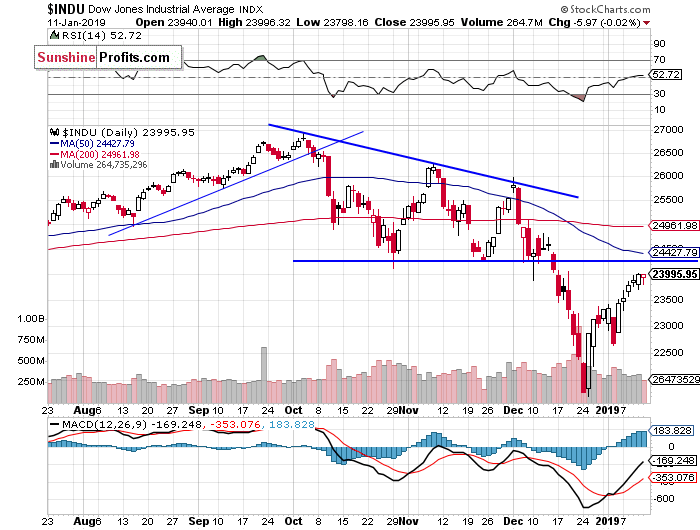
Dow Jones Remains Close to 24,000
The Dow Jones Industrial Average broke below its two-month-long consolidation in the mid-December and then it accelerated much lower. The blue-chip stocks’ gauge fell below the level of 22,000. It slightly extended the downtrend recently before sharply reversing higher and getting back to 24,000 mark. The market is now slightly below its October – December trading range after retracing most of its post-breakdown sell-off:
The S&P 500 index extended its downtrend in the late December, before reversing higher. The broad stock market was more than 20% below its September’s record high on December the 26th. Is this a new long-term bear market or just medium-term downward correction? For now, it looks like a correction. However, there have been no confirmed medium-term positive signals so far. The market retraced some of its recent decline, but it continues to trade below the important resistance levels.
Concluding, the S&P 500 index will likely open lower today. The market may retrace some of its short-term uptrend and we may see a profit-taking action.
If you enjoyed the above analysis and would like to receive free follow-ups, we encourage you to sign up for our daily newsletter – it’s free and if you don’t like it, you can unsubscribe with just 2 clicks. If you sign up today, you’ll also get 7 days of free access to our premium daily Gold & Silver trading Alerts. Sign up today!
Thank you.
Paul Rejczak
Stock trading Strategist
Stock trading Alerts
Sunshine Profits – Free Stock Market Analysis


