Stock Trading Alert originally sent to subscribers on May 25, 2017, 6:58 AM.
Our intraday outlook is now neutral, and our short-term outlook is neutral. Our medium-term outlook remains neutral, following S&P 500 index breakout above last year’s all-time high:
Intraday outlook (next 24 hours): neutral
Short-term outlook (next 1-2 weeks): neutral
Medium-term outlook (next 1-3 months): neutral
Long-term outlook (next year): neutral
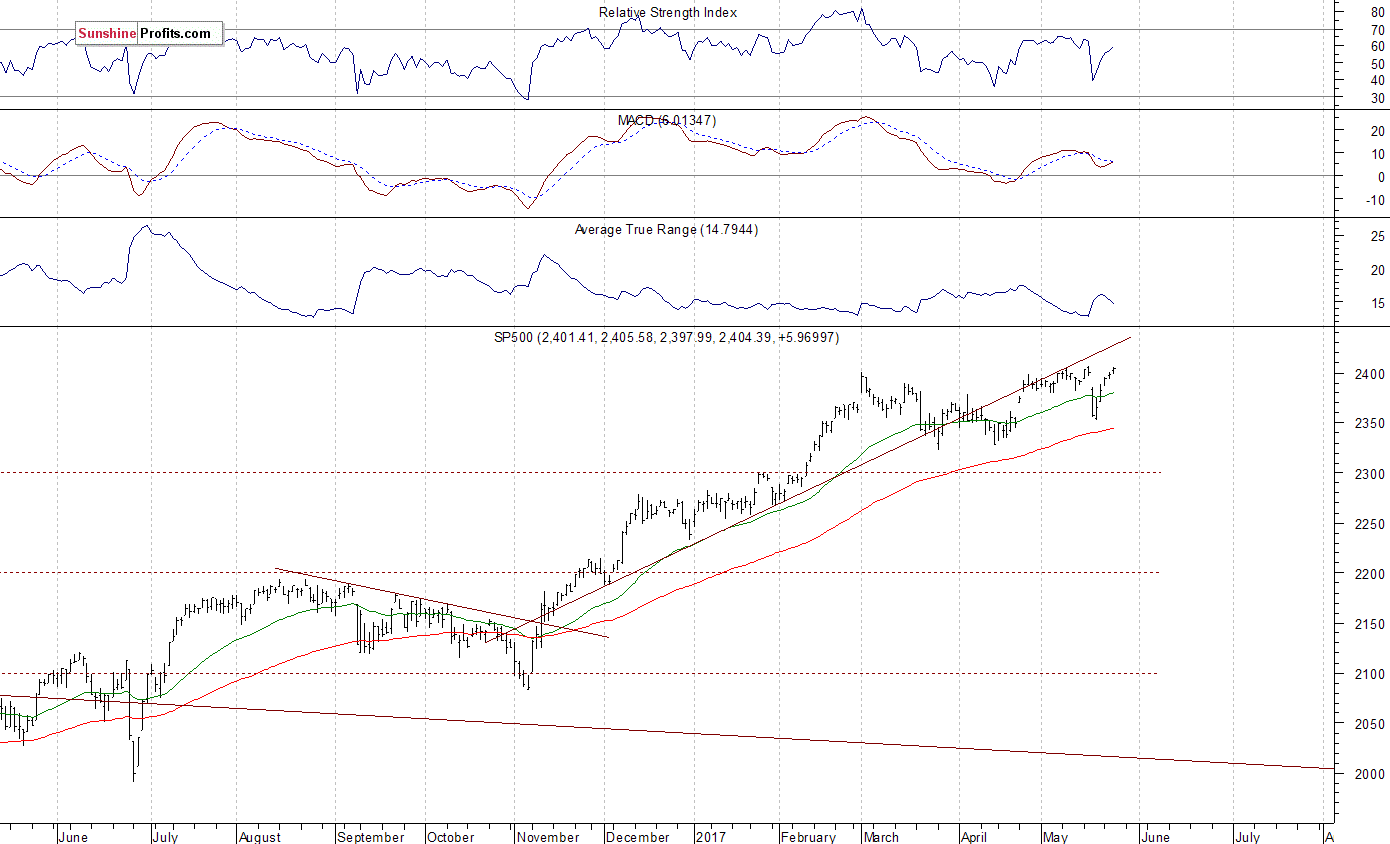
The U.S. stock market indexes gained between 0.3% and 0.5% on Wednesday, extending their recent move up, as investors reacted to economic data announcements, including the FOMC Meeting Minutes release. The S&P 500 index got very close to its May 16 all-time high of 2,405.77. The Dow Jones Industrial Average broke slightly above the level of 21,000 again, and technology Nasdaq Composite got closer to its mid-May all-time high, as it gained 0.4%. The broad stock market has retraced last week’s Wednesday’s move down, as the S&P 500 index closed slightly above 2,400 mark. Will the uptrend accelerate towards new record highs following an overnight S&P 500 futures contract rally? The nearest important resistance level is at around 2,405. On the other hand, support level is currently at around 2,390-2,395, marked by some short-term local lows. The next level of resistance remains at 2,380-2,385. The support level is also at 2,370, marked by local low. Is this a topping pattern before medium-term downward reversal? The uptrend accelerated on March 1 and it looked like a blow-off top pattern accompanied by some buying frenzy. The S&P 500 index continues to trade below its medium-term upward trend line, as we can see on the daily chart:

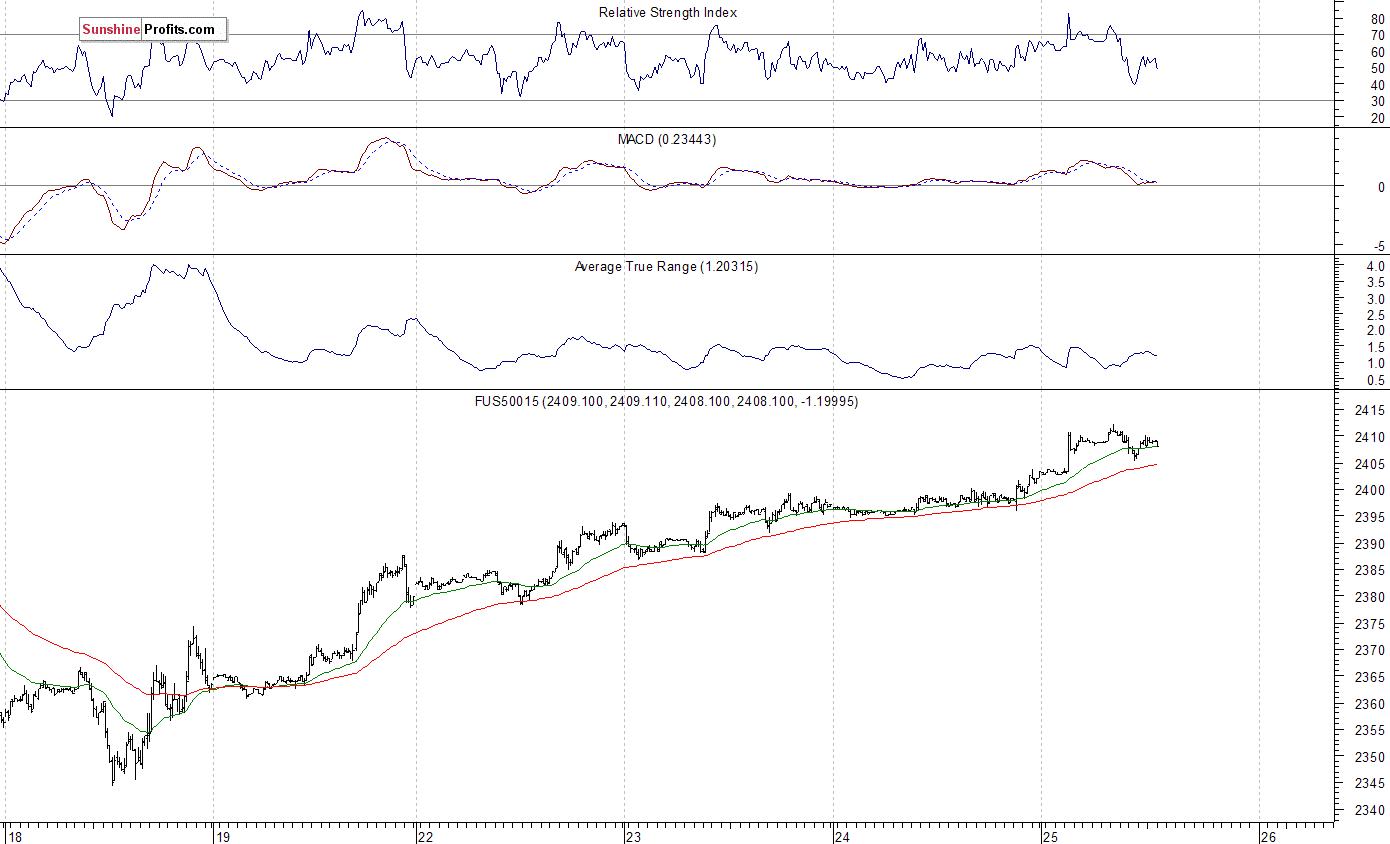
Expectations before the opening of today’s trading session are very positive, with index futures currently up 0.3-0.4%, following an overnight move up. The European stock market indexes have gained 0.1-0.2% so far. Investors will now wait for the weekly Initial Claims number release at 8:30 a.m. The market expects that it was at 238,000 last week. The S&P 500 futures contract trades within an intraday consolidation, following an overnight move up. It has reached new record high above the level of 2,412. The nearest important level of resistance is at around 2,410-2,415. On the other hand, support level is at 2,400-2,405, marked by previous level of resistance. The next important level of support is at 2,390-2,395, marked by recent fluctuations. The market continues to trade within a short-term uptrend off last week’s Thursday’s overnight lows. Is this a new uptrend or just move up within three-month-long consolidation? There have been no confirmed negative signals so far. However, we can see some short-term overbought conditions, along with negative technical divergences:
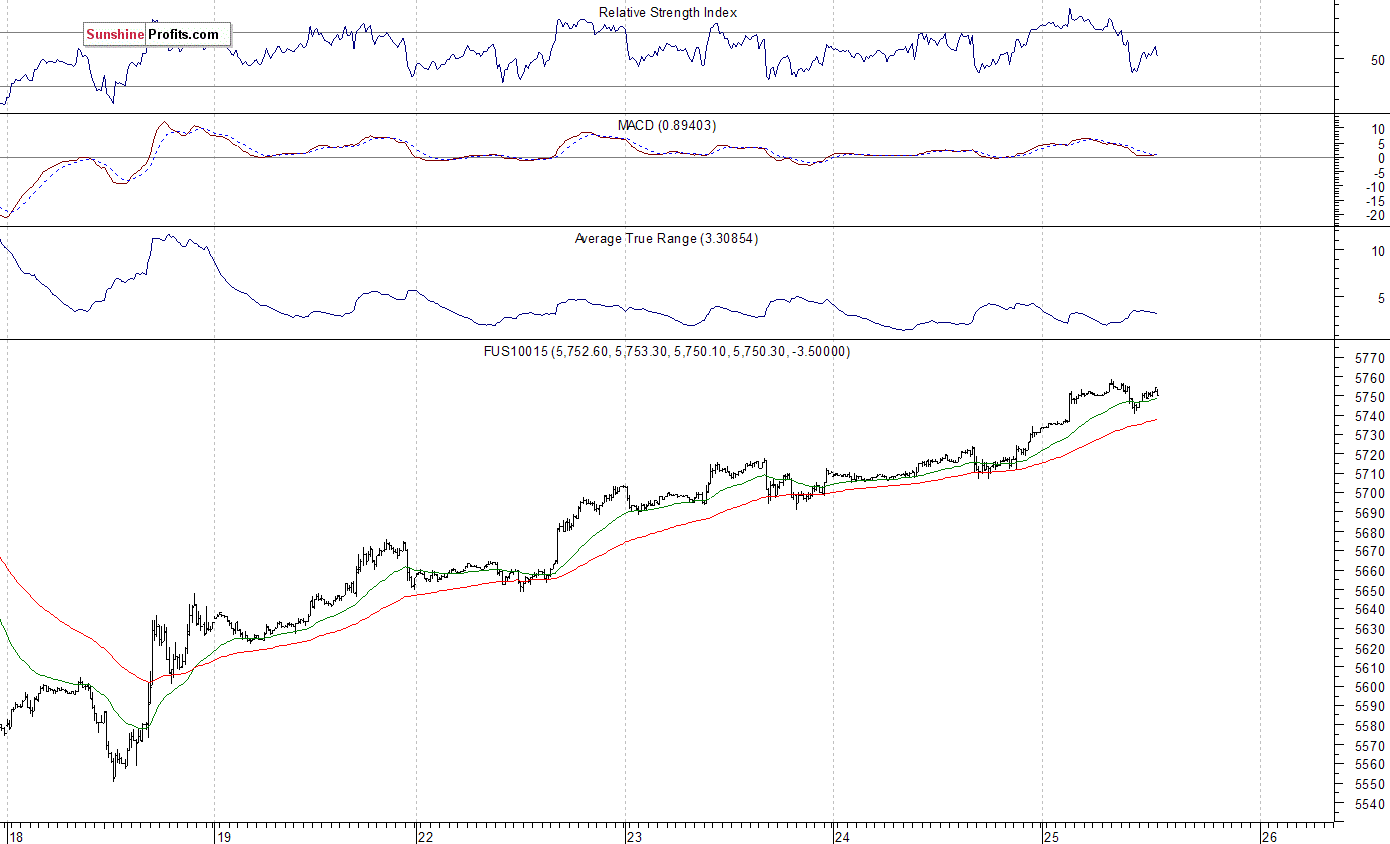
The technology Nasdaq 100 futures contract follows a similar path, as it currently trades within an intraday consolidation after an overnight rally. It is trading along new record high close to the level of 4,760. The nearest important level of resistance is at around 5,760. On the other hand, support level is at 5,740, marked by local low. The next level of support is at around 5,700-5,720, marked by previous resistance level, as the 15-minute chart shows:
Concluding, the S&P 500 index got very close to its mid-May all-time high of 2,405.77 on Wednesday. The broad stock market will probably continue its over eight-year-long bull market today, following overnight futures rally. The index may break above three-month-long medium-term consolidation along the level of 2,400. But will the uptrend accelerate? Or is this some topping pattern before downward reversal? We still can see medium-term negative technical divergences. However, there have been no confirmed negative signals so far.
Thank you.
Paul Rejczak
Stock Trading Strategist
Stock Trading Alerts


