The U.S. stock market indexes were mixed between -0.5% and +0.3% on Friday, as investors took some short-term profits off the table following the recent advance. The S&P 500 index has reached the new record high of 2,940.91. The Dow Jones Industrial Average gained 0.3% and the technology Nasdaq Composite lost 0.5% on Friday.
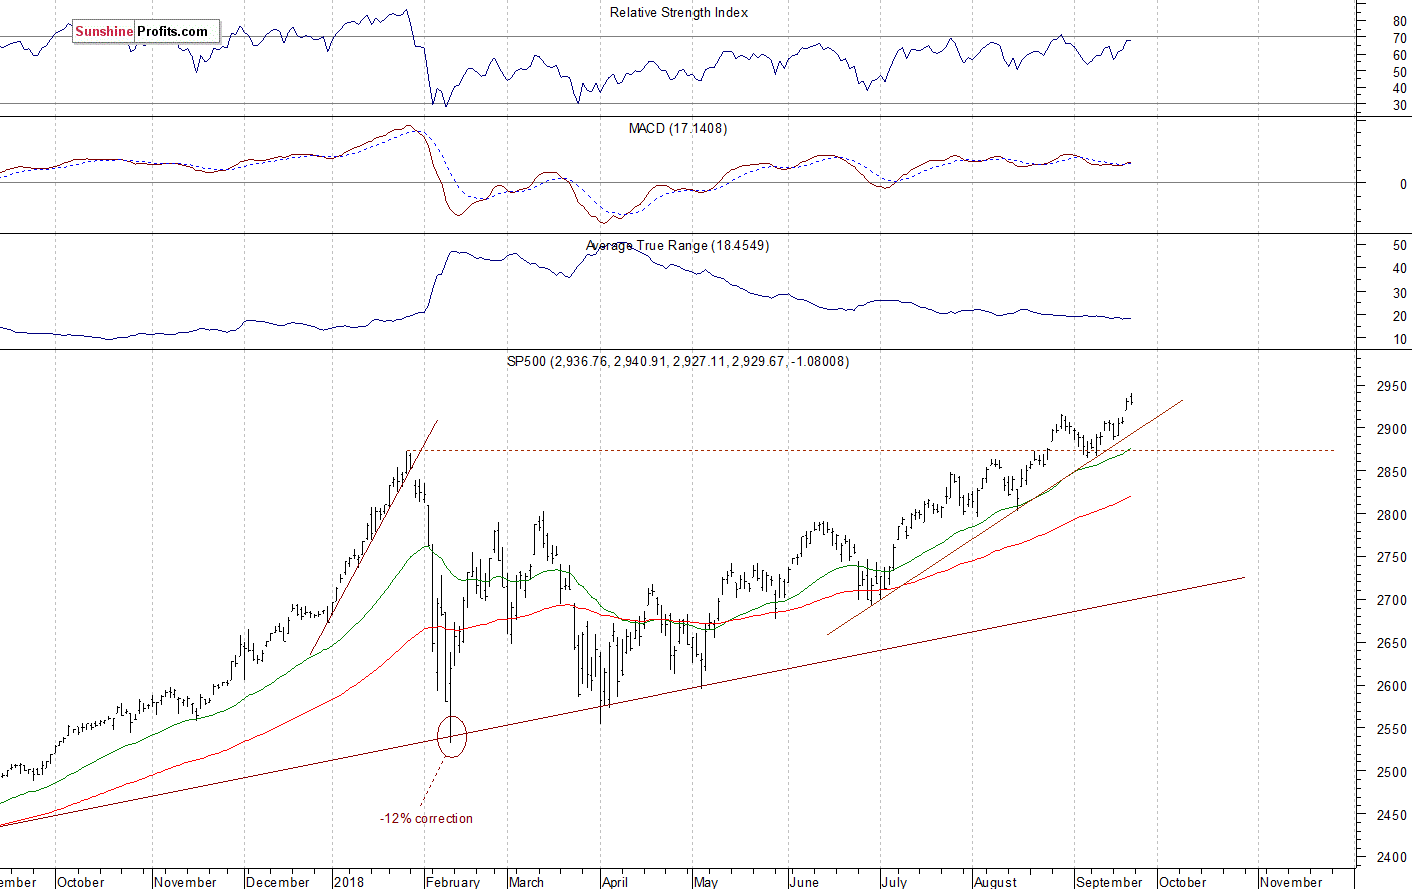
The nearest important level of support of the S&P 500 index remains at 2,915-2,920, marked by Thursday’s daily gap up of 2,912.36-2,919.73. The next support level is at 2,900. The support level is also at 2,885-2,890, marked by the recent local lows. On the other hand, the level of resistance is at around 2,940-2,950.
The broad stock market reached the new record high on Friday, as the S&P 500 index extended its short-term uptrend above the level of 2,900. Will it continue higher despite some short-term technical overbought conditions? There have been no confirmed negative signals so far. The index continues to trade above its three-month-long upward trend line, as we can see on the daily chart:

Downward Reversal or Just Correction?
The index futures contracts trade 0.2-0.4% below their Friday’s closing prices. So expectations before the opening of today’s trading session are slightly negative. The European stock market indexes have lost 0.1-0.2% so far. There will be no new important economic data announcements. The broad stock market will likely extend its short-term fluctuations today. We may see some more profit-taking action following the recent advance. There have been no confirmed negative signals so far.
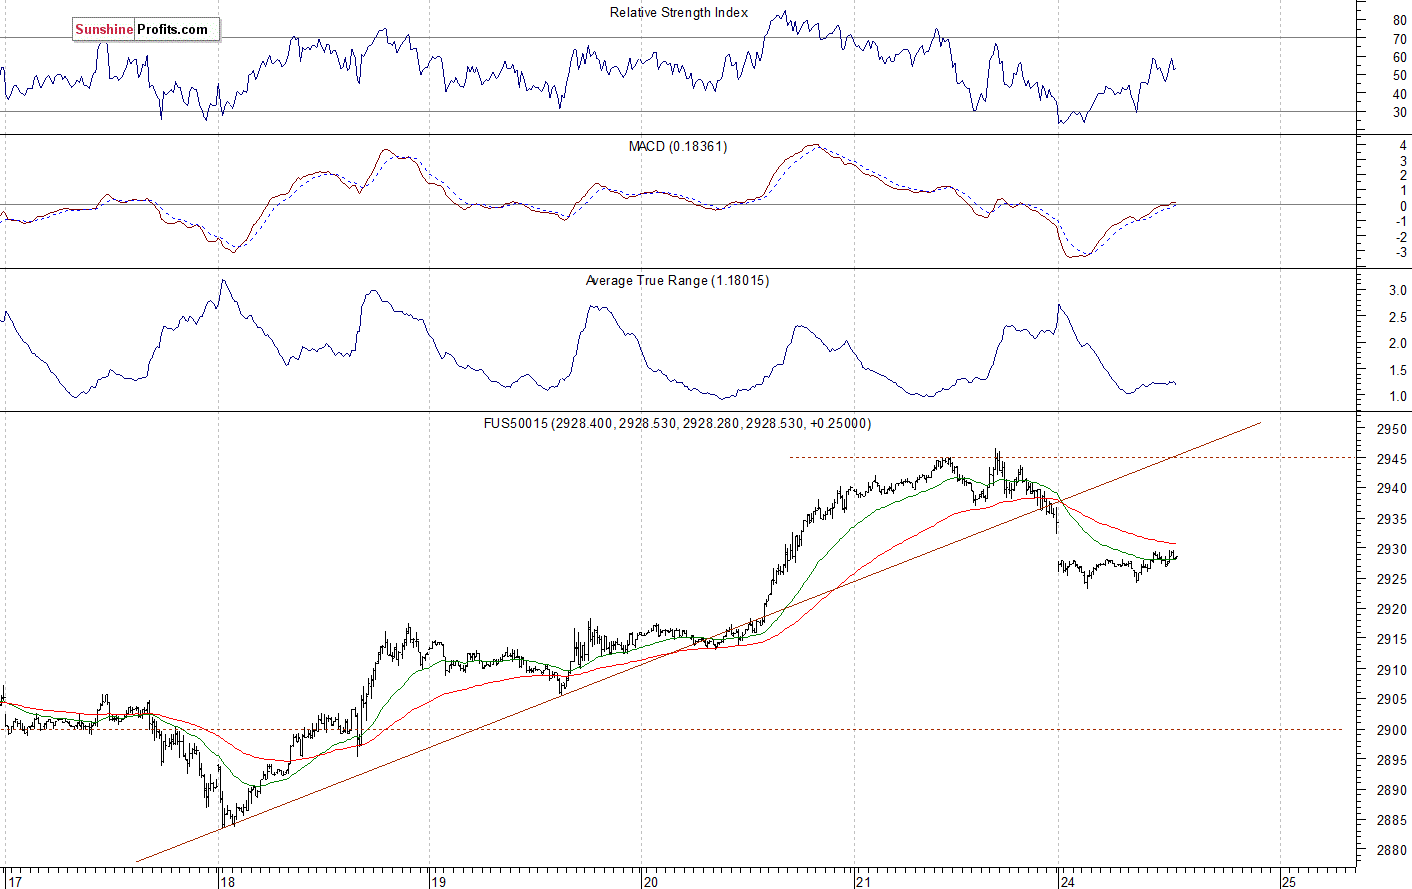
The S&P 500 futures contract trades within an intraday consolidation following an overnight decline. The nearest important level of resistance is at 2,935-2,945, marked by the record high. On the other hand, the support level is at 2,925, marked by the local lows. The support level is also at 2,900-2,910. The futures contract is now below its week-long upward trend line, as we can see on the 15-minute chart:
Nasdaq at 7,500 Again
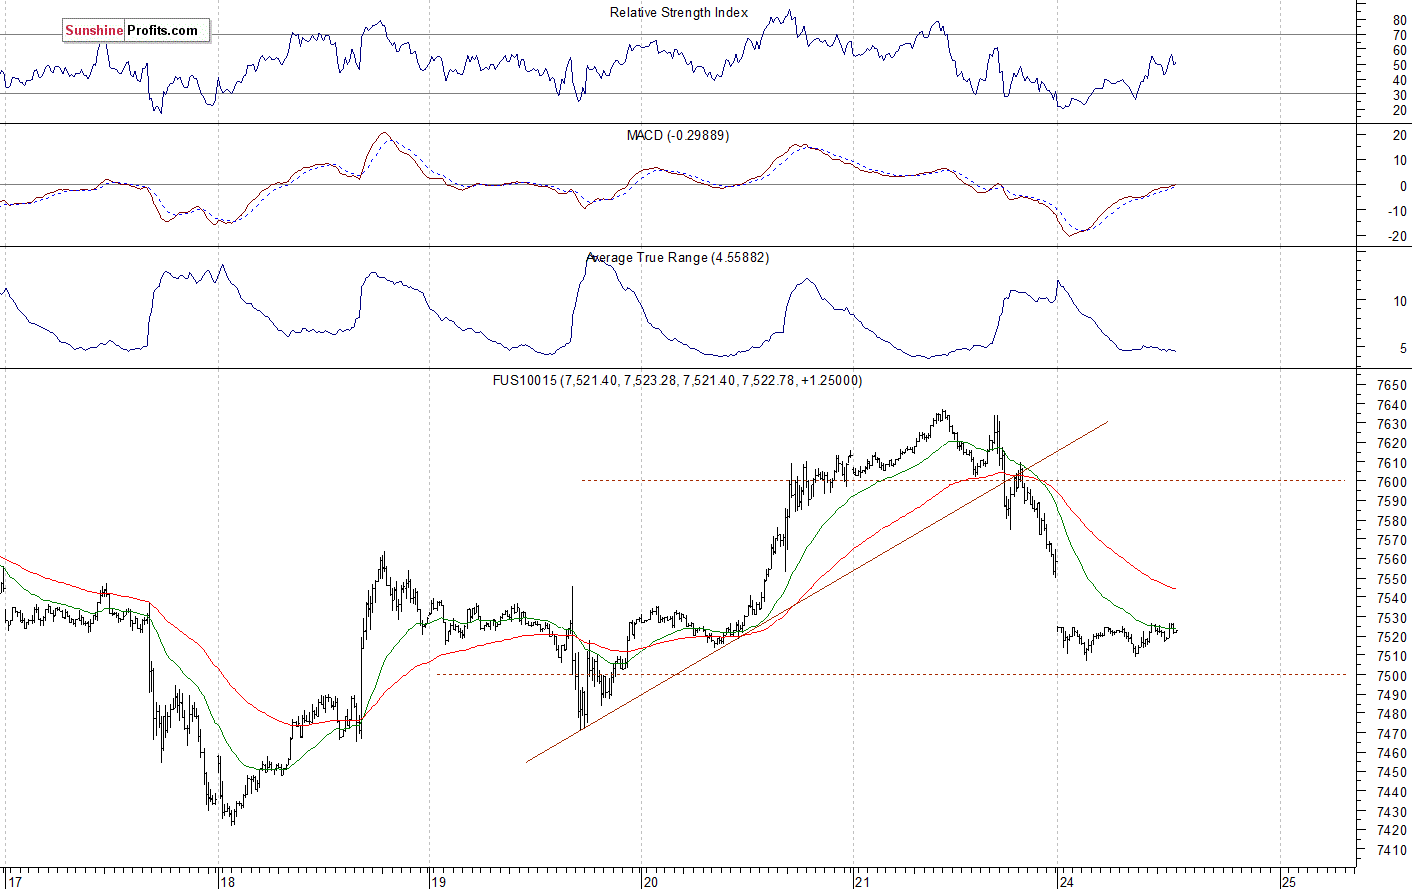
The technology Nasdaq 100 futures contract follows a similar path, as it fluctuates after an overnight decline. It remains relatively weaker than the broad stock market following almost 4% downward correction off the August 30th record high of around 7,700. The nearest important level of resistance is at around 7,550-7,570, and the next resistance level is at 7,600-7,650. On the other hand, support level is at 7,470-7,500, among others. The Nasdaq futures contract remains below its Friday’s trading range, as the 15-minute chart shows:
Apple, Amazon – Still Going Sideways
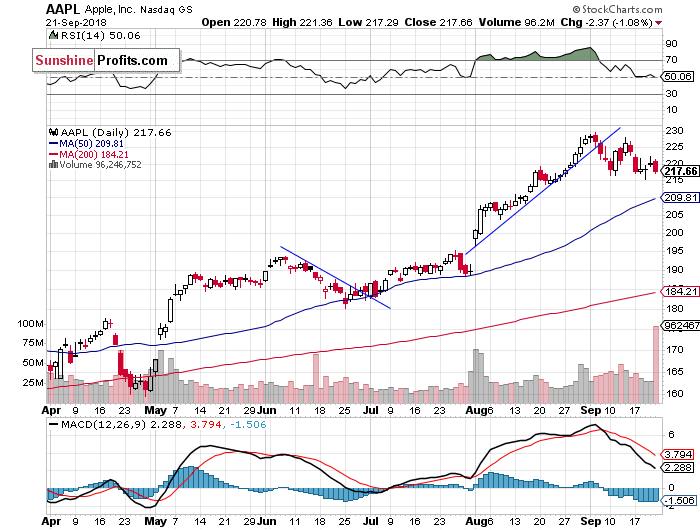
Let’s take a look at Apple, Inc. stock (AAPL) daily chart (chart courtesy of http://stockcharts.com). It reached the new record high at the level of $229.67 on September the 5th, before reversing lower. Then it broke below its month-long upward trend line. The resistance level remains at $225-230. On the other hand, support level is at $215. If the price breaks lower, we could see more selling pressure:
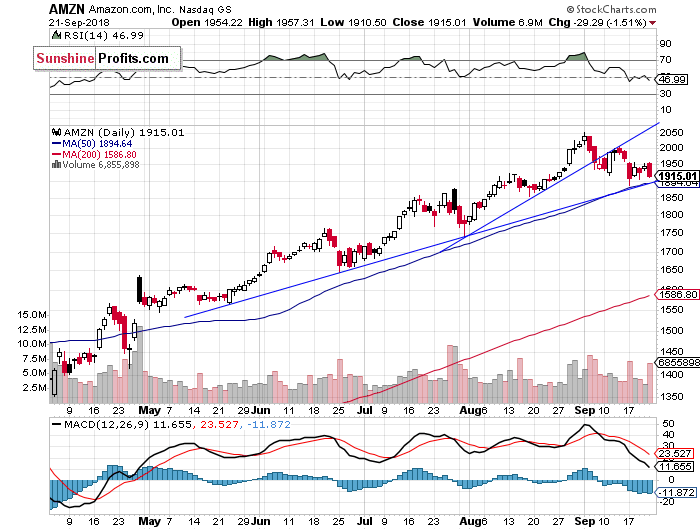
Now let’s take a look at Amazon.com, Inc. stock (AMZN) daily chart. It has reached the new record high at the price of $2,050.50 recently. Since then it was retracing this record-breaking rally. The stock broke below the month-long upward trend line in the early September. We still can see negative technical divergences. The price is at its medium-term upward trend line:
Dow Jones at New Record High Again
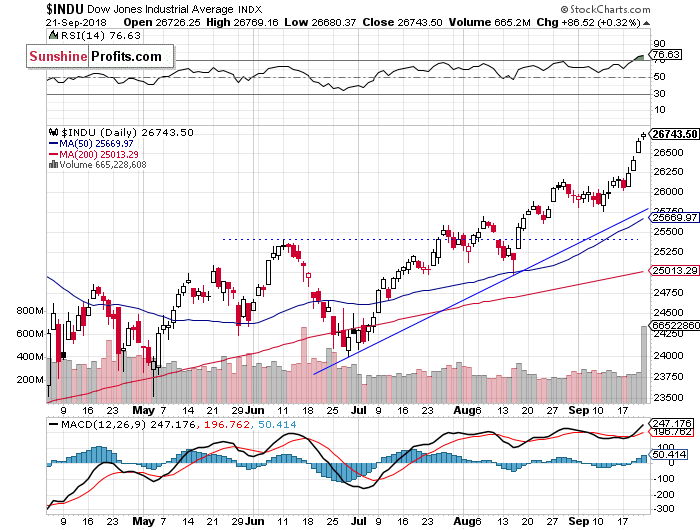
The Dow Jones Industrial Average extended its uptrend on Friday, as it reached the new all-time high at the level of 26,769.16. The nearest important level of support remains at 26,500, marked by the recent resistance level. The index accelerated the uptrend above its tree-month long upward trend line. We can see some short-term technical overbought conditions:
The S&P 500 index reached the new record high on Friday following the recent breakout above the late August local high of around 2,917. The broad stock market extends its over nine-year-long bull market, but will it continue much higher? There have been no confirmed negative signals so far.
Concluding, the S&P 500 index will likely open slightly lower today. Investors may take short-term profits off the table. However, it doesn’t look like some meaningful downward reversal.
If you enjoyed the above analysis and would like to receive free follow-ups, we encourage you to sign up for our daily newsletter – it’s free and if you don’t like it, you can unsubscribe with just 2 clicks. If you sign up today, you’ll also get 7 days of free access to our premium daily Gold & Silver Trading Alerts. Sign up today!
Thank you.
Paul Rejczak
Stock Trading Strategist
Stock Trading Alerts
Sunshine Profits – Free Stock Market Analysis


