
Did the recent 10% drop in the stock market bother you? Let me take a wild guess: it’s because you have money in stocks.
You might feel comforted that we’re all in this together. Don’t be… because we’re not. Roughly half of American households don’t own stocks.
That’s why it’s wrong to think that the stock market’s health says much about the nation’s economic health. The nation is its people, and many had little to celebrate even before the stock market dropped.
Investors ignore that fact at their own peril.

So Who Does Own US Stocks?
It’s a tricky question.
We have so many ownership structures and pooled investment vehicles. Despite this, I’ve managed to dig up some data that will surprise you.
The first surprise: A big slice of US stock market investors aren’t Americans at all. Foreigners own about 35% of US stocks by value. And their ownership grew considerably over the last few decades.
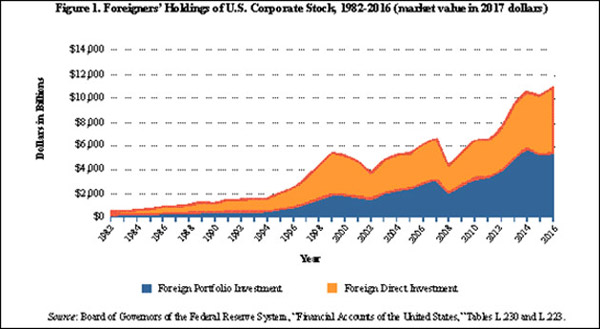 Image: taxnotes.com
They own far more of our stock market than ordinary Americans own.
About half of US households have zero exposure to the stock market: no stocks, no mutual funds, no 401(k), no IRA, nothing.
84% of the stocks owned by Americans belong to the wealthiest 10% of households, according to New York University economist Edward Wolff.
Once you subtract that 10%, and subtract the 50% who own no stocks, the remaining 40% of Americans split about 15% of the stock market.
For many, their investment is negligible—maybe a few hundred dollars in an old 401(k). Others have a big part of their net worth tied up in stocks. Maybe you’re in that group.
But a solid majority of our population feels no direct impact from stock market performance.
The inverse is different. Long-term stock market performance depends heavily on the US population’s economic health. Stocks are businesses that need customers, so how are the customers doing?
Consumers Under Strain
Expected wage growth has contributed to the stock market’s recent weakness.
People think it signals inflation, which will raise interest rates and make stocks less attractive to yield-seeking investors.
The latest data does indeed show average wages up slightly. But as we’ve seen, “average” is not the same as “everybody.”
My friend Michael Lebowitz published some good charts on this and other consumer issues last week.
The government’s average wage growth numbers include both workers and supervisors. Looking at them separately shows a whole different picture since the last recession.
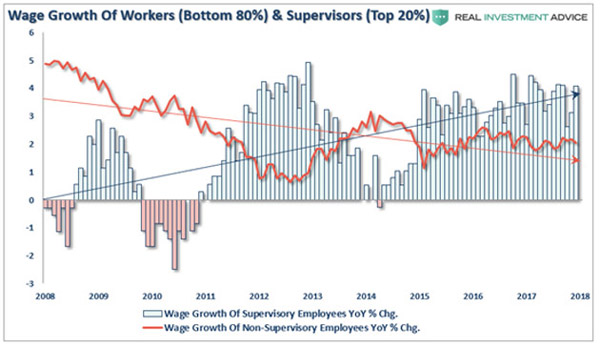
Image: realinvestmentadvice.com
Since 2008, average wage growth for workers, some 80% of the total, has trended lower even as supervisor wage growth trended higher.
That means rising wages haven’t been evenly distributed. The top one-fifth are getting almost all the wage growth. Meanwhile, the bottom four-fifths see flat or declining wage growth.
If your business plan depends on more consumers having more money to spend, this is a problem. Yes, some consumers are enjoying wage growth, but most are not.
From where else might people draw spending money? They can take it out of savings if they have any. But that’s getting harder, too.
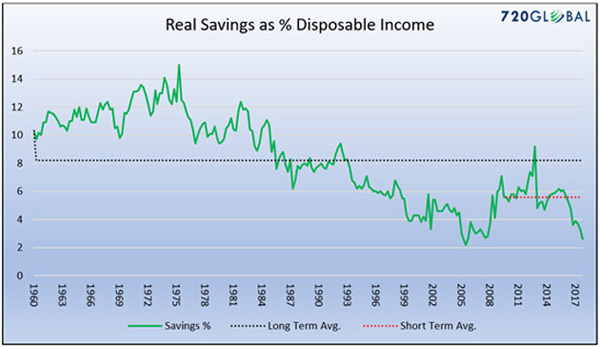
Image: realinvestmentadvice.com
Inflation-adjusted savings as a percentage of disposable income have been dropping since the 1970s. They bounced in the last recession but fell again after it ended. Now savings are near an all-time 2% low.
Note, this data includes wealthy people whose saving ability is much higher than average. So there’s a large group of lower-income people whose savings are already well below 2% of their disposable income.
If you can’t increase your spending with higher wages or pull cash out of savings, the only other option is debt. That usually means credit cards.
Here, we finally see some growth.
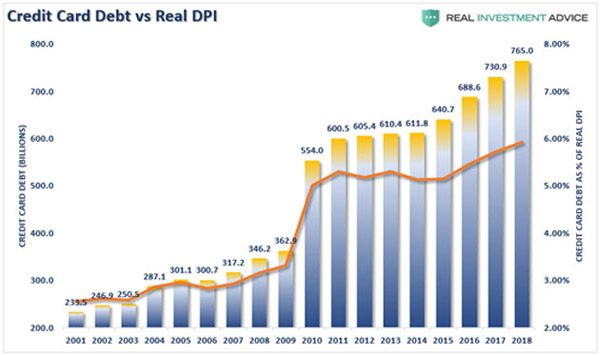
Image: realinvestmentadvice.com
Americans presently carry about $765 billion in credit card debt. That represents money already spent to buy goods and services.
Comparing that debt to the average disposable personal income, we find the typical American carries credit card balances equal to about 6% of DPI. That number jumped sharply in the last recession but never came back down. It has kept growing, although at a slower rate.
So the average American’s credit card balance, as a percentage of disposable income, is more than twice as much as his or her savings.
Combined with flat or declining wage growth for most workers, does this look like a population poised to go on a spending spree? I don’t think so.
And it doesn’t seem all that positive for most stocks.
This Can’t Continue
We’ve seen tremendous stock market growth in the last decade, but consumer income growth has been much less impressive.
Can this continue?
For a while, yes. Just look at China, where a booming stock market has coexisted with a vast, impoverished interior for years.
But even China probably can’t do it indefinitely. On a long enough time horizon, a nation’s stock market reflects its consumer economy. Production and consumption must balance.
The US stock market has grown faster than the economy, by a wide margin. That can’t go on forever. The scale will correct at some point—probably by swinging the other way, with the economy growing faster than stocks for an extended time.
That part of the cycle won’t be fun for stock investors.
Are we there yet?
No one knows… but it’s fair to say we are getting closer.
Subscribe to Connecting the Dots—and Get a Glimpse of the Future
We live in an era of rapid change… and only those who see and understand the shifting market, economic, and political trends can make wise investment decisions. Macroeconomic forecaster Patrick Watson spots the trends and spells what they mean every week in the free e-letter, Connecting the Dots. Subscribe now for his seasoned insight into the surprising forces driving global markets.


