Oil trading Alert originally sent to subscribers on January 19, 2017, 7:11 AM.
trading position (short-term; our opinion): Short positions (with a stop-loss order at $56.45 and an initial downside target at $45.81) are justified from the risk/reward perspective.
On Wednesday, crude oil lost 2.57% after the head of the IEA warned of a significant increase in U.S. shale output as OPEC and non-OPEC producers cut output. This news negatively affected the investors’ sentiment and pushed the black gold under important support levels. What does it mean for light crude?
Let’s examine the charts below to find out (charts courtesy of http://stockcharts.com).

Yesterday, we wrote the following:
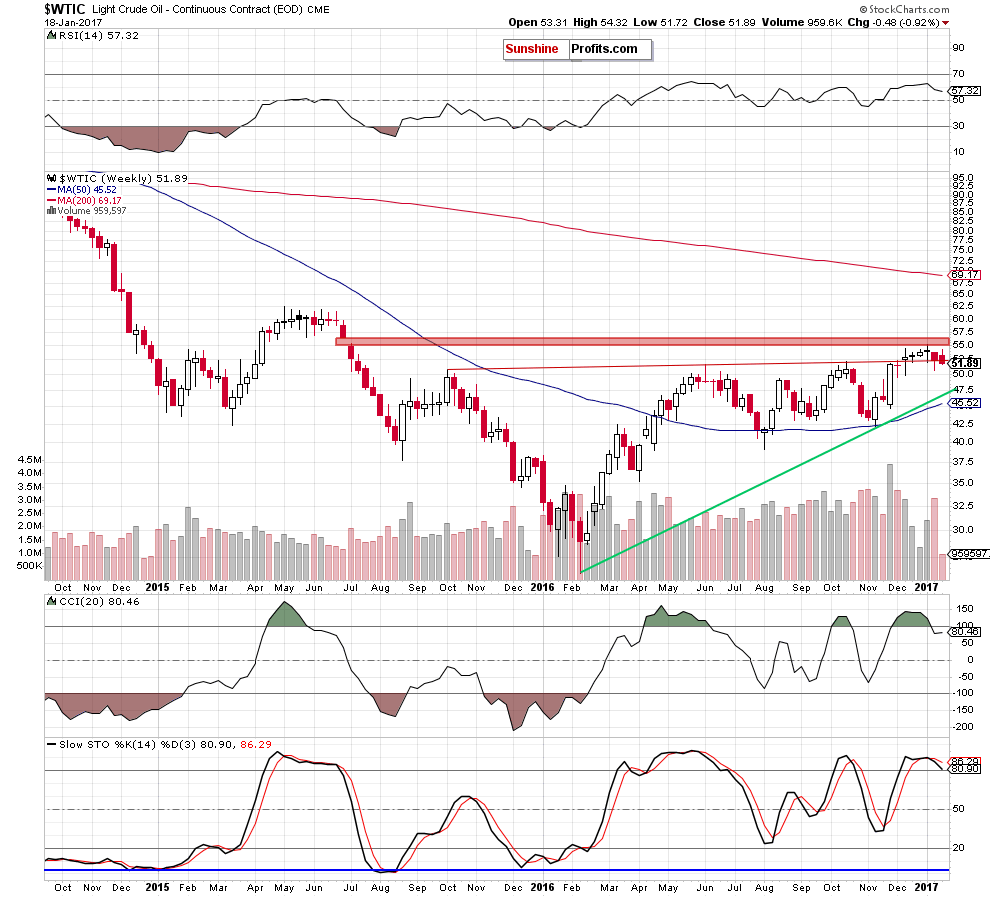
(…) although crude oil moved higher yesterday, the red gap continues to keep gains in check. Additionally, the sell signals generated by the indicators are still in play, supporting oil bears and another attempt to move lower.
From today’s point of view we see that the situation developed in line with the above scenario and crude came back below the previously-broken long-term red support/resistance line, invalidating the earlier breakout. This is a negative event, which together with the sell signals suggests further deterioration in the following days.
Having said the above let’s examine the daily chart and look for more bearish factors.
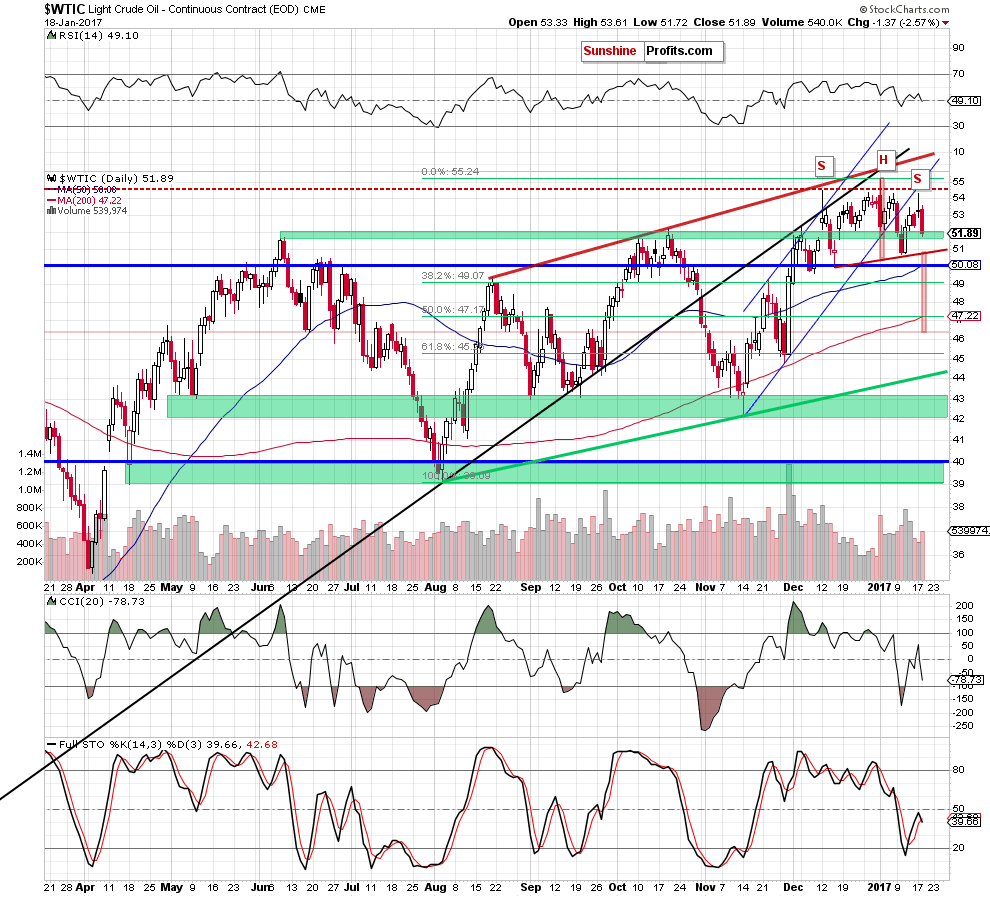
Looking at the very short-term chart, we see that crude oil extended losses and dropped under the October high. This move materialized on higher volume, which confirms the oil bears’ strength. Additionally, the CCI reversed and the Stochastic Oscillator re-generated a sell signal, which suggests that what we wrote yesterday is up-to-date also today:
(…) light crude not only hit a double top, but also declined below last week’s high, which doesn’t bode well for the commodity.
On top of that, when we take a closer look at the daily chart, we can notice a potential head and shoulders formation. If this is the case, yesterday’s move to the upside created the right shoulder of the pattern, suggesting lower prices of the black gold in the coming days.
How low could crude oil go in the near future? In our opinion, the initial downside target will be the neck line of the head and shoulders formation (around $50.89 at the moment of writing these words). If it is broken, we’ll see an acceleration of declines and a drop even to around $46.36, where the size of the downward move will correspond to the height of the mentioned formation.
Before we finish today’s alert we would also like to draw your attention to the relationship between the black gold and the precious metals.
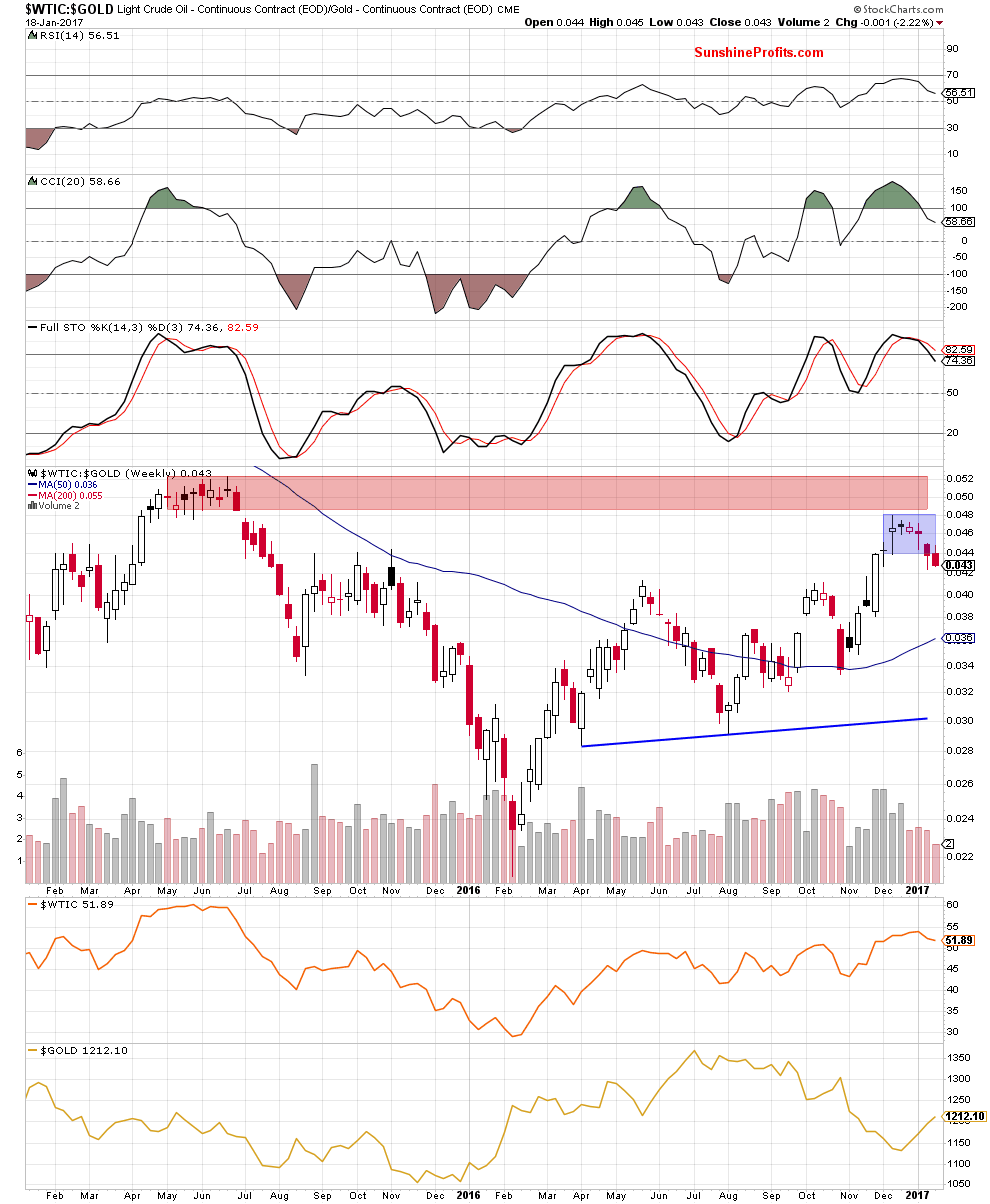
On the medium-term chart, we see that the oil-to-gold ratio declined under the lower border of the blue consolidation once again, which increases the probability of further deterioration in the coming week(s). If his is the case and we see such action, crude oil will also move lower, because the strong positive correlation between light crude and the ratio remains in place.
We can also notice one more bearish development on the medium-term chart of the oil-to-silver ratio.
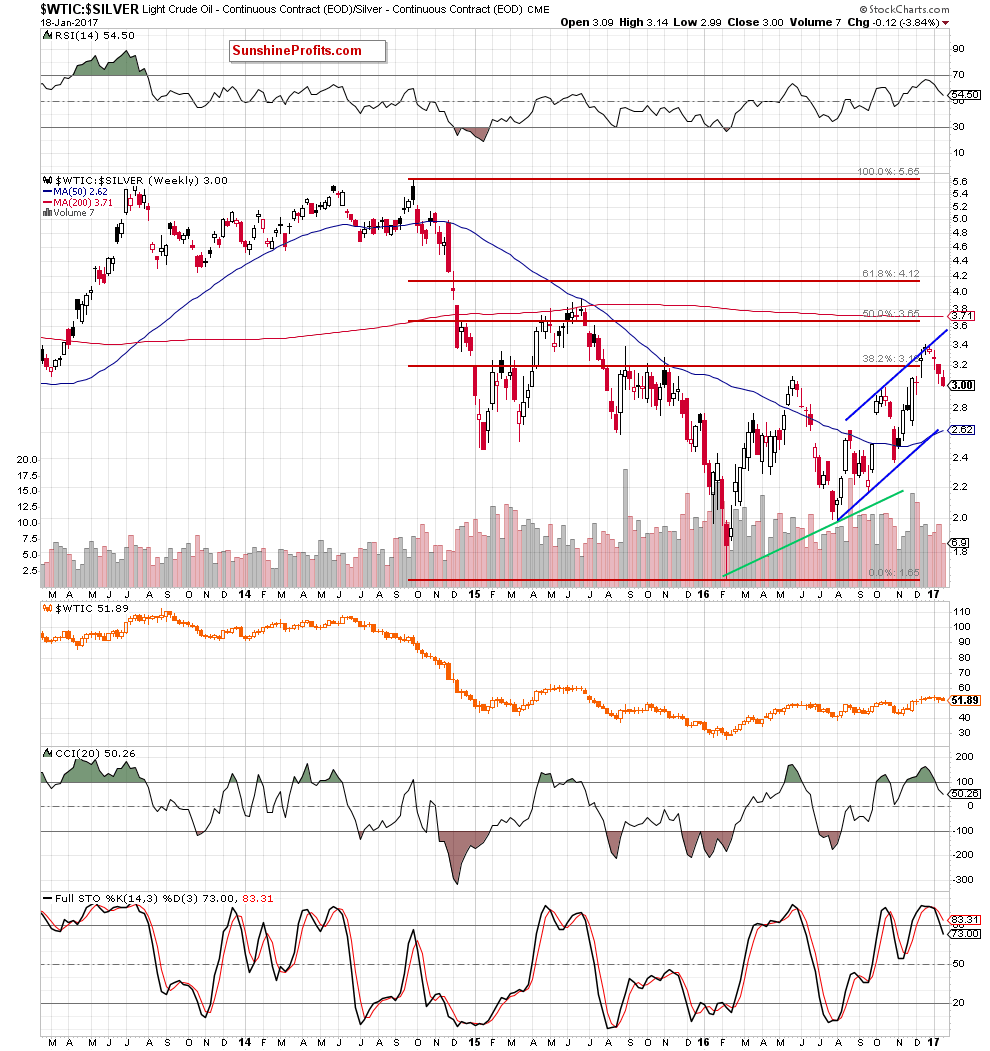
From this perspective we see that the invalidation of the breakout above the 38.2% Fibonacci retracement triggered further deterioration and a drop below last week’s low, which is a negative event. Additionally, there are also the sell signals generated by the indicators, which support oil bears and lower values of the ratio and crude oil.
Summing up, short positions continue to be justified as the double top formation, the potential head and shoulders pattern and the current situation in the oil-to-gold and oil-to-silver ratios suggest further deterioration in the coming days.
Very short-term outlook: bearish
Short-term outlook: bearish
MT outlook: bearish
LT outlook: mixed
trading position (short-term; our opinion): Short positions (with a stop-loss order at $56.45 and an initial downside target at $45.81) are justified from the risk/reward perspective. We will keep you informed should anything change, or should we see a confirmation/invalidation of the above.
As a reminder – “initial target price” means exactly that – an “initial” one, it’s not a price level at which we suggest closing positions. If this becomes the case (like it did in the previous trade) we will refer to these levels as levels of exit orders (exactly as we’ve done previously). Stop-loss levels, however, are naturally not “initial”, but something that, in our opinion, might be entered as an order.
Thank you.
Nadia Simmons
Forex & Oil trading Strategist
Przemyslaw Radomski, CFA
Founder, Editor-in-chief
Gold & Silver trading Alerts
Forex trading Alerts
Oil Investment Updates
Oil trading Alerts


