Oil trading Alert originally sent to subscribers on February 1, 2017, 9:16 AM.
trading position (short-term; our opinion): Short positions (with a stop-loss order at $56.45 and an initial downside target at $45.81) are justified from the risk/reward perspective.
Although oil bulls pushed crude oil above $53 yesterday, the solid resistance line stopped them once again, triggering another invalidation of the breakout. Additionally, the oil-to-gold and oil-to-silver ratios dropped under their supports. Is it enough to push crude oil to the barrier of $50 in the coming days?
Let’s examine the charts below to find out (charts courtesy of http://stockcharts.com).

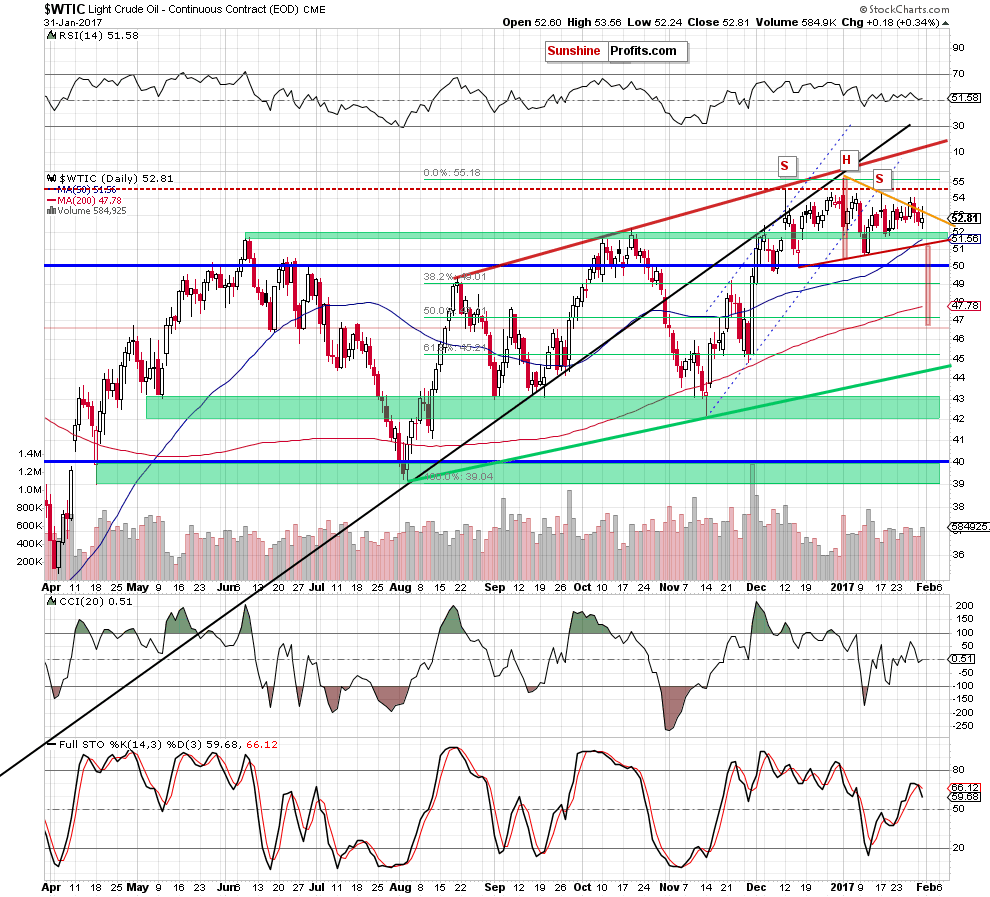
On the daily chart, we see that although crude oil climbed above the orange resistance line based on the previous highs, this improvement was very temporary and the commodity gave up some gains in the following hours. With this decline, the black gold slipped under the orange line, invalidating the earlier breakout for the third time in a row. In our opinion, such price action doesn’t bode well for oil bulls, suggesting that another bigger move to the downside is just around the corner.
Additionally, the sell signals generated by the weekly and daily indicators remain in place, suggesting further deterioration in the following days. Taking these facts into account, we believe that our previous commentaries remain up-to-date also today:
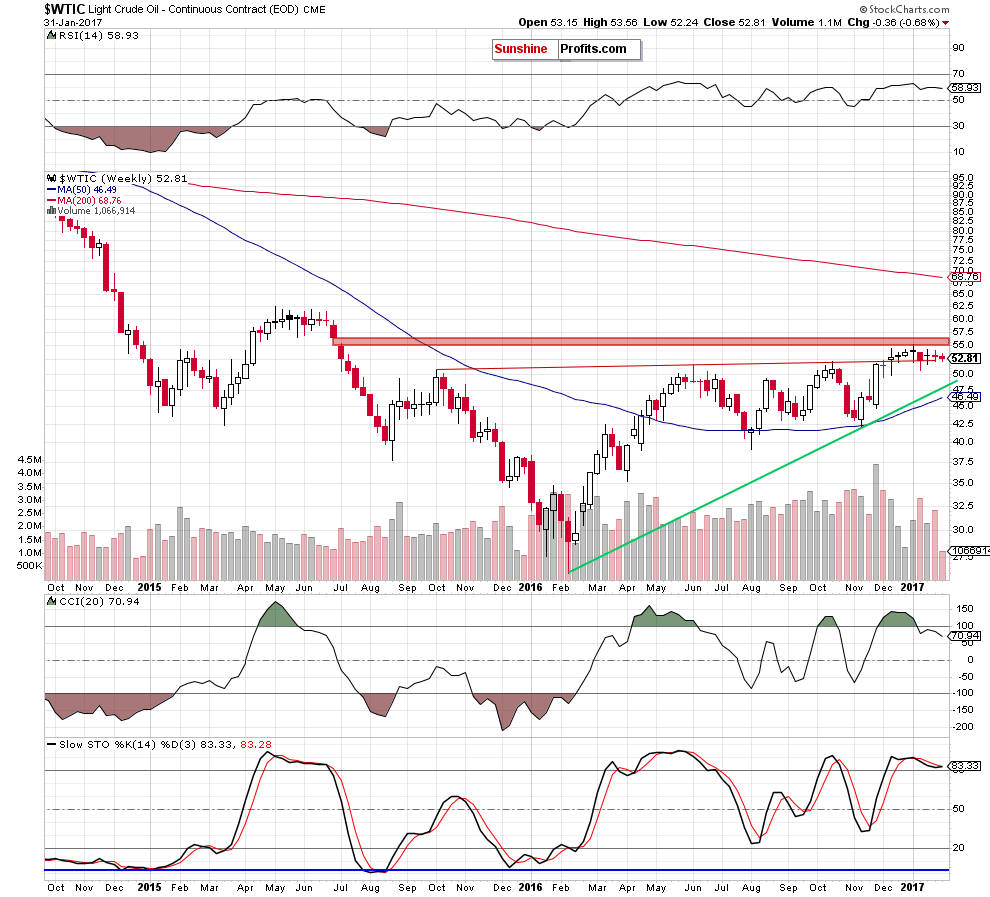
(…) crude oil is still trading in a narrow range between the previously-broken long-term red support/resistance line and the red gap, which continues to keep gains in check. Nevertheless, the sell signals generated by the indicators are still in play, supporting oil bears and another attempt to move lower.
(…) This scenario is also reinforced by the fact that light crude is still trading under the previous highs, which means that the double top formation and the potential head and shoulders pattern are still in place, suggesting another attempt to move lower in the coming days.
If this is the case and we see a decline from here, crude oil will re-test the green support zone and the long-term red line (seen on the weekly chart) once again in a very near future. If this area is broken, the next downside target will be the red support line based on the previous lows (the neck line of the potential head and shoulders formation).
Having said the above, let’s examine the current situation in the oil-to-gold ratio. Will it tell us more about future moves? Let’s check.
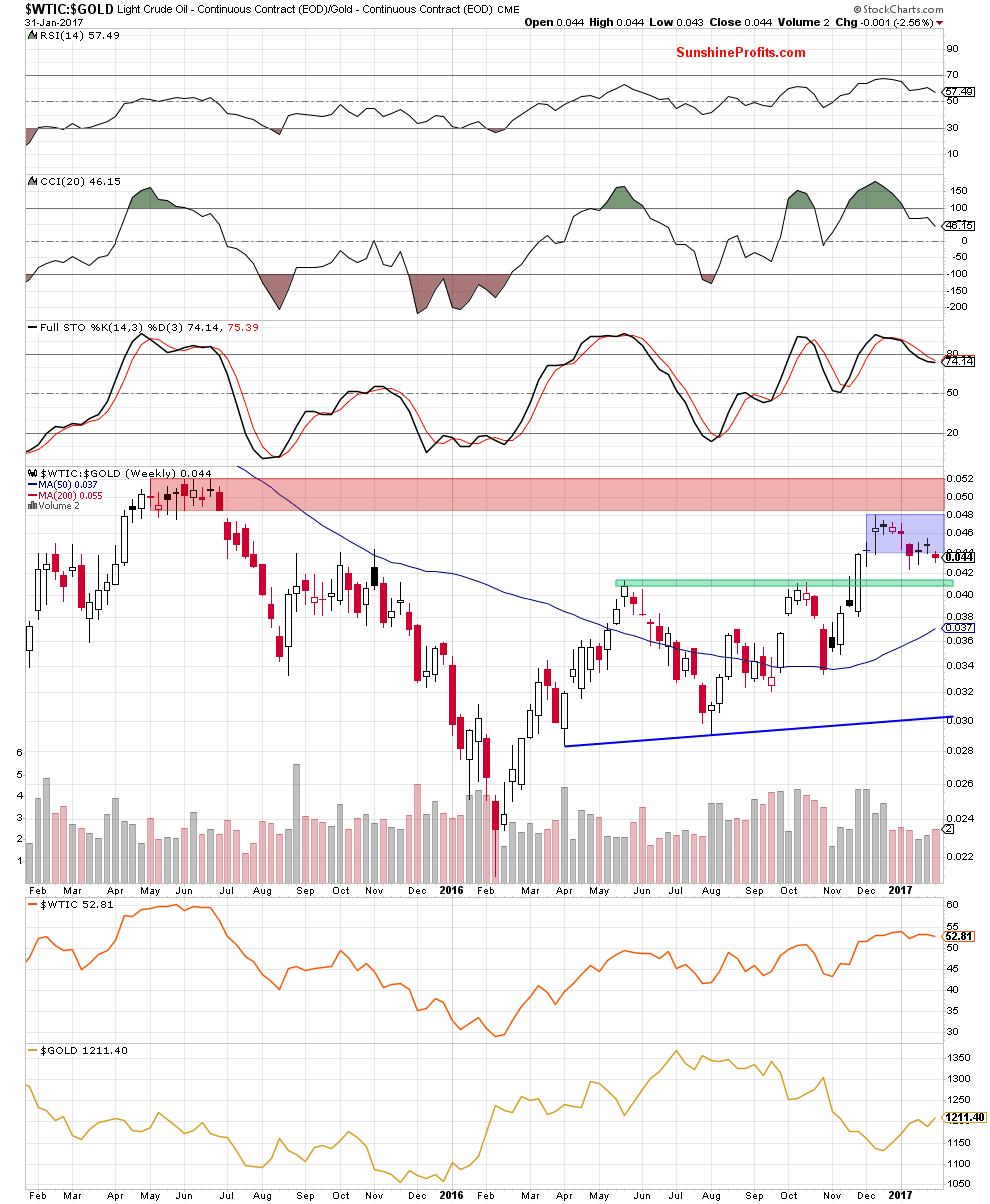
Looking at the weekly chart, we see that the ratio came back under the lower border of the blue consolidation, which together with the sell signals generated by the indicators suggests further deterioration in the coming week.
How did this drop affect the very short-term picture of the ratio? Let’s take a closer look at the daily chart and find out.
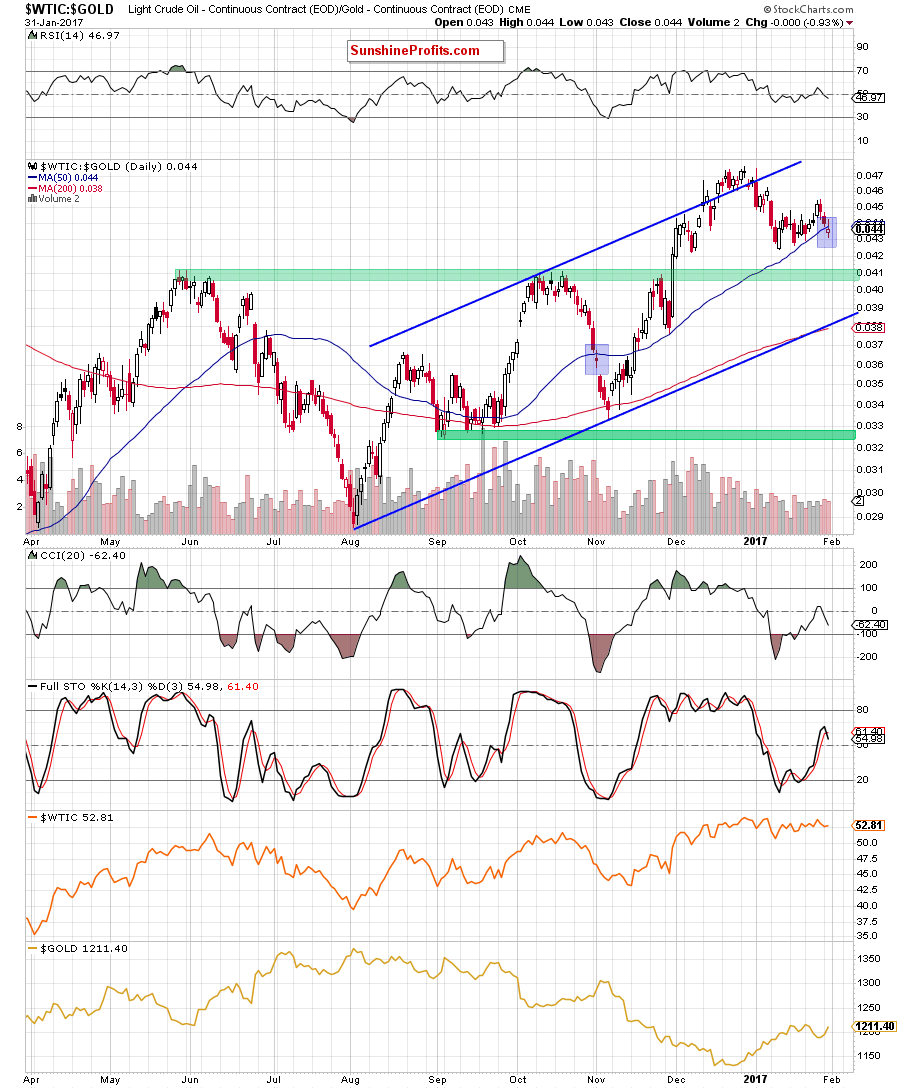
The first thing that catches the eye on the daily chart is the breakdown under the 50-day moving average. We saw a similar situation at the beginning of November (we marked both situations with blue). Back then, the breakdown encouraged the bears to act, which triggered further deterioration in the following days. Taking this fact and the sell signals generated by the indicators into account, we think that the ratio will extend losses in the near future, triggering another downswing in crude oil.
Additionally, this scenario is also reinforced by the relationship between crude oil and silver.
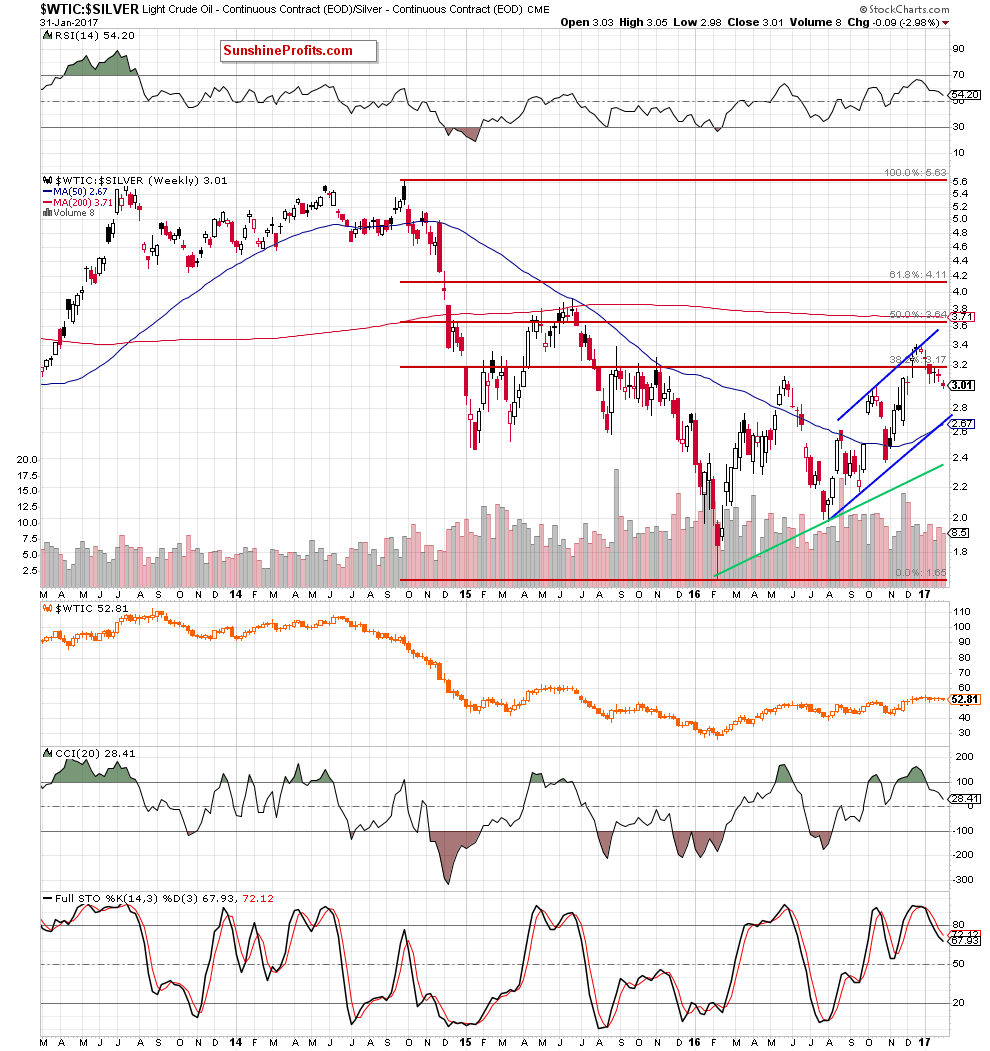
On the weekly chart, we see that the ratio closed another week under the previously-broken 38.2% Fibonacci, which together with the sell signals generated by the indicators suggest further deterioration (in the ratio and also in crude oil) in the coming weeks.
On top of that, when we take a closer look at the daily chart, we’ll another bearish sign.
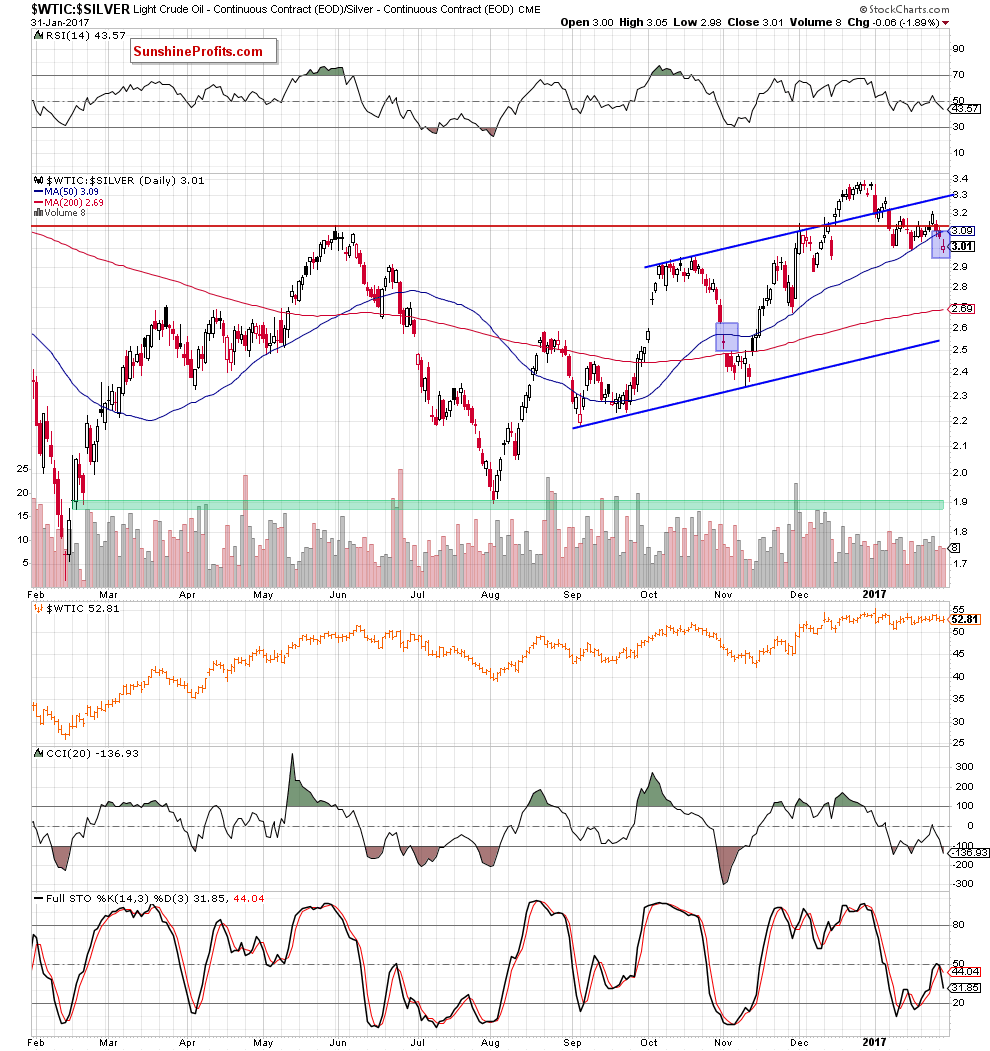
From this perspective, we see that the ratio declined and closed another session under the previously-broken 50-day moving average for the first time since mid-November, invalidating the earlier breakout. As you see on the chart, this support stopped the bears several times in the past, which means that the breakdown below it opened the way to lower levels. If this is the case, we’ll see lower values of the ratio and crude oil in the following days as positive correlation between them remains in place.
Summing up, short positions continue to be justified as crude oil invalidated the breakout above the orange resistance zone for the third time in a row, suggesting oil bulls’ weakness. Additionally, the current situation in the oil-to-gold and oil-to-silver ratios increases the probability of further declines not only in the ratios, but also in the black gold, suggesting another attempt to move lower in the coming days.
Very short-term outlook: bearish
Short-term outlook: bearish
MT outlook: bearish
LT outlook: mixed
trading position (short-term; our opinion): Short positions (with a stop-loss order at $56.45 and an initial downside target at $45.81) are justified from the risk/reward perspective. We will keep you – our subscribers – informed should anything change.
We will keep you – our subscribers – informed should anything change.
As a reminder – “initial target price” means exactly that – an “initial” one, it’s not a price level at which we suggest closing positions. If this becomes the case (like it did in the previous trade) we will refer to these levels as levels of exit orders (exactly as we’ve done previously). Stop-loss levels, however, are naturally not “initial”, but something that, in our opinion, might be entered as an order.
Since it is impossible to synchronize target prices and stop-loss levels for all the ETFs and ETNs with the main market that we provide this level for (crude oil), the stop-loss level and target price for popular ETN and ETF (among other: USO, DWTI, UWTI) are provided as supplementary, and not as “final”. This means that if a stop-loss or a target level is reached for any of the “additional instruments” (DWTI for instance), but not for the “main instrument” (crude oil in this case), we will view positions in both crude oil and DWTI as still open and the stop-loss for DWTI would have to be moved lower. On the other hand, if crude oil moves to a stop-loss level but DWTI doesn’t, then we will view both positions (in crude oil and DWTI) as closed. In other words, since it’s not possible to be 100% certain that each related instrument moves to a given level when the underlying instrument does, we can’t provide levels that would be binding. The levels that we do provide are our best estimate of the levels that will correspond to the levels in the underlying assets, but it will be the underlying assets that one will need to focus on regarding the sings pointing to closing a given position or keeping it open. We might adjust the levels in the “additional instruments” without adjusting the levels in the “main instruments”, which will simply mean that we have improved our estimation of these levels, not that we changed our outlook on the markets.
Thank you.
Nadia Simmons
Forex & Oil trading Strategist
Przemyslaw Radomski, CFA
Founder, Editor-in-chief, Gold & Silver Fund Manager
Gold & Silver trading Alerts
Forex trading Alerts
Oil Investment Updates
Oil trading Alerts


