The NIRP Crash Indicator which was in service during 2016 has been pulled out of retirement. The signal is now GREEN, which indicates that the S&P 500 at least for the short term will go higher. In my February article, I predicted that the highs for the 2009 Bull that were made in January of 2018 would not be eclipsed until the next secular Bull market.
The NIRP Crash Indicator has undergone a makeover and a name change to “Bull & Bear Tracker”. There is no longer a yellow signal. The old YELLOW was switched to the color GREEN and the old green which had never been used has been eliminated.
The proprietary indicator is being rushed back into service due to market volatility increasing substantially in 2018 as compared to 2017. The chart below depicts that for the first year of Mr. Trump’s Presidency the market had the lowest volatility for any year over the past 68 years.

The NIRP Crash Indicator’s was developed by myself in 2016 to monitor for potential crashes. The impetus for its development had been my concerns about the Bank of Japan’s (BoJ) instituting of a negative interest rate policy (NIRP) and the spreading of negative interest rates putting the global markets and banking systems on the verge of a crash. See “Here’s How Japan’s NIRP Increases the Probability of Global Market Crash” and “New Indicator to Predict Future Market Crashes”.

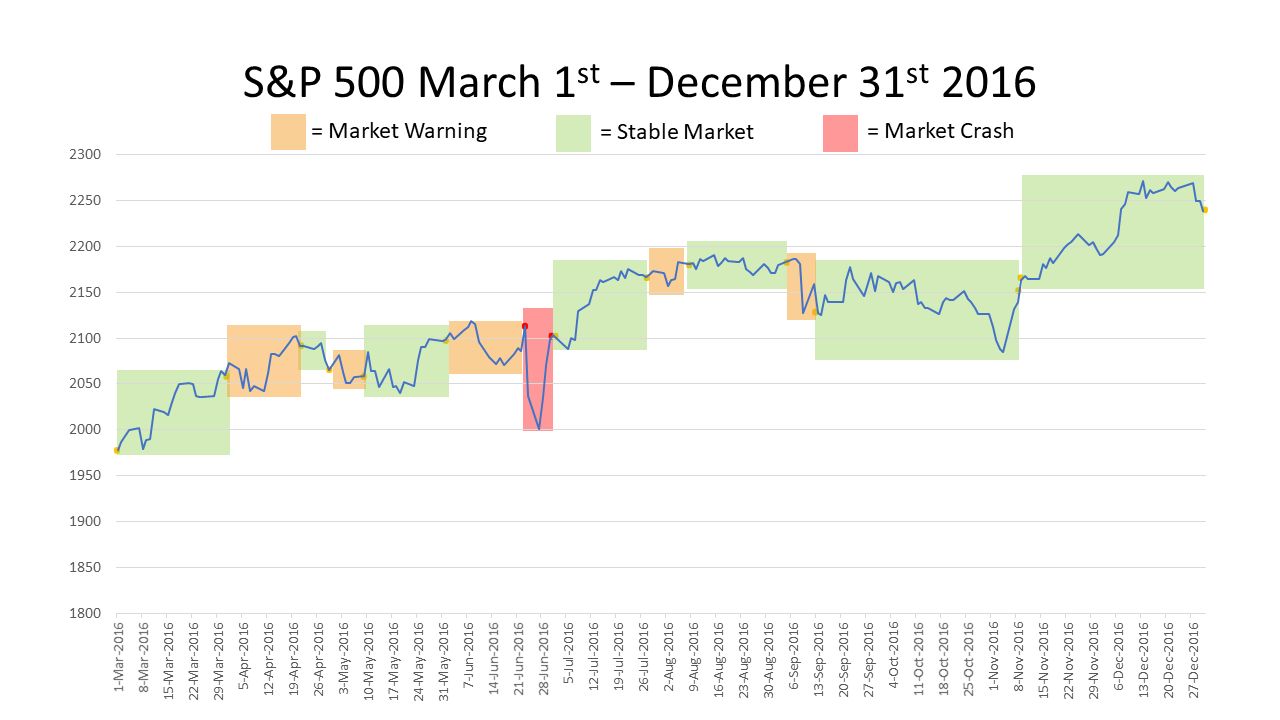
The signals were effective throughout 2016. From March 1, 2016, through December 31, 2016, the ORANGE signals predicted heightened volatility and the RED signal predicted the BREXIT crash. See www.equities.com article “NIRP Crash Indicator Signals Very Reliable for 2016” and chart below.
Due to the ebbing of the negative interest rates immediately after Mr. Trump’s election as President and the unprecedented period of low volatility the NIRP Crash Indicator was disengaged in March of 2017. See www.equities.com article “No Longer a Need for NIRP Crash Indicator Signals”.
In my reviewing of the NIRP Crash Indicator’s 2016 signals it dawned on me that the YELLOW or LONG signals could have been utilized by my readers at www.equities.com and also Seeking Alpha to trade leveraged ETFs such as the SPXL. I had never before given that consideration since I had been intently focused to develop the indicator to monitor for crashes. It had never occurred to me to see how an investor who utilized its yellow non-crash signal to purchase a triple leveraged S&P 500 ETF such as the SPXL would have performed.

Upon conducting further research, I calculated that an investor could have made a return of 36.79% from utilizing the indicator’s ORANGE, RED and YELLOW signals to trade the SPXL and also the SPXS, a triple leveraged S&P 500 short ETF. For each day during the 10-month March 1 through December 31, 2016 period that the NIRP Crash Indicator was monitoring the market one of the NIRP’s three signals had been in effect. The hypothetical returns based on trading the SPXL and SPXS compared to a gain of 13.4% for the S&P 500 and a net return of 4.2% for those investors who bought and held the two S&P 500 related ETFS during the 10-month period. See table below.

For more information about the Bull & Bear Tracker go to www.bullbeartracker.com. To insure access to all of my articles, reports and alerts covering the new bear market which was born on January 31, 2018 (see my February 6, article “BULL DEAD, BEAR DOB 01/31/18: Expect Stock Market Decline of at Least 50%”) go to www.profitfromthecrash.com.
For those investors who do not want to take minimal risk and yet have the potential for their portfolios to grow I am recommending the deployment of a 90/10 Crash Protection Strategy. For information on the strategy which is the only fail-safe strategy that one can utilize to protect their liquid assets from crashes, recessions and depressions view video below entitled “Crash! & 90/10 Crash Protection Strategy”.
Disclaimer. Mr. Markowski’s predictions are frequently ahead of the curve. The September 2007 predictions that appeared in his EquitiesMagazine.com column stated that share-price collapses of the five major brokers, including Lehman and Bear Stearns, were imminent. While accurate, they proved to be premature. For this reason he had to advise readers to get out a second time in his January 2008 column entitled “Brokerages and the Sub-Prime Crash”. His third and final warning to get out, and stay out, occurred in October of 2008 after Lehman had filed for bankruptcy. In that article “The Carnage for Financials Isn’t Over” he reiterated that share prices for Goldman and Morgan Stanley were too high. By the end of November 2008, the share prices of both had fallen by an additional 60% and 70%, respectively — new all-time lows.


