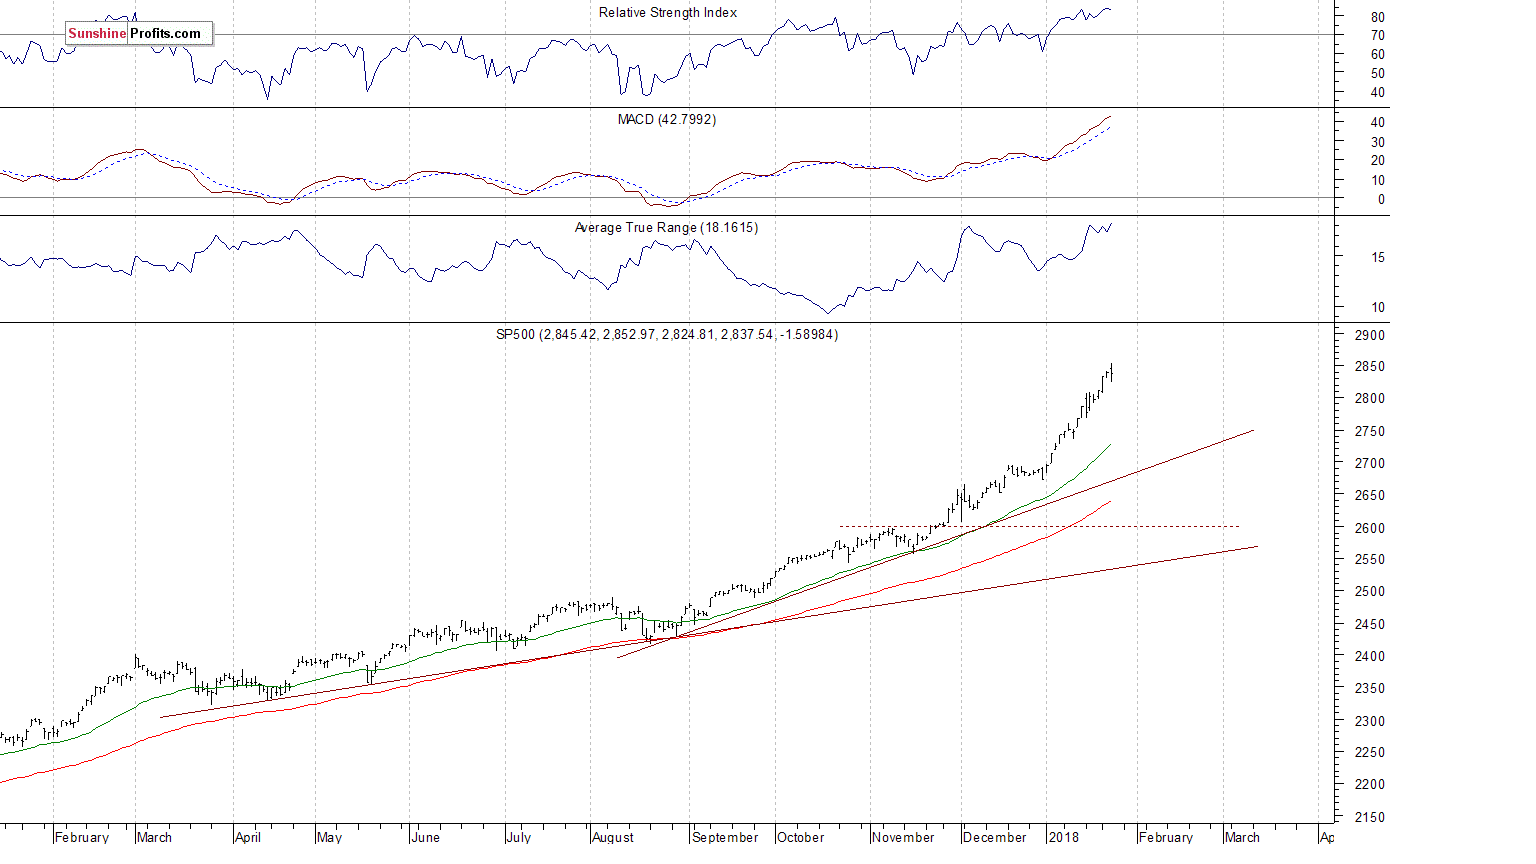
The main U.S. stock market indexes were mixed between -0.6% and +0.2% on Wednesday, as investors took some short-term profits off the table following recent record-breaking rally. The S&P 500 index has reached yet another new all-time high at the level of 2,852.97, before closing virtually flat (-0.1%). The Dow Jones Industrial Average has also reached new record high at the level of 26,392.80. It was relatively stronger than the broad stock market, as it gained 0.2%. The technology Nasdaq Composite was relatively weak, as it gained 0.6%. However, it has also reached new all-time high at 7,486.32 yesterday. The nearest important level of support of the S&P 500 index is at around 2,825-2,830, marked by recent local lows. The next support level is at 2,800-2,810, marked by previous resistance level. The support level is also at around 2,780, marked by local lows. The support level is the price level, at which the buying interest is strong enough to overcome selling pressure and push the price higher. Support usually refers to the previous low or lows, lines that are created by drawing the line between previous important bottoms or important tops and then extrapolating this line into the future. We still can see medium-term technical overbought conditions. However, the market continues its nine-year-long bull market:
Positive Expectations
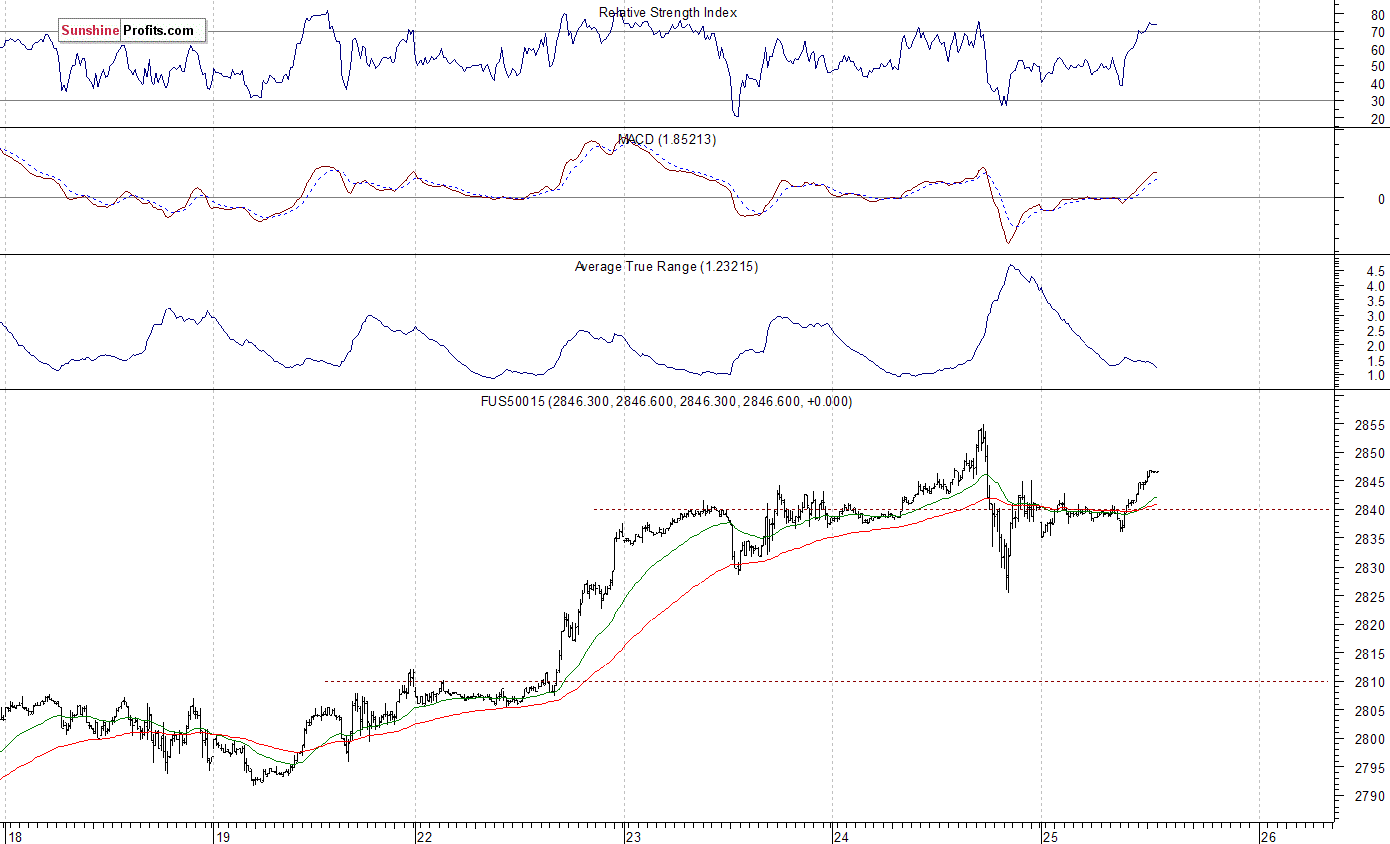
Expectations before the opening of today’s trading session are positive, because index futures trade 0.2-0.5% higher vs. their yesterday’s closing prices. The European stock market indexes have been mixed so far. Investors will wait for some economic data announcements: Initial Claims, Trade Balance at 8:30 a.m., New Home Sales, Leading Indicators at 10:00 a.m. The market expects that New Home Sales were at 679,000 in December. The S&P 500 futures contract trades within an intraday uptrend, as it retraces most of its yesterday’s move down. The market gets closer to its record high again. The nearest important level of resistance is at around 2,850-2,855, marked by that record high. On the other hand, support level is at 2,835-2,840, marked by short-term consolidation. The next level of support remains at 2,825-2,830, marked by yesterday’s daily low. The futures contract trades within a short-term consolidation along the level of 2,840, as we can see on the 15-minute chart:

Nasdaq Also Higher
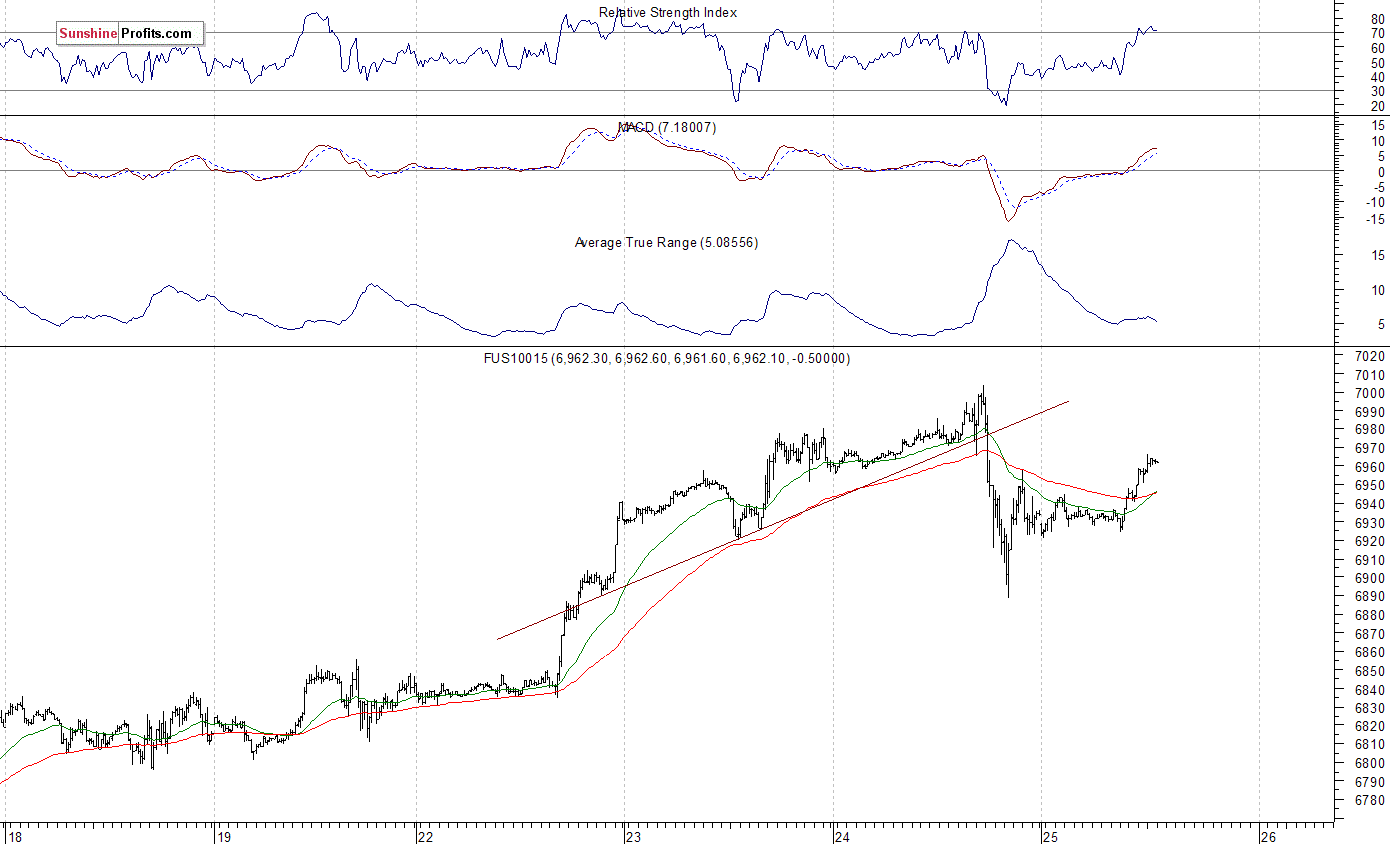
The technology Nasdaq 100 futures contract follows a similar path, as it retraces its Wednesday’s sell-off this morning. Will the uptrend extend? Potential resistance level is at around 7,000, marked by new record high. On the other hand, support level is at 6,930, and the next level of support is at 6,880-6,900. The Nasdaq 100 futures contract broke below its short-term upward trend line yesterday, as the 15-minute chart shows:
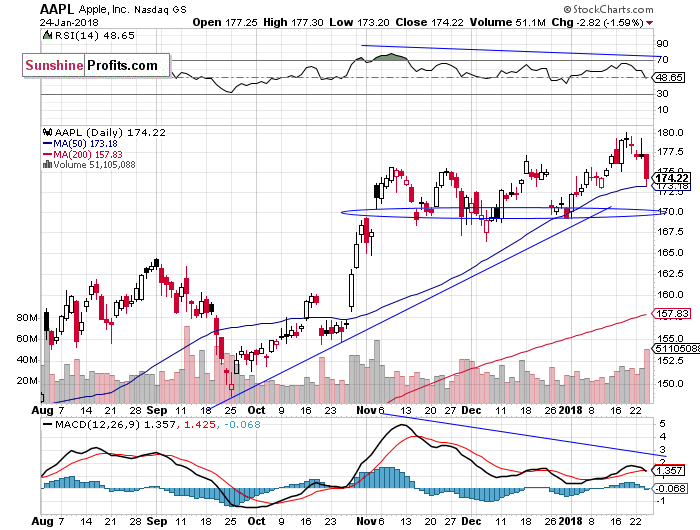
Let’s take a look at Apple, Inc. stock (AAPL) daily chart (chart courtesy of http://stockcharts.com). The stock reached new record high on a week ago, following short-term consolidation along the support level of $175. The market got closer to $180 mark, but it failed to continue its short-term uptrend. Consequently, the stock retraced its recent advance yesterday. We still can see some negative technical divergences. The most common divergences are between asset’s price and some indicator based on it (for instance the index and RSI based on the index). In this case, the divergence occurs when price forms a higher high and the indicator forms a lower high. It shows us that even though price reaches new highs, the fuel for the uptrend starts running low.
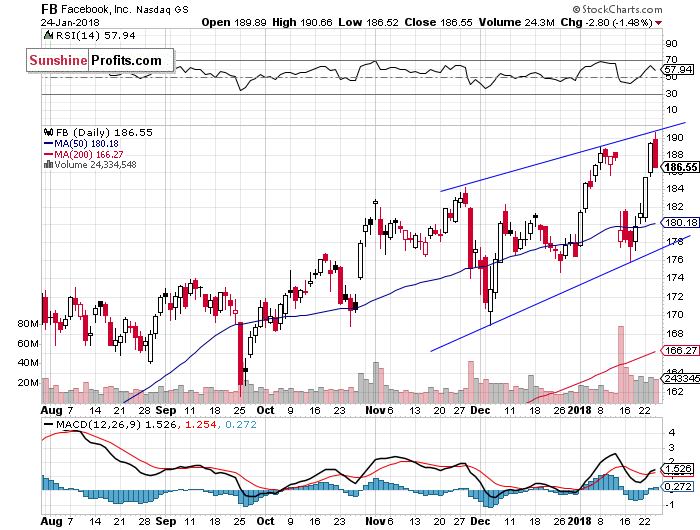
Facebook, Inc. stock (FB) reached new record high yesterday, as it got broke slightly above $190 mark. However, it quickly reversed that advance following bouncing off its two-month-long upward trading channel upper boundary resistance level. Is this an uptrend reversal or just downward correction before gaining ahead of quarterly earnings release on January 31?
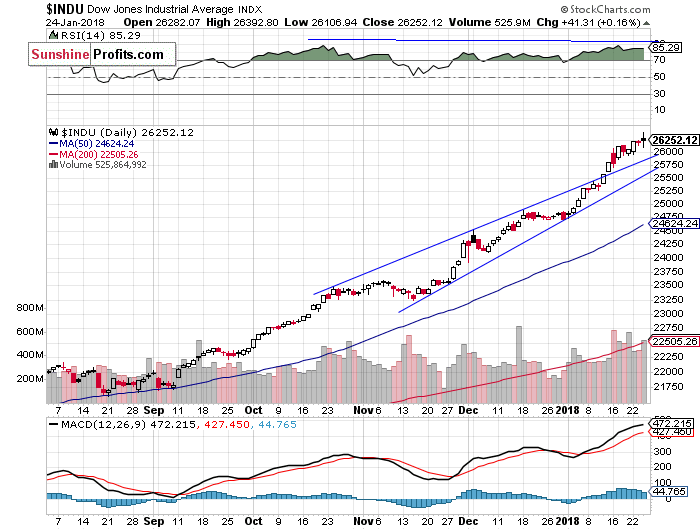
The Dow Jones Industrial Average daily chart shows that blue-chip index reached new record high yesterday, as it continued its short-term uptrend following breakout above 26,000 mark. However, the market closed just 0.2% higher after retracing some of its recent rally. We still can see medium-term negative technical divergences, but the index trades above its two-month-long rising wedge pattern (failed uptrend reversal pattern):
Concluding, the S&P 500 index lost 0.1% on Wednesday, following an intraday reversal off new record high at the level of 2,852.97. The broad stock market continued its almost month-long bullish euphoria run. The index is currently trading around 6% above its December 29 yearly closing price. Is this some medium-term topping pattern before uptrend reversal? There have been no confirmed negative signals so far. However, we still can see medium-term overbought conditions. We can use indicators such as Relative Strength Index (RSI), Stochastic Oscillator, Money Flow Index to identify overbought conditions. For example, one can view a given market as “overbought” if the RSI indicator for this market is above 70. Paying attention to the overbought/oversold status of the market is very useful, but there are many other factors that need to be considered before placing a trade.
If you enjoyed the above analysis and would like to receive free follow-ups, we encourage you to sign up for our daily newsletter – it’s free and if you don’t like it, you can unsubscribe with just 2 clicks. If you sign up today, you’ll also get 7 days of free access to our premium daily Gold & Silver Trading Alerts. Sign up today!.
Thank you.
Paul Rejczak
Stock Trading Strategist
Stock Trading Alerts
Sunshine Profits – Free Stock Market Analysis


