Briefly:
Intraday trade: Our yesterday’s intraday trading outlook was bearish. It proved wrong because the S&P 500 index gained 0.2% again. However, the index continued to trade within relatively narrow intraday trading range. The market may retrace some of its recent rally today, as investors continue taking short-term profits off the table. Therefore, intraday short position is favored again. Stop-loss is at the level of 2,565 and potential profit target is at 2,530 (S&P 500 index).
Our intraday outlook is bearish today. Our short-term outlook is neutral, and our medium-term outlook is neutral:
Intraday outlook (next 24 hours): bearish
Short-term outlook (next 1-2 weeks): neutral
Medium-term outlook (next 1-3 months): neutral
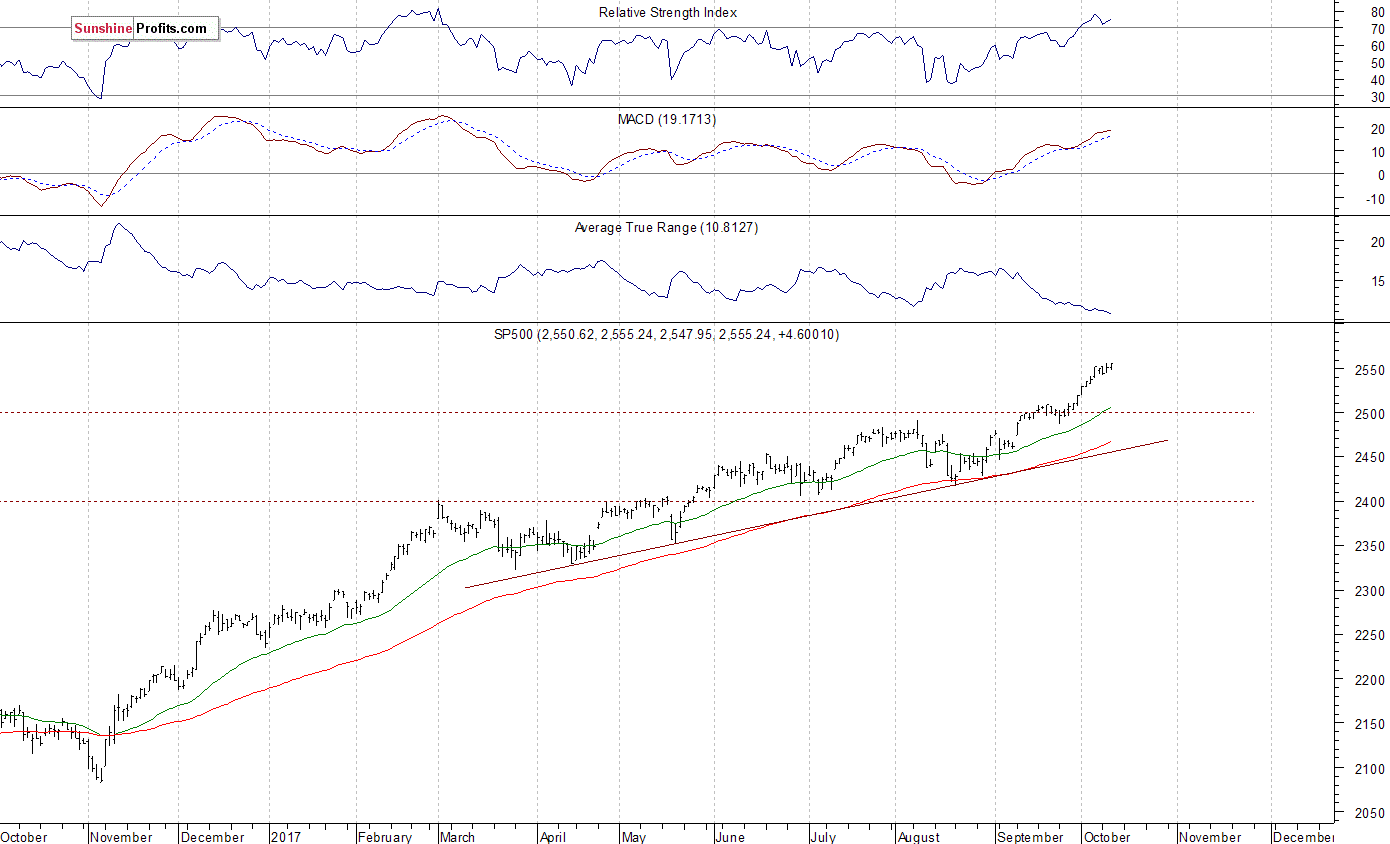
The main U.S. stock market indexes gained 0.2% on Wednesday, slightly extending their short-term uptrend, as investors’ sentiment remained bullish following yesterday’s FOMC Minutes release, among others. The S&P 500 index has reached yet another new all-time high at the level of 2,555.24, just 0.01 point above its Tuesday’s high. The broad stock market extends its short-term consolidation, as investors take some profits off the table following recent rally. The Dow Jones Industrial Average reached new record high at the level of 22,872.89 yesterday, as it gained 0.2%. The technology Nasdaq Composite remained slightly below its Tuesday’s record high of 6,608.30. The nearest important level of support of the S&P 500 index is still at around 2,540, marked by recent fluctuations. The next support level is at 2,520-2,530, marked by last week’s Tuesday’s daily gap up of 2,519.44-2,520.40 and short-term local lows. The support level is also at 2,500-2,510, marked by previous level of resistance and local highs. On the other hand, resistance level is at 2,550-2,555, marked by the above-mentioned new all-time high. The S&P 500 index accelerated its uptrend recently. We still can see medium-term negative technical divergences along with technical overbought conditions. However, there have been no confirmed negative signals so far:

Will Stocks Continue Higher?
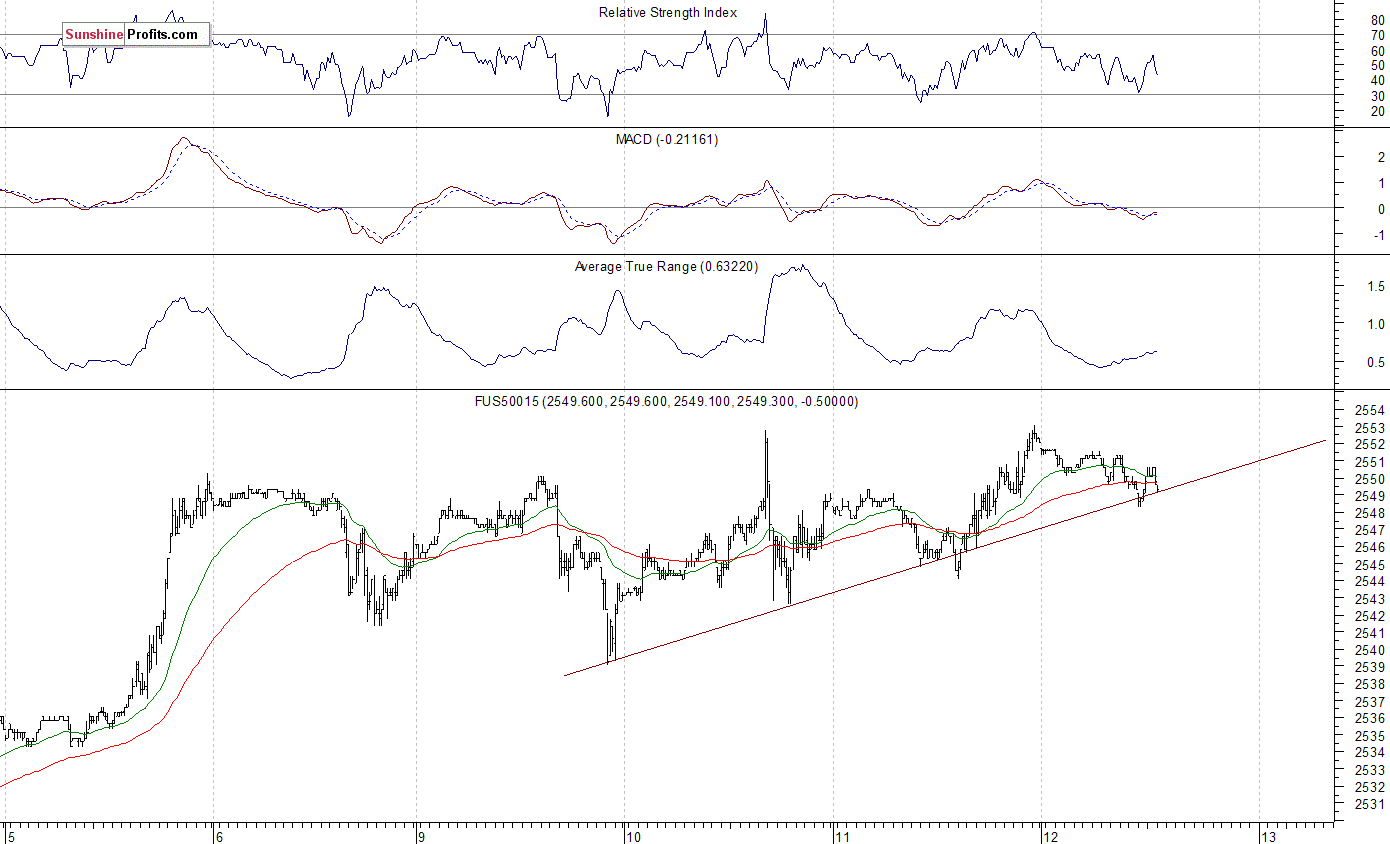
Expectations before the opening of today’s trading session are virtually flat, with index futures currently between -0.1% and 0.0% vs. Wednesday’s closing prices. The European stock market indexes have been mixed so far. Investors will now wait for some economic data announcements: Producer Price Index, Initial Claims at 8:30 a.m. The market expects that Producer Price Index grew 0.4% in August (core number +0.2%). The S&P 500 futures contract trades within an intraday consolidation, as it extends its fluctuations along new record high. The nearest important resistance level remains at around 2,550-2,555, marked by record high. On the other hand, level of support is at 2,535-2,540, marked by previous resistance level and some local lows. The next support level is at 2,530, marked by short-term consolidation. The support level is also at 2,520-2,525, marked by local lows. The futures contract trades along its short-term upward trend line, as we can see on the 15-minute chart:
Nasdaq Still At Record High
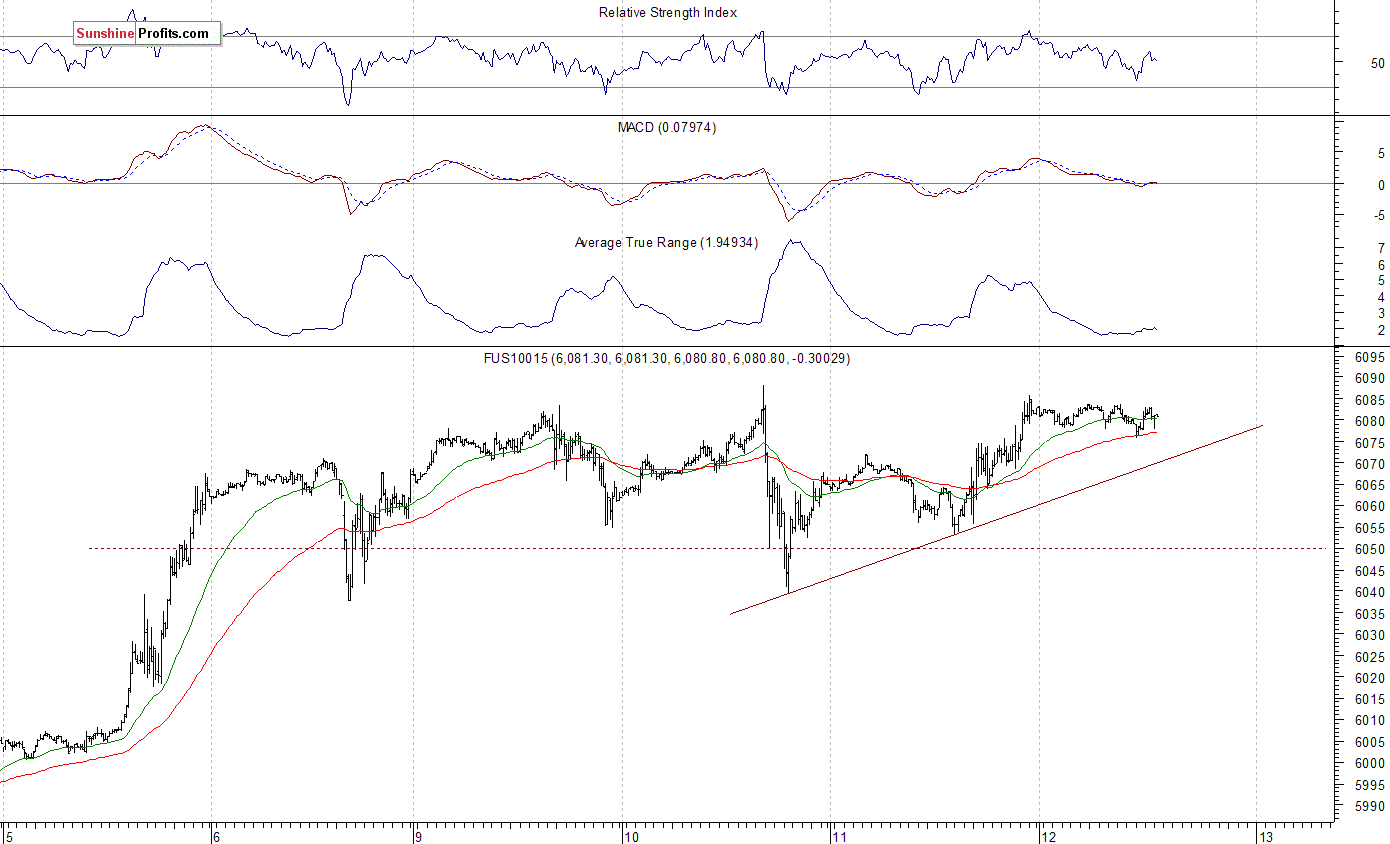
The technology Nasdaq 100 futures contract trades along its Tuesday’s new record high. It continues to fluctuate close to 6,000 mark following recent move up. The nearest important level of resistance is at around 6,080-6,100. On the other hand, support level remains at around 6,040-6,050, marked by short-term local lows. The next support level remains at 6,000-6,020, marked by previous level of resistance. The Nasdaq 100 futures contract extends its short-term fluctuations, as the 15-minute chart shows:
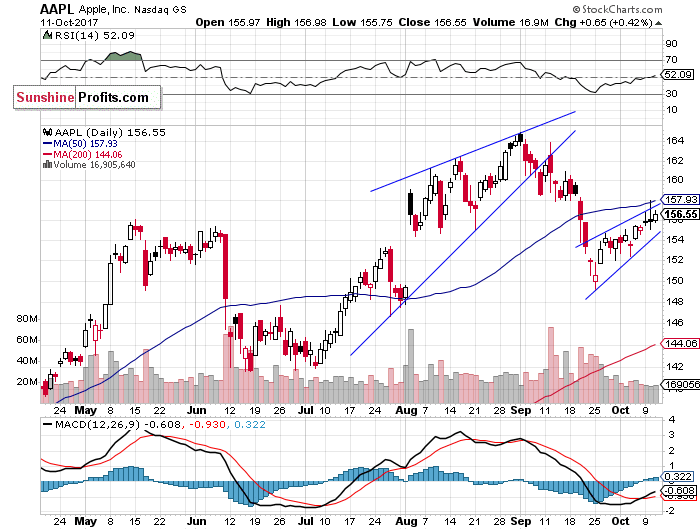
Let’s take a look at Apple, Inc. stock (AAPL) daily chart (chart courtesy of http://stockcharts.com) again. It remains relatively weaker than record-breaking broad stock market indexes. The stock price bounced off support level at around $150 at the end of September. It retraced some of its early September decline. Is this a new uptrend or just upward correction? We can see some potential negative rising wedge – bear flag pattern. Will it break lower?
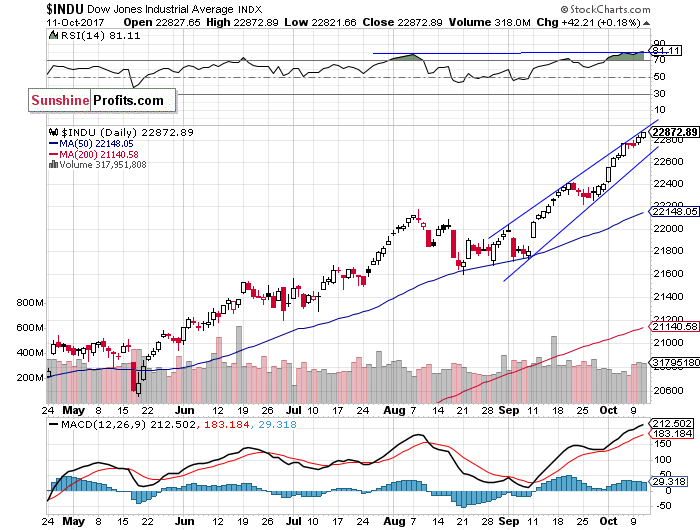
Now, let’s take a look at the Dow Jones Industrial Average daily chart (chart courtesy of http://stockcharts.com). The blue-chip index reaches new record highs, as it gets closer to 23,000 mark. There have been no confirmed negative signals so far. However, we still can see some negative technical divergences. The price continues higher, while technical indicator like RSI (Relative Strength Index) forms a lower high or remains at the same level. It shows us that even though price reaches new highs, the fuel for the uptrend starts running low. Bearish divergence is a moderately useful tool for detecting a coming reversal in the bullish trend, therefore it needs a confirmation. We can see relatively steep month-long upward trading channel or a negative rising wedge pattern. Is this a topping pattern?
Concluding, the S&P 500 index remained close to its record high on Wednesday, as investors reacted to the FOMC Minutes release, among others. Will uptrend continue? Or is this some topping pattern before downward correction? There have been no confirmed negative signals so far. However, we can see technical overbought conditions, along with very bullish investors’ sentiment. The broad stock market may retrace some of its recent advance at some point.
If you enjoyed the above analysis and would like to receive free follow-ups, we encourage you to sign up for our daily newsletter – it’s free and if you don’t like it, you can unsubscribe with just 2 clicks. If you sign up today, you’ll also get 7 days of free access to our premium daily Gold & Silver Trading Alerts. Sign up today!.
Thank you.
Paul Rejczak
Stock Trading Strategist
Stock Trading Alerts


