Briefly:
Intraday trade: Our Friday’s intraday trading outlook was neutral. It proved wrong because the S&P 500 index gained 0.5%, following higher opening of the trading session. The broad stock market accelerated its uptrend on Friday. There have been no confirmed negative signals so far. On the other hand, we still can see some short-term overbought conditions. Therefore, we prefer to be out of the market today, avoiding low risk/reward ratio trades.
Our intraday outlook is neutral today. Our short-term outlook is neutral, and our medium-term outlook is neutral:
Intraday outlook (next 24 hours): neutral
Short-term outlook (next 1-2 weeks): neutral
Medium-term outlook (next 1-3 months): neutral
The main U.S. stock market indexes gained between 0.4% and 0.7% on Friday, extending their long-term uptrend, as investors’ sentiment remained very bullish following Thursday’s rebound off support level. The S&P 500 index has reached new record high at the level of 2,575.44. The Dow Jones Industrial Average reached another all-time high at the level of 23,328.84. It accelerated its recent run-up, as investors were euphorically buying blue-chip stocks. The technology Nasdaq Composite was relatively weaker than the broad stock market. However, it reached new record high at the level of 6,640.03, around 0.1% above its Wednesday’s high. The nearest important level of support of the S&P 500 index is now at around 2,565, marked by Friday’s daily gap up of 2,562.36-2,567.56. The next support level remains at around 2,550, marked by previous level of resistance, among others. The next support level is at 2,540, marked by recent fluctuations. On the other hand, potential resistance level is at around 2,600. The S&P 500 index accelerated its uptrend, as it broke above recent consolidation. Will it continue even higher? There have been no confirmed negative signals so far. However, we can see some medium-term technical overbought conditions:

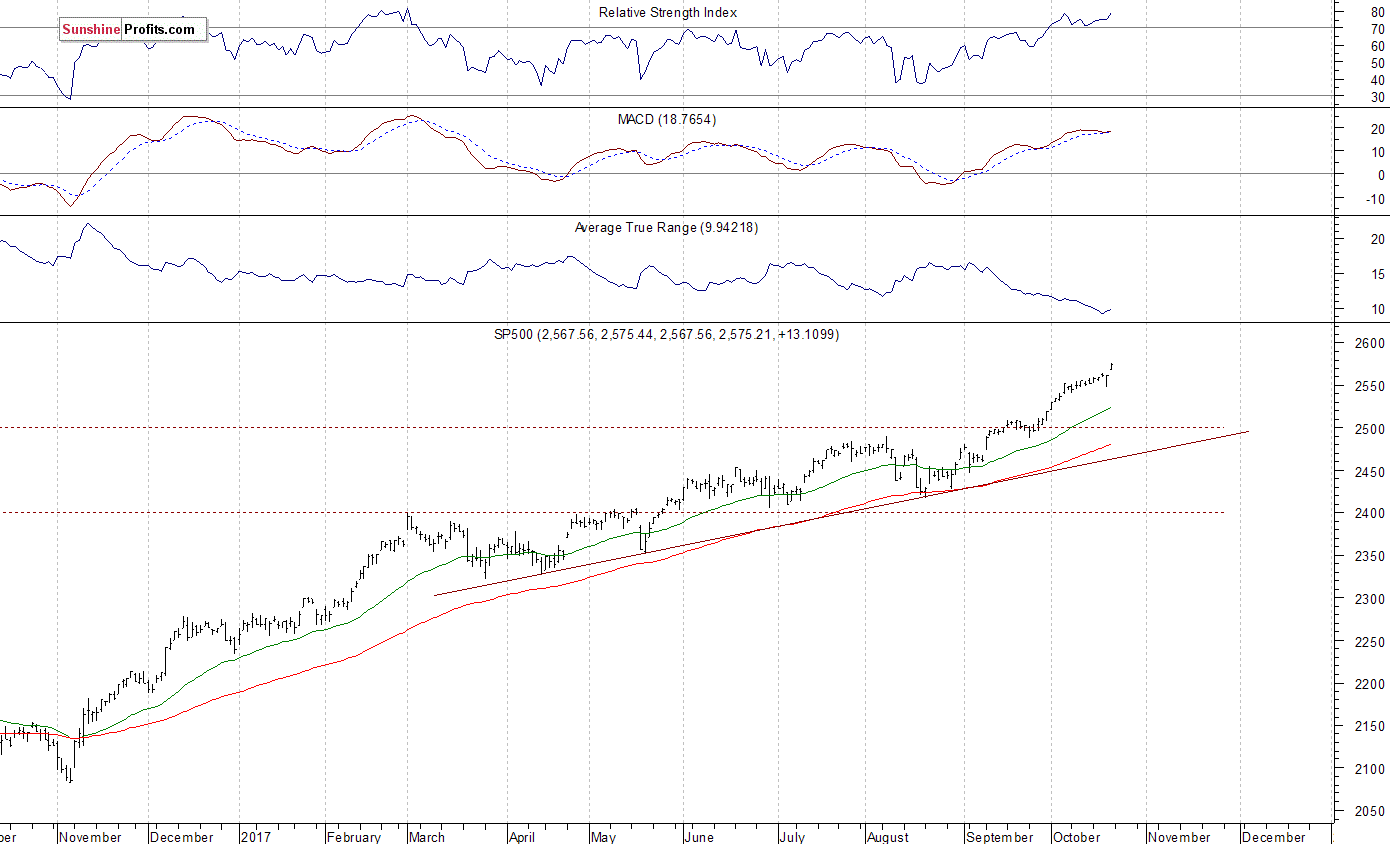
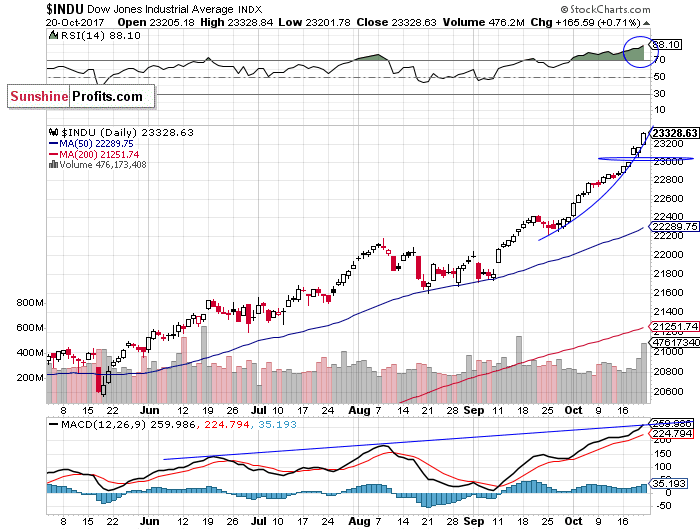
Close To New Record High
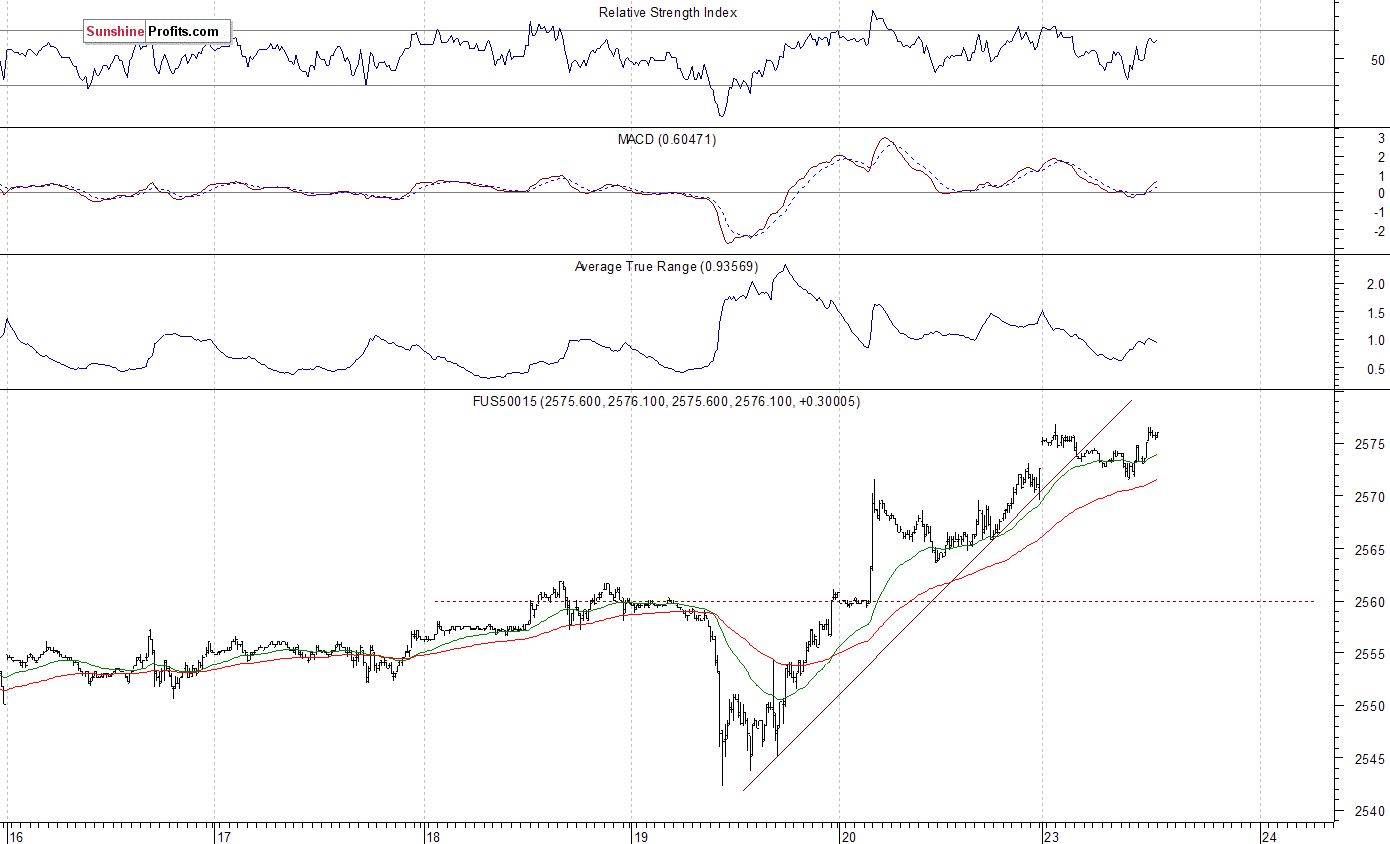
Expectations before the opening of today’s trading session are slightly positive, with index futures currently between +0.1% and +0.2% vs. their Friday’s closing prices. The European stock market indexes have gained 0.2-0.5% so far. There will be no new important economic data announcements. However, investors will wait for quarterly corporate earnings releases. The S&P 500 futures contract trades within an intraday consolidation, following an overnight rally. The market has reached new record high above the level of 2,575. The nearest important support level is at 2,565-2,570, marked by recent fluctuations. The next level of support remains at 2,560, marked by Wednesday’s local high. The futures contract trades close to its new record high, as we can see on the 15-minute chart:
Nasdaq Still Relatively Weaker
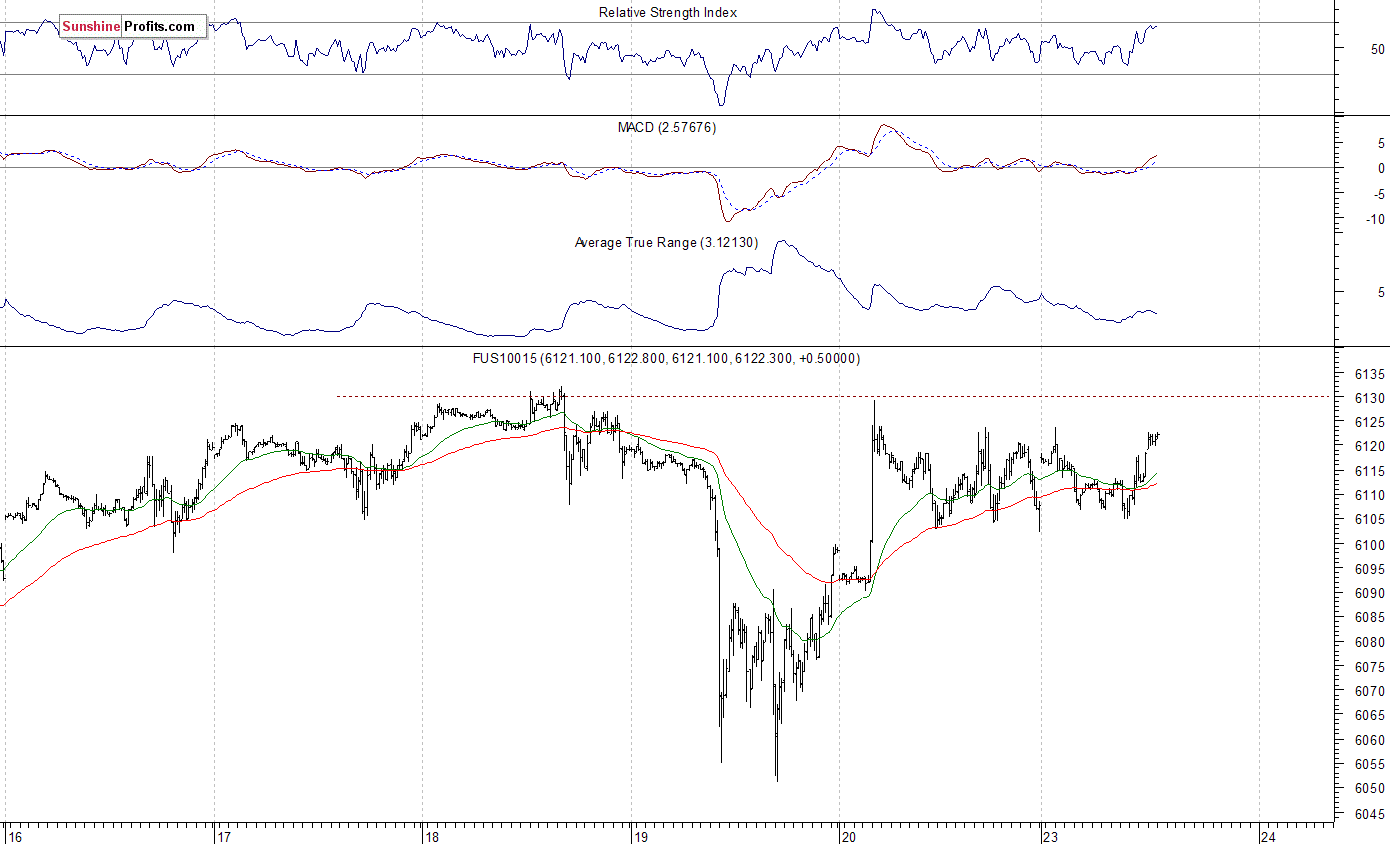
The technology Nasdaq 100 futures contract trades within an intraday consolidation, as it extends its Friday’s uncertainty. The market fluctuates along record high, close to resistance level of 6,130. The support level remains at 6,080-6,100. The next support level is at around 6,050, marked by Thursday’s daily low. The Nasdaq 100 futures contract extends its fluctuations along last week’s highs, as the 15-minute chart shows:
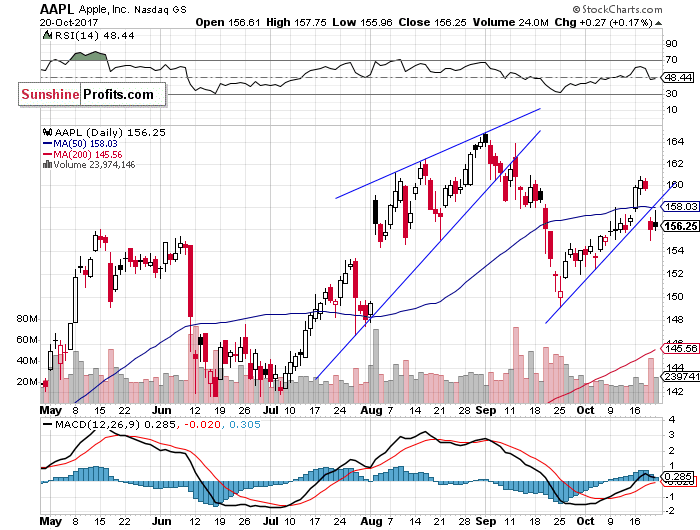
Let’s take a look at Apple, Inc. stock (AAPL) daily chart (chart courtesy of http://stockcharts.com) again. The stock remains relatively weaker than record-breaking broad stock market gauges. It broke below its short-term upward trend line on Thursday, after reaching resistance level of $160. The stock price bounced off support level at around $150 at the end of September. Is this a new downtrend or just downward correction following recent advance?
The Dow Jones Industrial Average daily chart (chart courtesy of http://stockcharts.com) shows that blue-chip index accelerated its long-term uptrend last week. There have been no confirmed negative signals so far. However, we can see technical overbought conditions. Is this a medium-term blow-off top pattern?
Concluding, the S&P 500 index continued its long-term uptrend on Friday, as it reached new all-time high at the level of 2,575.44. Investors’ sentiment remained very bullish ahead of quarterly earnings releases. There have been no confirmed negative signals so far. However, we still can see technical overbought conditions. Is this some medium-term topping pattern before downward correction?
If you enjoyed the above analysis and would like to receive free follow-ups, we encourage you to sign up for our daily newsletter – it’s free and if you don’t like it, you can unsubscribe with just 2 clicks. If you sign up today, you’ll also get 7 days of free access to our premium daily Gold & Silver Trading Alerts. Sign up today!.
Thank you.
Paul Rejczak
Stock Trading Strategist
Stock Trading Alerts


