The U.S. stock market indexes were mixed between -0.5% and +0.3% on Friday, extending their short-term fluctuations, as investors continued to hesitate ahead of the quarterly corporate earnings releases, among other factors. The S&P 500 index is currently 5.9% below its September the 21st record high of 2,940.91. The Dow Jones Industrial Average gained 0.3% and the Nasdaq Composite lost 0.5% on Friday.
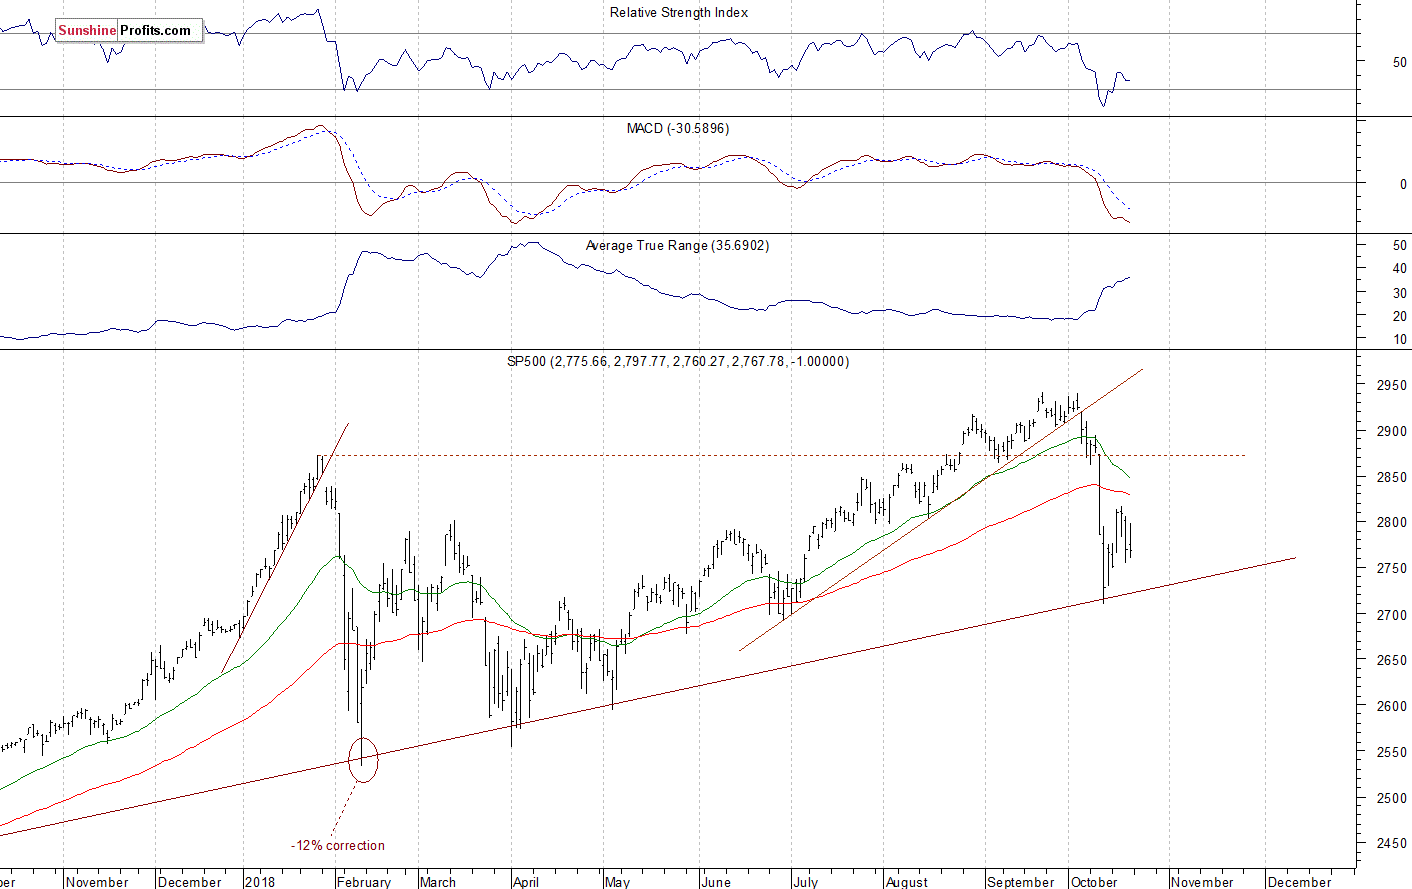
The nearest important level of resistance of the S&P 500 index remains at around 2,780-2,800, marked by the recent fluctuations. The next resistance level is at 2,825-2,830. On the other hand, the nearest important level of support is at 2,750, marked by the recent local lows. The support level is also at 2,710-2,730, marked by October the 11th local low and the long-term trend line.
The broad stock market continued retracing its medium-term advance recently, as it got closer to 2,700 mark. Then it retraced some of the short-term decline. On Tuesday a week ago the index broke above the resistance level of around 2,800. On Wednesday we saw a short-term consolidation. Then stocks sold off again on Thursday. Will the market resume its downtrend and break below the long-term trend line? The support level remains slightly above 2,700 mark:

Positive Expectations
Expectations before the opening of today’s trading session are positive, because the index futures contracts trade between +0.3% and +0.5% vs. their Friday’s closing prices. The European stock market indexes have gained 0.3-0.6% so far. There will be no new important economic data announcements today. The broad stock market will likely extend its short-term consolidation. For now, it looks like a consolidation following the recent sell-off. If the S&P 500 breaks below the support level of 2,700, we could see more selling pressure.
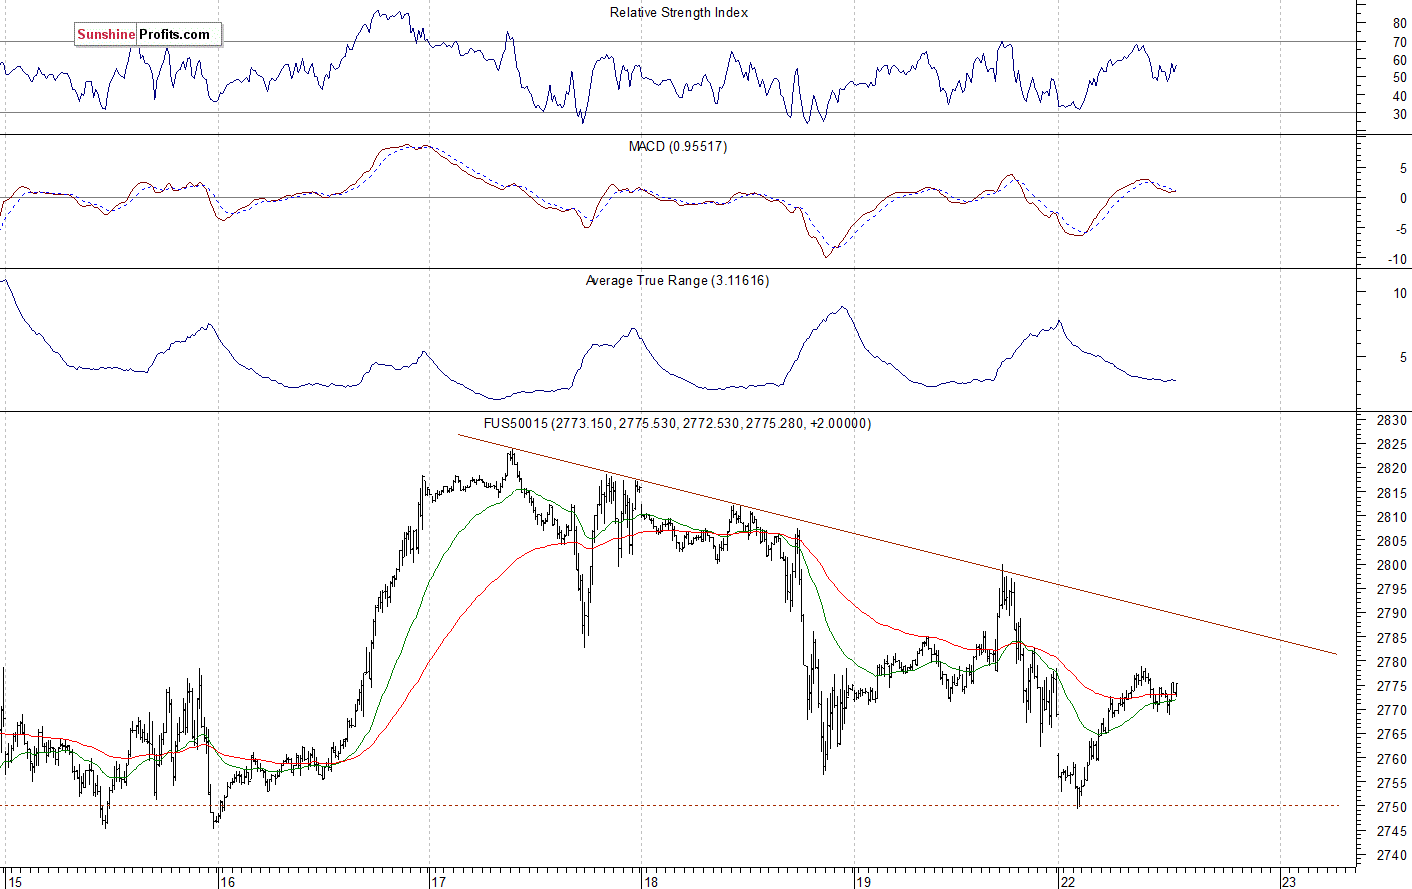
The S&P 500 futures contract trades within an intraday consolidation following an overnight advance after opening lower. The nearest important level of support is now at 2,750-2,760. The support level is also at 2,735-2,745, marked by some recent local lows. On the other hand, the resistance level is at 2,780-2,785. The next resistance level is at 2,800. The futures contract trades below its almost week-long downward trend line, as we can see on the 15-minute chart:
Nasdaq Also Higher
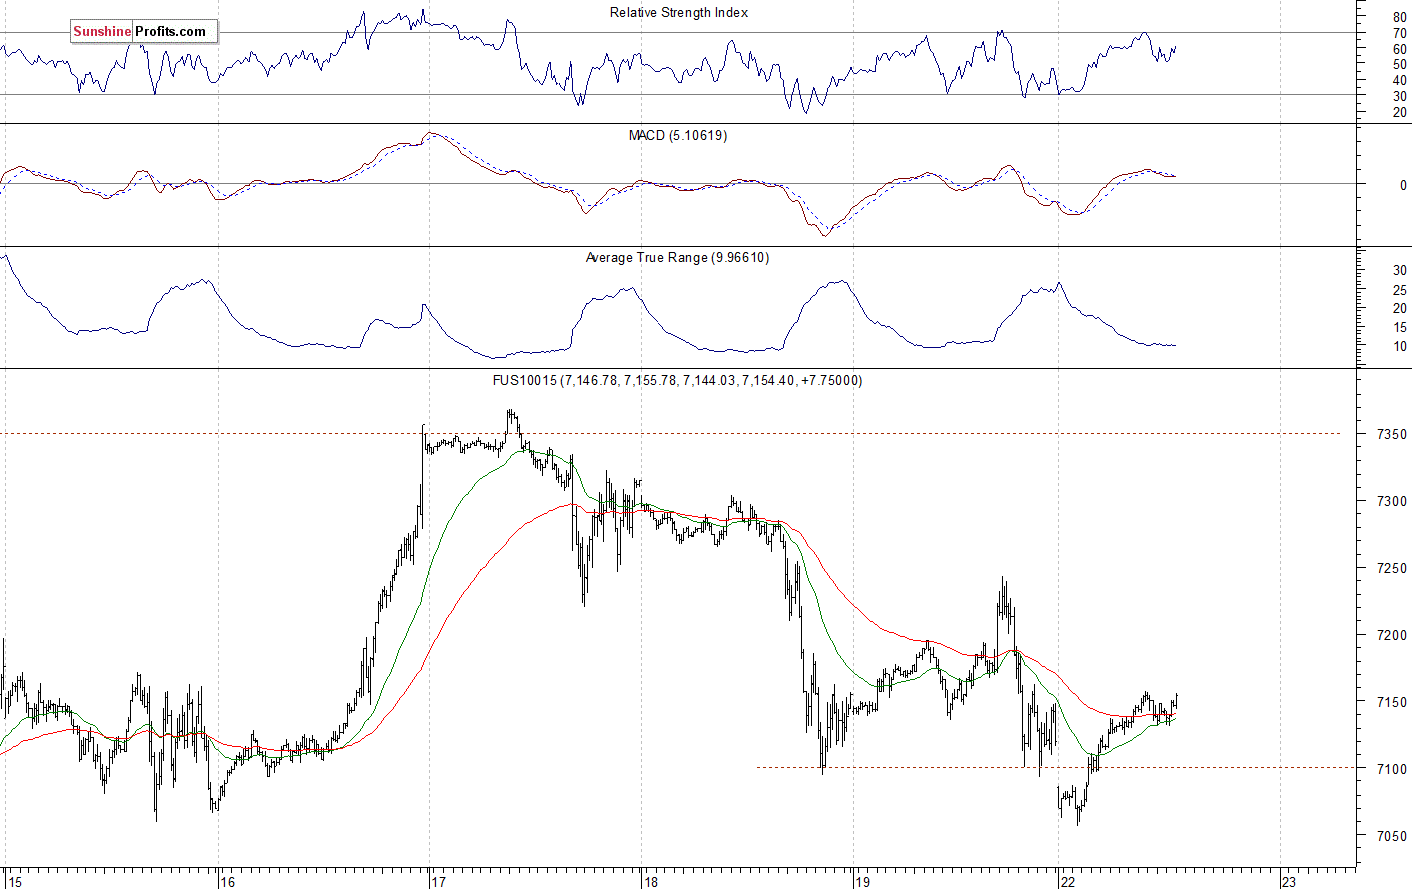
The technology Nasdaq 100 futures contract follows a similar path, as it trades within an intraday consolidation after bouncing off the support level of 7,050-7,100. The tech stocks’ gauge traded close to the level of 6,900 recently. So it fell over 800 points off its October the 1st record high above the level of 7,700. On Tuesday a week ago it bounced back above 7,350 mark. But then it fell below 7,000 again. We could see more short-term volatility. The nearest important level of resistance is now at around 7,150-7,200. The Nasdaq futures contract got back above the level of 7,100 this morning, as the 15-minute chart shows:
Apple, Amazon – Uncertainty Following Recent Decline
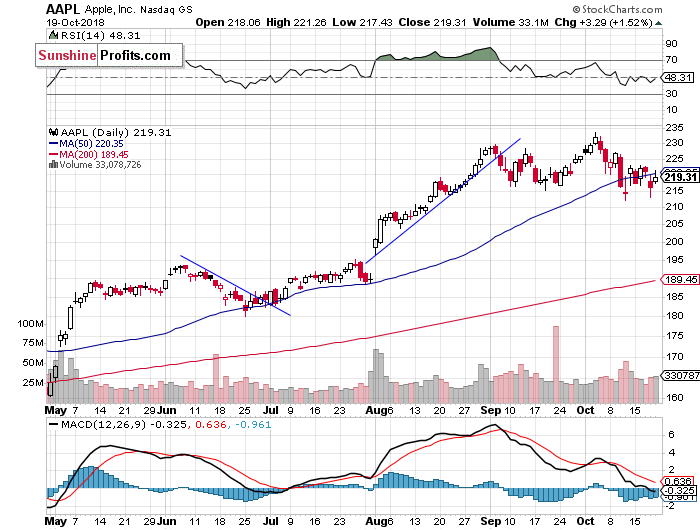
Let’s take a look at Apple, Inc. stock (AAPL) daily chart (chart courtesy of http://stockcharts.com). It reached the new record high at the level of $233.47 in the early October, as it continued to act relatively strong. Then the stock retraced its rally. Apple trades within an almost two-month-long consolidation, and the support level remains at around $215:
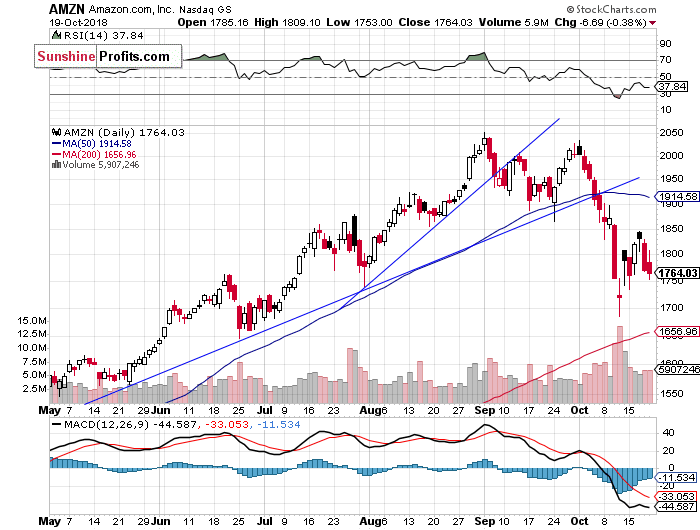
Now let’s take a look at Amazon.com, Inc. stock (AMZN) daily chart. It traded within a clear short-term downtrend following breaking down below its upward trend lines recently. Then it bounced off the support level of around $1,700. Was it an upward reversal or just a correction within an uptrend? For now it looks like a correction:
Dow Jones Going Sideways
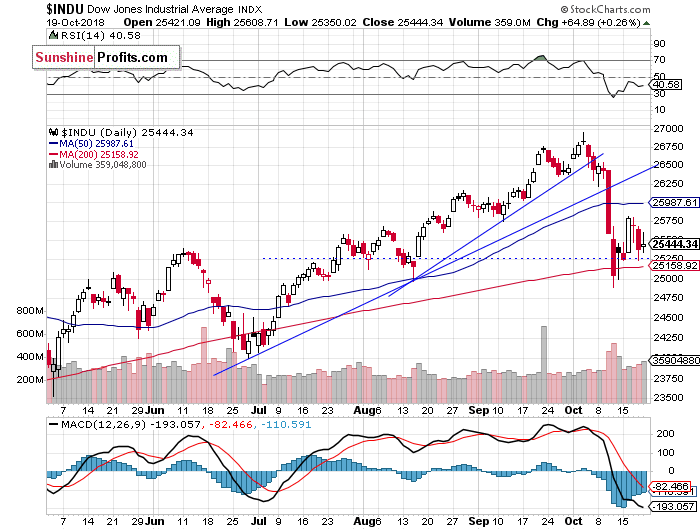
The Dow Jones Industrial Average reached its new all-time high at the level of 26,951.81 on October the 3rd. Then the blue-chip stocks’ gauge broke below its medium-term upward trend lines and the support level of around 26,000. And then it accelerated lower. On Friday a week ago the market bounced off the support level of around 25,000. The index continued upwards on last Tuesday, but then it bounced off the resistance level of 26,000:
The S&P 500 index sold off recently following breaking down below its early September local lows. The market sharply reversed its medium-term uptrend. It fell closer to 2,700 mark on Thursday more than a week ago. Since then it retraced some of the decline. Last Thursday’s trading session has brought the medium-term sell-off fears again. For now, it looks like a consolidation following the last week’s decline.
Concluding, the S&P 500 index will probably open slightly higher today. The market continues to trade within a short-term consolidation following the recent sell-off. We may see more volatility ahead of some major quarterly corporate earnings releases.
If you enjoyed the above analysis and would like to receive free follow-ups, we encourage you to sign up for our daily newsletter – it’s free and if you don’t like it, you can unsubscribe with just 2 clicks. If you sign up today, you’ll also get 7 days of free access to our premium daily Gold & Silver trading Alerts. Sign up today!
Thank you.
Paul Rejczak
Stock trading Strategist
Stock trading Alerts
Sunshine Profits – Free Stock Market Analysis


