
Image: Russellbande, Pixabay
In the last FOMC meeting, the Fed turned cautious and said it will not raise benchmark interest rate this year. In addition, balance sheet normalization will also end in September from an “auto-pilot” approach. Normally the market cheers when the Fed is taking a dovish stance as this signals a loose monetary policy. However, it does not appear to be the case this time as the market is genuinely concerned about a global downturn. Euro Zone’s Flash service PMI last week missed the expectation by a significant margin, signaling a weakening economy.
Then last Friday the yield on US 10-year Treasury notes dipped below the yield of 3-month paper. This is what’s commonly called yield curve inversion, and this is first time we’ve seen it since mid 2007. The Fed considers this as one of the most reliable recession indicators in the market. The chart below supports this view point:

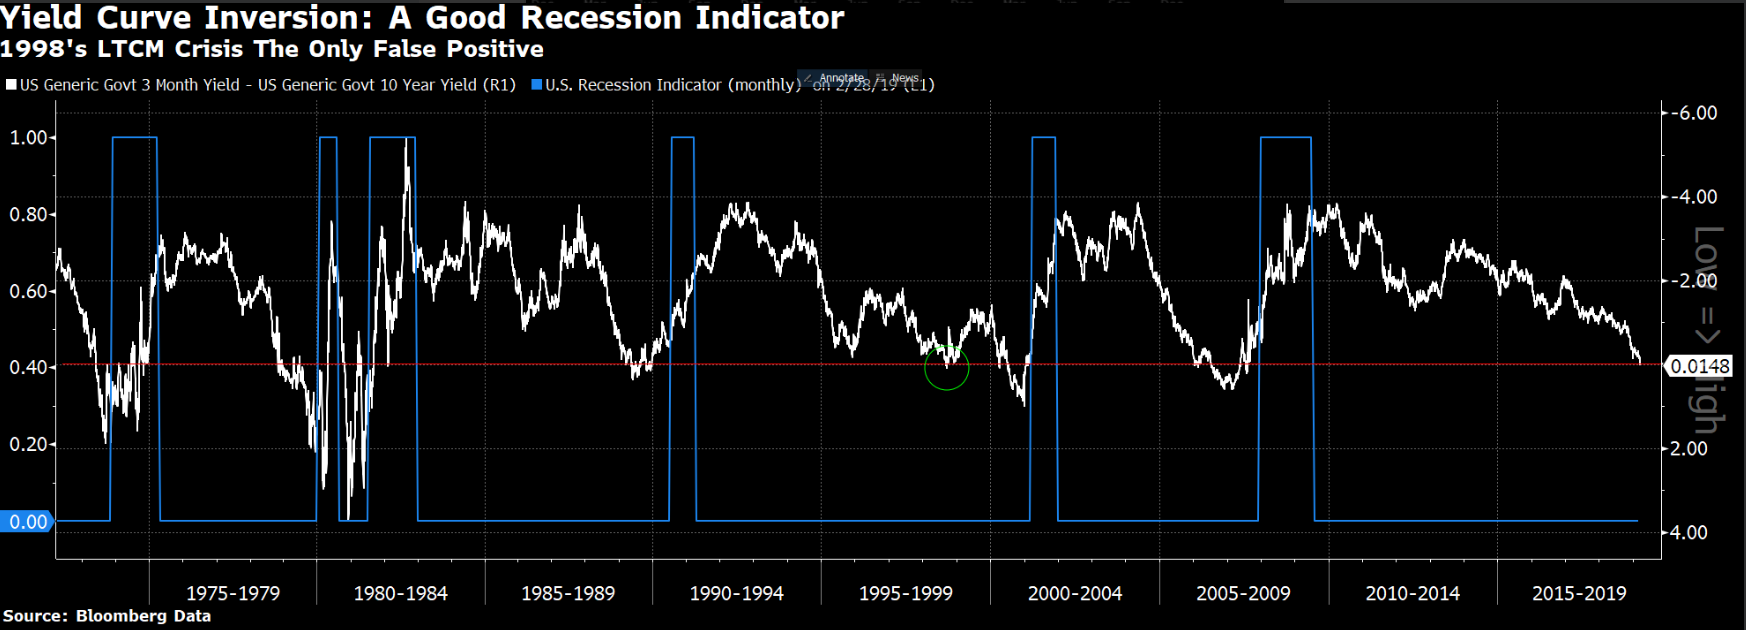
Since the post Bretton Woods era, the 3-month to 10-year yield inversion has always signaled a recession without any false negative. It’s also important to consider that the monetary tightening by the Fed last year with multiple rate hikes and balance sheet reduction typically has a 12 – 18 months lag effect. This means the full effect of the monetary tightening most likely will appear at the second half of this year. Markets came under pressure last week as S&P 500 closed -1.9% last Friday. Stronger yen also sent the Nikkei -3% lower on Monday.
This week market has somewhat recovered but if the fear of recession continues to materialize, it may provide a ceiling to the market’s rally.
DAX Weekly Chart
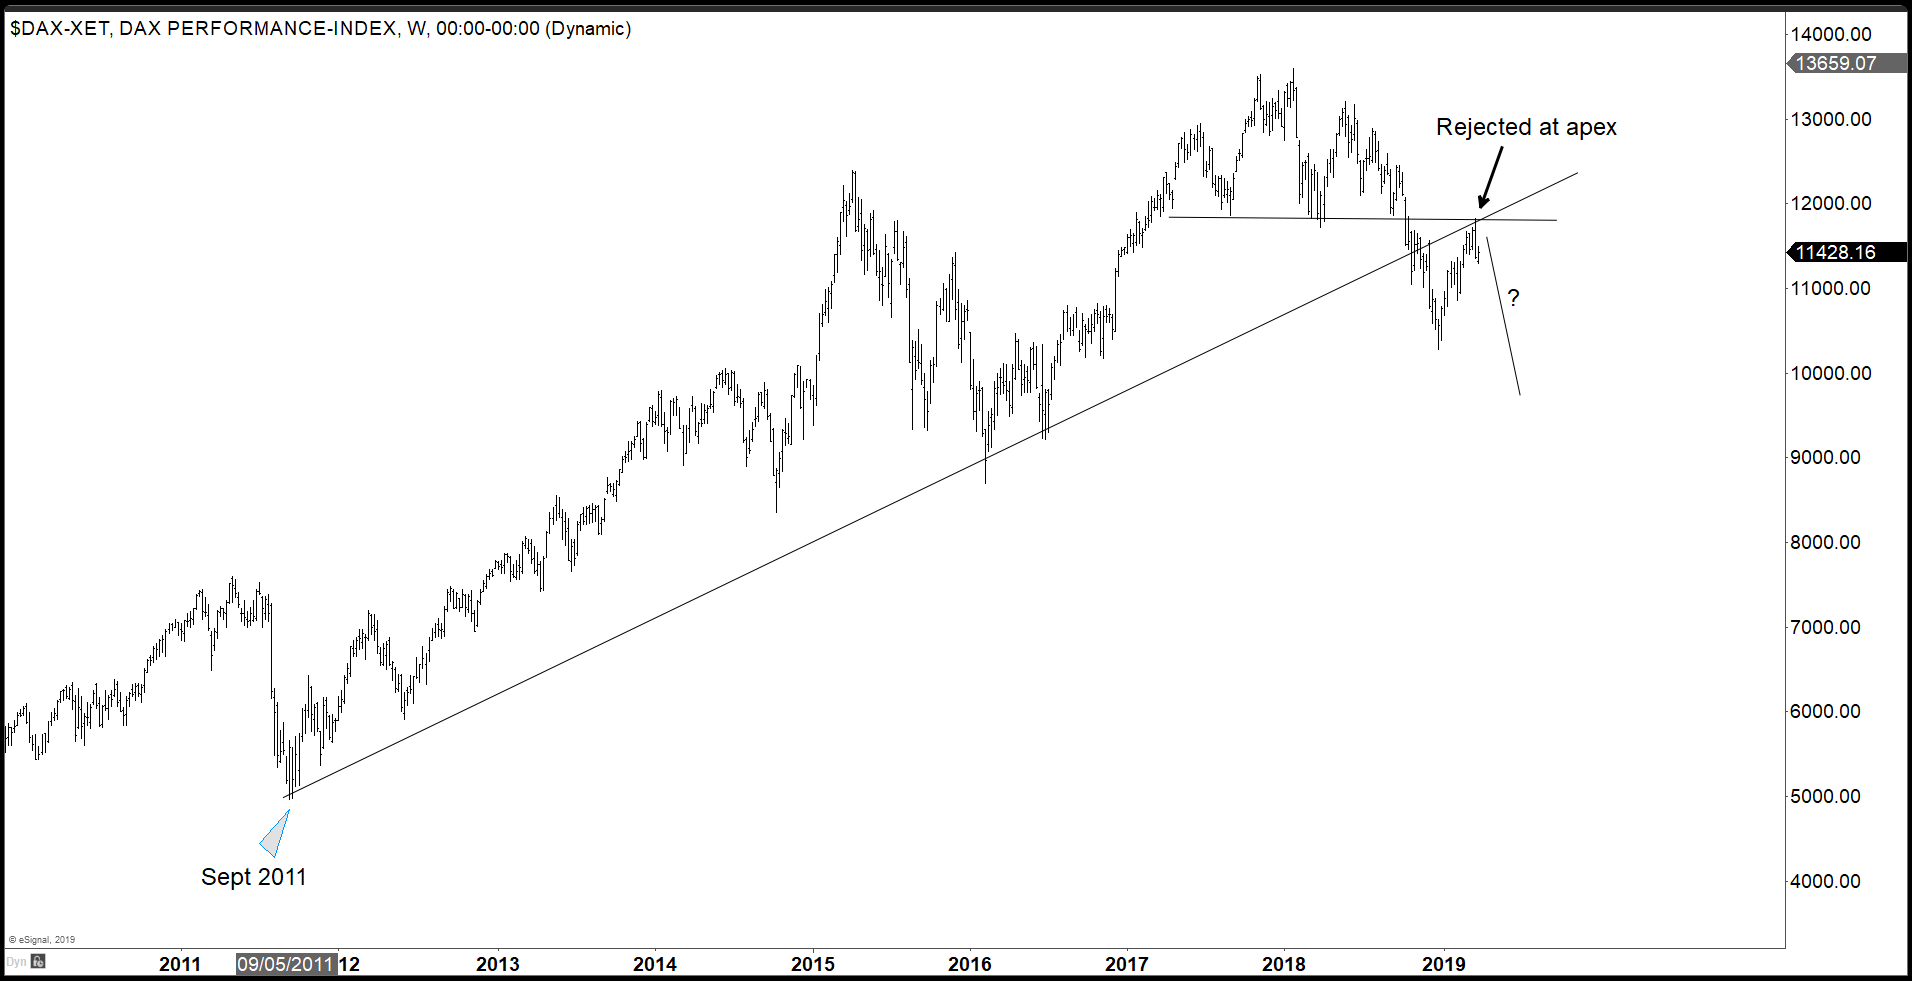
Analysis of the DAX weekly chart above shows that the Index broke below the ascending channel from its Sept 2011 low. The recovery which started at the end of last year retested the broken trend line and got rejected. There’s a possibility that the Index has started to roll over and potentially could extend lower, especially if data continues to reinforce the economic slowdown. At a minimum, the Index can see a larger 3-waves pullback to correct the 3-months-old rally. A close above the broken trend line from the September 2011 low will invalidate this bearish view.
DAX 1 Hour Elliott Wave Chart
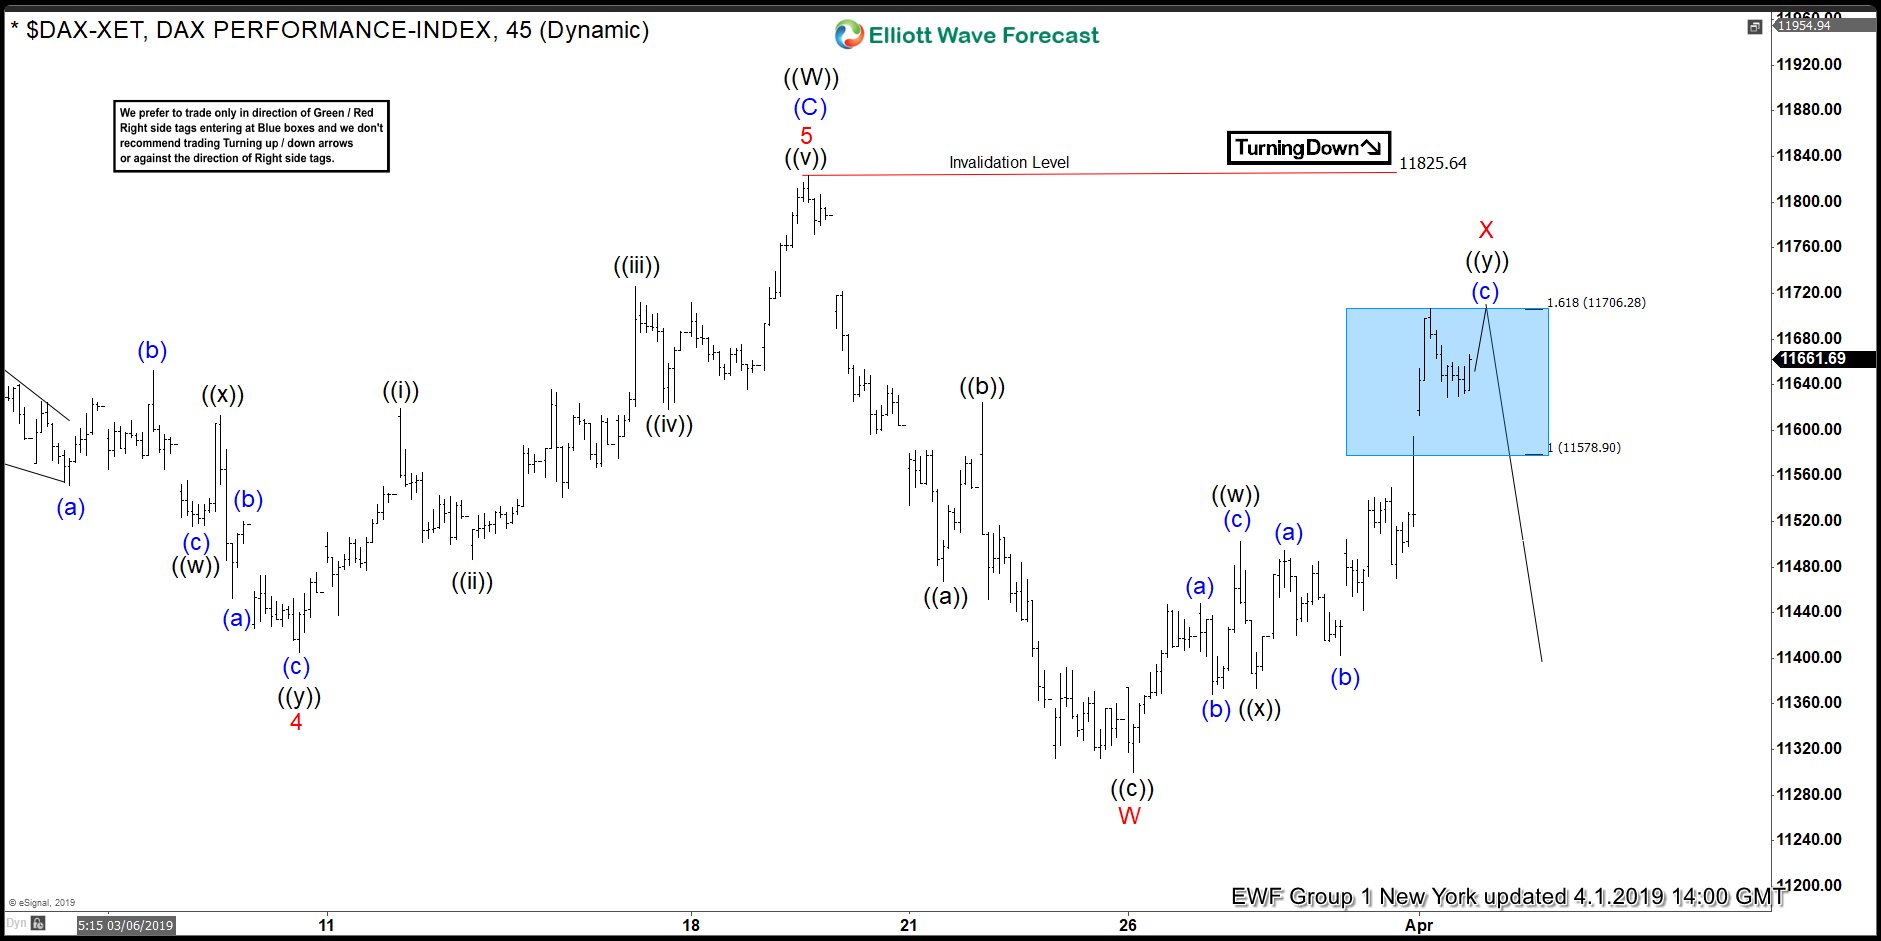
The 1 hour Elliott Wave chart for the DAX shows that the rally to 11825.64 ended wave x. This ends right around the apex as the weekly chart above shows. The index has started to roll over, and the decline from there is unfolding as a zigzag Elliott Wave structure ending wave ((w)) at 11299.80. Short term, wave ((x)) bounce is expected to fail at 11577 – 11703 for further downside as far as the pivot at 11825.64 stays intact.
Keep in mind that market is dynamic and the view may have changed since the publication of the article.


