Market optimism continues to characterize sentiment direction in 2019, and bullish stock traders have been primary beneficiaries in the run higher. Fourth-quarter earnings have been largely supportive and macroeconomic figures indicate stable prospects for continued global growth in the months ahead. There is, however, mounting evidence that some of the broader labor market data in the U.S. have not been as strong as the headlines would indicate. If these reports start to show weakness, it could make further rallies in stocks much more difficult to accomplish.
Moreover, there is a confluence of technical factors which is currently visible in the S&P 500, U.S. dollar, and spot gold price which indicates rising potential for price trend reversals. For some traders, recent rallies have diminished the impact of the broader declines which have become visible in equities over the last several months. But the fact that stock markets displayed clear weakness at the end of last year suggests continued vulnerability going forward, and this could lead to reversals in recent market trends.
The highest probability trading scenarios tend to unfold when technical events match changes in the underlying economic fundamentals visible in the financial markets. As we begin trading in 2019, it will be important to take note of these similarities because we are still holding near record highs in most of the major stock benchmarks. According to financial markets data feeds from Hammerstone Markets, the most recent non-farm payrolls out of the U.S. showed an increase of 304,000 private sector jobs for the month of January (which is one of the strongest numbers markets have seen in the last year). This figure nearly doubled the analyst expectations of 165,000, and the unemployment rate held near multi-decade lows (at 4.0%).
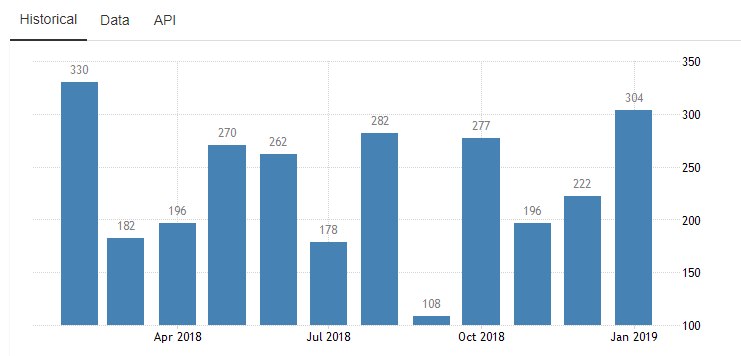
U.S. Non-Farm Payrolls Data: Trading Economics

Clearly, these are positive indicators for the broader economy and so it is not surprising that market bulls were inspired to push S&P 500 valuations higher in the following sessions. Looking deeper into the data, however, we can see that nearly have of those jobs were created in the hospitality, leisure, and education sectors (which are not typically associated with higher-than-average growth rates). Growth sectors like manufacturing, construction, and information technology were areas of weakness, and payrolls figures for the prior month were revised lower by 90,000 units. This raises the possibility that future non-farm payrolls releases in the U.S. begin to trend in the downward direction in the months ahead.
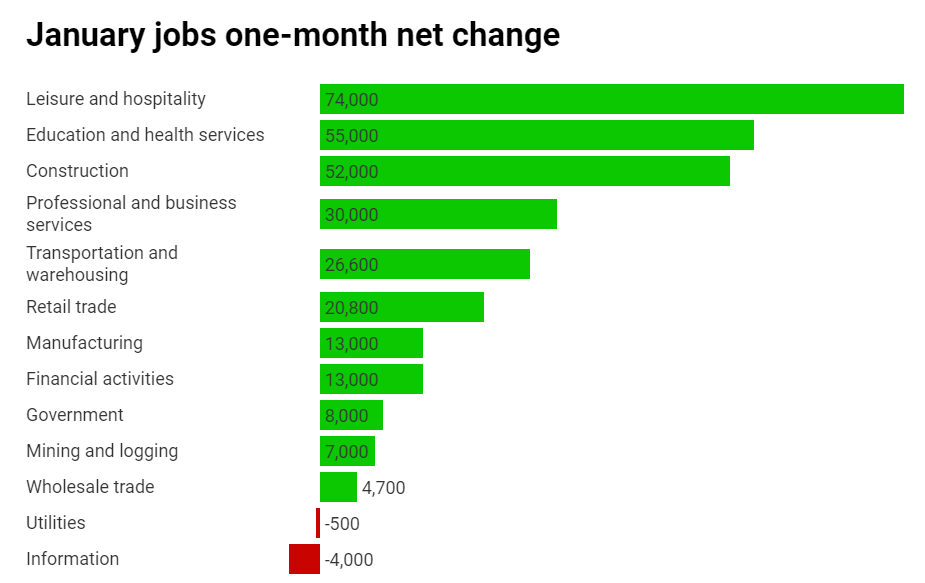
Jobs Data Chart: CNBC
Of course, none of this vulnerability has been reflected in the stock valuations of the S&P 500 so far this year. The index has surged higher after dropping like a stone near the end of 2018, and the S&P 500 has established strong support levels at 2,355.10. The S&P 500 has also moved above all of its major moving averages on the daily charts, and these events indicate clear bullish strength from a technical perspective. As a result, recent historical support has now formed at 2,613.80 and the next level of resistance can be found at 2,798.05.
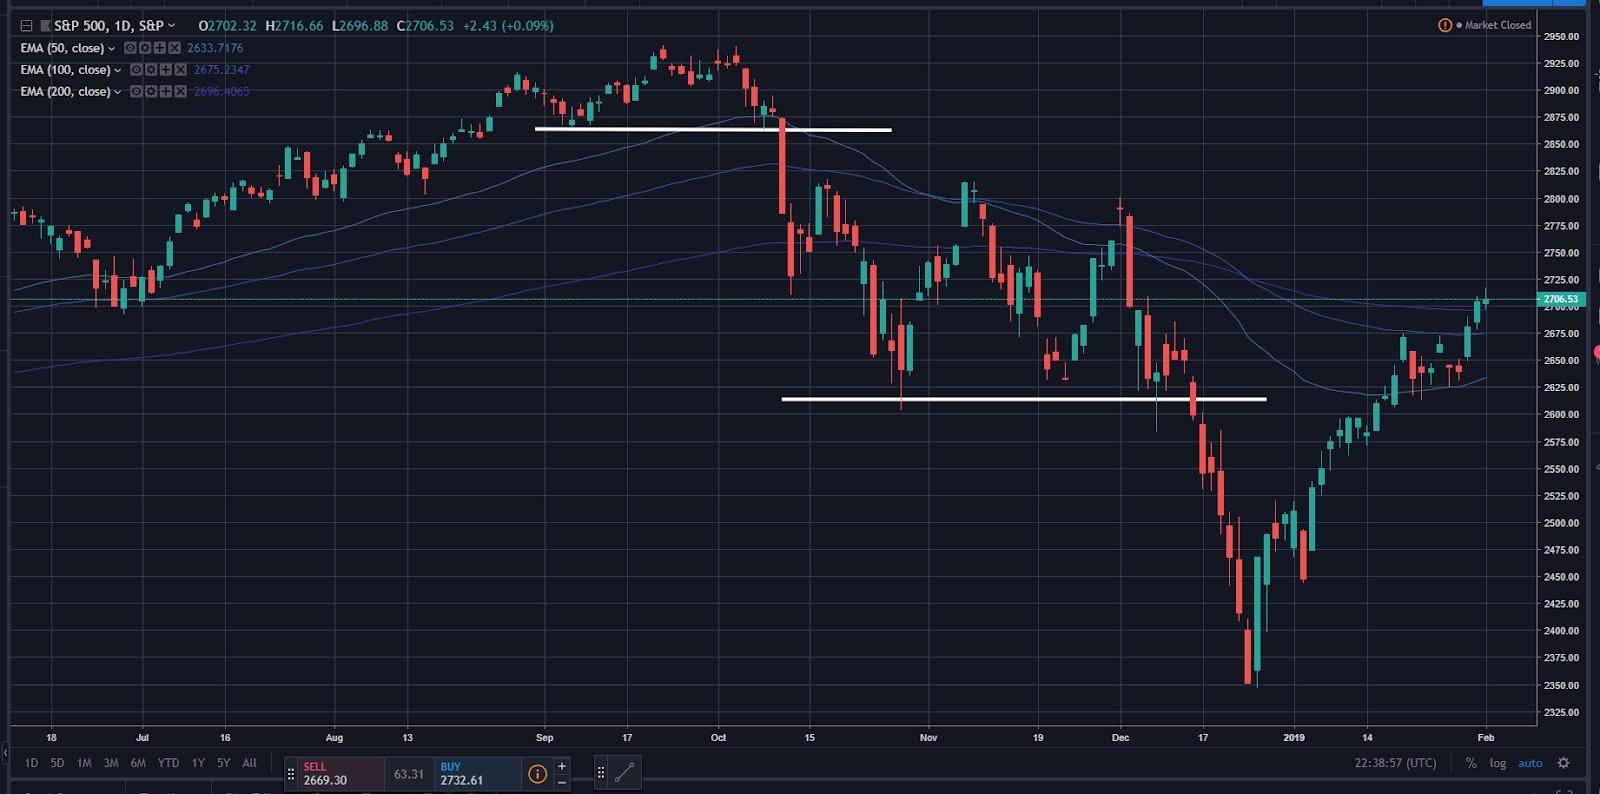
S&P 500 Chart Data: Hammerstone Markets
Different types of technical moves have been seen in the U.S. dollar, as a topping formation has become evident on the daily charts. While it is true that the greenback has developed a strong uptrend over the last several months, range-trading conditions at these upper levels (defined by resistance at 96.65 and support at 95.05).
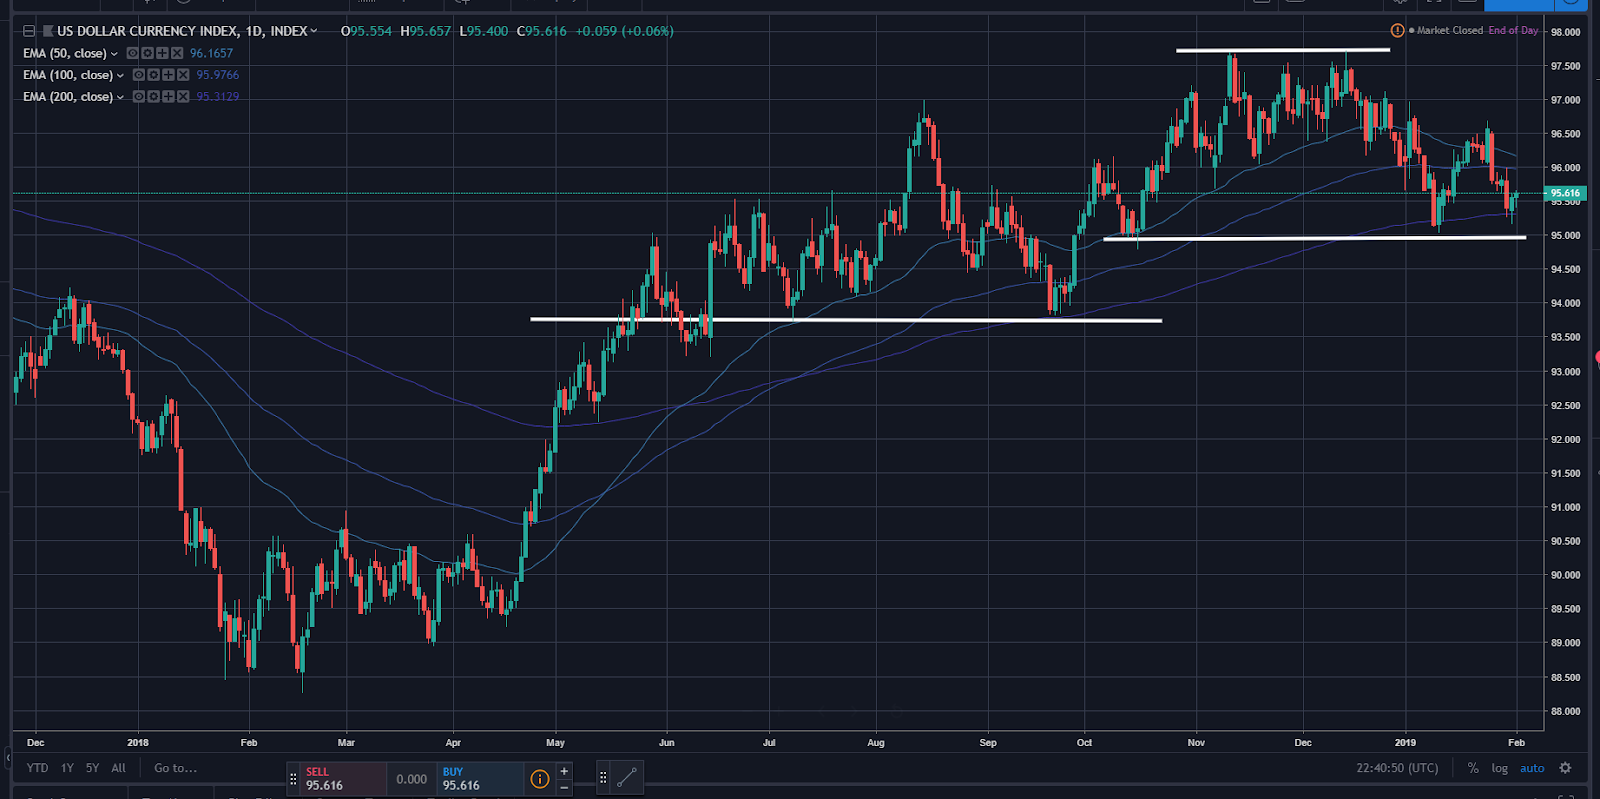
U.S. Dollar Index Chart Data: Hammerstone Markets
These types of trading ranges imply a period of indecision in the market which could turn into a bearish reversal if the fundamental data fail to support a continued move higher. A break of this upper range could accelerate losses for the currency and force another test of support at 93.80.

Graphic Source: Bloomberg
In all of this activity, one key asset to watch is the spot gold price (which could continue to benefit from increase safe-haven buying activity). In most cases, tightening interest rate policy at the Federal Reserve tends to weigh on assets like gold and silver because they are non-yielding instruments. But there is also evidence that these long-term trends could be changing, as gold as shown stable rallies since the Fed last increased its benchmark interest rate.
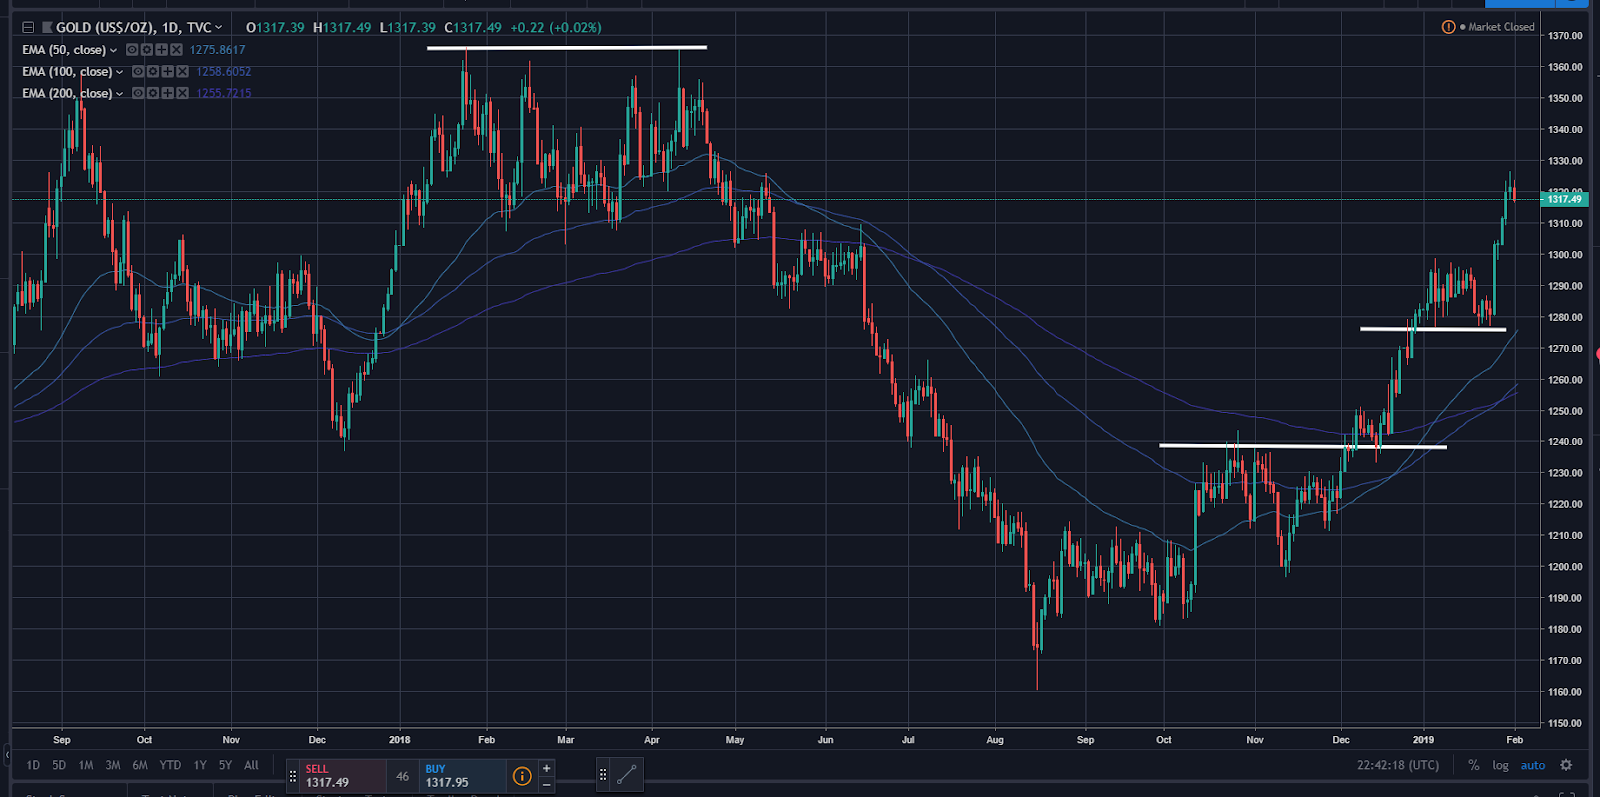
Chart Data: Hammerstone Markets
Gold prices continue to surge higher, with important price support now forming at 1,275.45. The outlook remains bullish with prices trading above these levels and we would likely need to see a downside break of 1,238.75 before negative trends would likely be able to gain much momentum. The recent moves higher place resistance levels at 1,365.55 as the next target, and negative surprises in the global economic data could turn out to be the precursor to such an event.
This stock market analysis was originally featured on MarketBulls.net as part of the daily trading commentary.


