Our Fed leaders believe keeping inflation under control is their key mission.
Fair enough. The problem is that inflation is not now a threat—yet they still feel compelled to stamp it out. Worse, they are doing so while simultaneously undoing their much-larger-than-it-should-have-been QE stimulus program.
This is a massive monetary experiment, and they have nothing more to go on than a few models, which assure them that reducing their balance sheet by $1 trillion over the next two years will have no effect on the asset markets.
Even though they told us, and most of us believe, that QE was responsible for the inflation of asset prices across the board, somehow quantitative tightening (QT) is not supposed to have the opposite effect.

The Fed’s main justification for tightening is the persistently low unemployment rate. They think it will spark wage inflation.
Maybe so, but so far we have seen only sporadic evidence of it.
Real Wages in a Downtrend
Real wages have been falling, not rising…
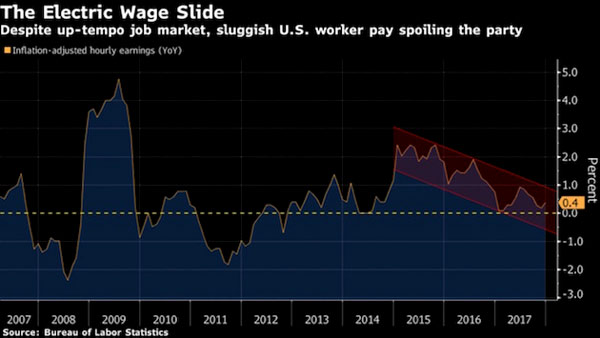
…and now I have to add, “Except for yesterday’s jobs report.”
We find that in January wages rose by 0.3%, or by 2.9% year over year. A few more reports like this and the Fed governors are going to have a real excuse to talk about wage inflation.
Two hundred thousand new jobs is a very good report, much higher than the average over the past two years. The ding on the report was that average hours fell a few tenths of a percent, so that actual wages paid did move all that much.
Was that impact weather-related? Let’s look at the February and March data and decide.
Nothing in this jobs report will discourage the Fed from raising interest rates at least three times this year, and there is reason to worry about four rate hikes. And maybe even more hikes going into 2019. Yesterday’s report certainly moved the bond market in the US, as 10-year Treasury yields went to 2.84% and the 30-year bond went to 3.09%.
TIPS are suggesting that the implied inflation rate is closing in on 2.2% for the next 10 years.
What is happening here?
Flawed Data
Despite today’s job numbers, when we look at the last two years, if the job market is so tight then why are wage gains so muted? That’s a mystery.
I think people who left the labor force and those working part-time for economic reasons amount to a sizable hidden labor supply. At some point the economy will have soaked up that supply, but we don’t seem to be there yet.
In fact, I know many that many Millennials are working two and three part-time jobs in order to make ends meet. If they could actually get a full-time job? With some benefits? They would jump on that opportunity.
Now, nothing will change in the employment picture when these workers go from being employed part-time to being employed full-time, which still just counts as “employed.”
There are now 96 million potentially employable people in America who are not in the labor force now—almost 30% of the population. That is an unusually high number for this late in a GDP growth cycle, but I expect the number would drop if opportunities develop.
Not everyone in the “not in labor force” group would turn down a job if one became available. I can’t find any real data or research on that, but it just seems like common sense to me.
A Monetary Policy Error
I can understand the Fed’s raising rates from the near-zero level to something more normal. That makes sense.
What we don’t need is to raise rates and wean the bond market off its quantitative easing bottle at the same time. Yet that is what the Fed is doing.
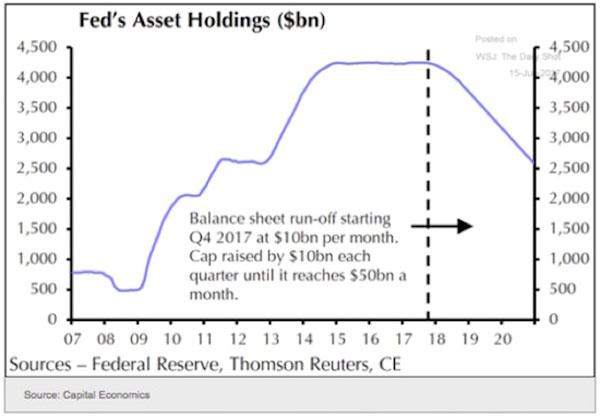
I think many investors don’t realize that the reverse of quantitative easing, what my friend Peter Boockvar calls “quantitative tightening,” is only just beginning. The chart below from Investopedia shows the projected path. Right now, we are still at the top of that big purple slide.
The Fed intends to stop buying bonds at the very time the US Treasury will issue more bonds to fund a growing budget deficit. The Treasury recently announced that net borrowing will be an estimated $441 billion this quarter and another $176 billion in the second quarter.
It was “only” $282 billion in 4Q 2017. It would not be surprising to see the US official deficit at $1 trillion, with another $500 billion in off-book debt increases. Remember, these are the numbers in relatively good economic times, at least GDP-wise.
The US debt is officially $20.6 trillion as I write this. We could be easily north of $22 trillion going into 2019 (or at least scaring $22 trillion) if the economy is supposedly still doing well.
What happens when we go into recession? We will be at $30 trillion in total debt within three to four years. Using government projections, we could easily be there, even without a recession, shortly after the middle of the next decade.
Profound Implications
When the supply of available bonds rises and demand falls, the result is lower prices, which in the bond market means higher rates. For T-bonds in particular it means higher long-term interest rates. How much higher remains to be seen.
Inflation expectations—which again, I think are misplaced—are also driving rates up. But short-term rates are rising, too, and at an even faster pace for now, so the yield curve is still flattening.
This trend has spillover effects outside the Treasuries market—in mortgages, for one. Here’s Peter Boockvar from last Wednesday:
With the highest average 30 year mortgage rate since March 2017 at 4.41% (and moving higher still), purchase applications fell 3.4% w/o/w but is still up 10% y/o/y. Refi apps were down by 2.9% w/o/w but still up 3.2% y/o/y. Maybe because long term fixed rates are now moving higher, there was a pick up in ARM’s as a % of total loans. The MBA forecasts that refinancing volumes will be about $425b in 2018 which would be the smallest amount since 2000 and that would be down by 60% from where it stood in 2016.
At some point higher rates will start cutting into housing purchases and potentially reduce the mild inflation the Fed sees. Meanwhile other central banks are beginning to plan their own policy turns. The Bank of England and the Bank of Canada are both theoretically in tightening mode already. The European Central Bank is starting to reduce its own QE program—a first step toward tightening. The Bank of Japan might do likewise at some point.
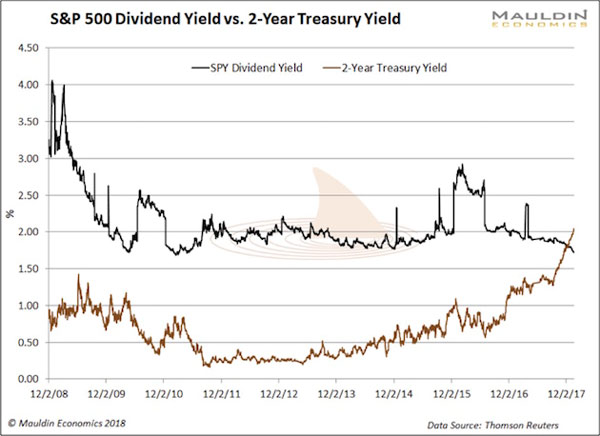
If we see global liquidity conditions tighten, the impact on stocks will turn more serious. The two-year Treasury yield recently surpassed the S&P 500 dividend yield for the first time since before the crisis.
As that gap widens, the incentive to own bonds instead of stocks grows.
Get one of the world’s most widely read investment newsletters… free
Sharp macroeconomic analysis, big market calls, and shrewd predictions are all in a week’s work for visionary thinker and acclaimed financial expert John Mauldin. Since 2001, investors have turned to his Thoughts from the Frontline to be informed about what’s really going on in the economy. Join hundreds of thousands of readers, and get it free in your inbox every week.


