KB Home: Why This Housing Stock Looks Set to Pop Right Now

Trade idea: The recent dip in KB Home (KBH
Housing sector headlines have been resoundingly gloomy of late. The National Association of Realtors (NAR) reported a surprise drop in pending home sales for January, with the index cratering to a three-year low. Declines were reported nationwide, and the report was sufficiently dismal to elicit a downward GDP estimate revision from Macroeconomic Advisers.
A number of factors are playing into the bleak home sales activity, but chief among them are rising mortgage rates and scaled-back tax incentives for buyers. The doom-and-gloom headlines have resulted in quite a bit of pessimism being priced into sector components of late, as evidenced by the steep pullbacks in a number of housing stocks from their January highs.
From a contrarian perspective, the recent dip in KB Home is particularly compelling. The stock has now pulled back to within one standard deviation of its 160-day moving average, following a long-term stint above this trendline.

According to data compiled by Schaeffer’s Senior Quantitative Analyst Rocky White, previous KBH pullbacks to this somewhat under-the-radar moving average have typically preceded healthy gains in the share price.
Getting specific, there have been six previous such 160-day pullbacks for KBH. And 21 days after a signal, KBH is trading higher 83% of the time, with an average return of 8.23%.
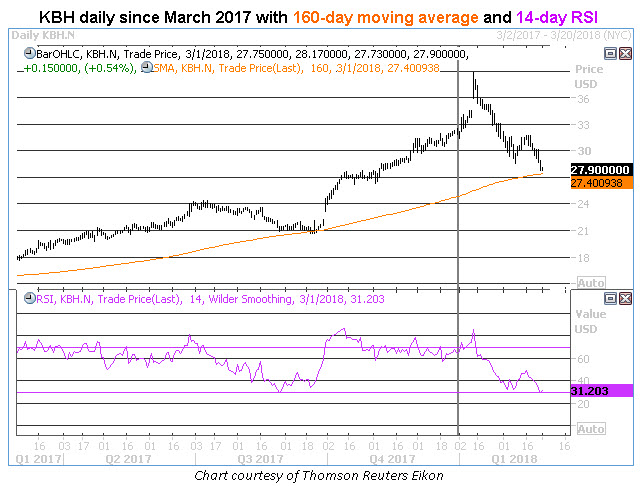
RSI at 30: Also worth noting is the fact that KBH’s 14-day Relative Strength Index (RSI) was docked at an “official” oversold reading of 30 as of the close on Wednesday, Feb. 28. A previous trip down to RSI 30 back in late August 2017 preceded a short-term basing period that lasted into late September — when KBH met up with its 160-day moving average, and then rallied from the $21 region all the way up to its Jan. 11 intraday peak of $38.80.
A review of the equity’s sentiment backdrop suggests there’s more than enough sideline cash to support an equally rapid rally this time around. For starters, short interest accounts for no less than 12.4% of the stock’s float. A short-term bounce from technical support could send these bears running for cover, resulting in a fresh influx of buying pressure for KBH.
And there’s relatively little risk of downgrades going forward, given that none of the 13 brokerage firms tracking the shares consider them worthy of a Buy rating. Instead, another show of resilience on the charts could trigger some upgrades from this crop of skeptics.
Call options would be an ideal way to leverage another imminent burst higher by KBH, which has consistently rewarded premium buyers over the past year.
The stock’s Schaeffer’s Volatility Scorecard (SVS) checks in at 93 (out of a possible 100), which means KBH options have reliably priced in lower volatility levels than what the shares have gone on to realize.
Elizabeth Harrow is director of digital content at Schaeffer’s Investment Research.
View Schaeffer’s Investment Research for stock and options ideas, options education, and market commentary here
About MoneyShow.com: Founded in 1981, MoneyShow is a privately held financial media company headquartered in Sarasota, Florida. As a global network of investing and trading education, MoneyShow presents an extensive agenda of live and online events that attract over 75,000 investors, traders and financial advisors around the world.


