In October 2017, we featured this franchisor due to its consistent profit growth, industry leading profitability, high return on invested capital (ROIC), and diversified and resilient business model. Best of all, the stock’s valuation provided significant upside.
Since then, the stock has more than doubled the performance of the S&P 500 (up 13% vs. S&P up 6%) and the fundamentals have only improved. Shares have fallen from their mid-September highs, which makes now a great time to buy this high-quality company at a discounted price. Accordingly, Winmark Corp (WIN) is this week’s Long Idea.
WINA’s Profit Growth Continues On
From 2007-2017, WINA’s revenue grew 8% compounded annually while its after-tax profit (NOPAT) grew 21% compounded annually. Over the trailing twelve months (TTM), revenue has grown an additional 6% over the prior TTM period while NOPAT has grown 9% over the prior TTM period. Over the long-term, WINA has grown NOPAT by 13% compounded annually since 1996.
Figure 1: WINA Profit Growth Over Past Decade

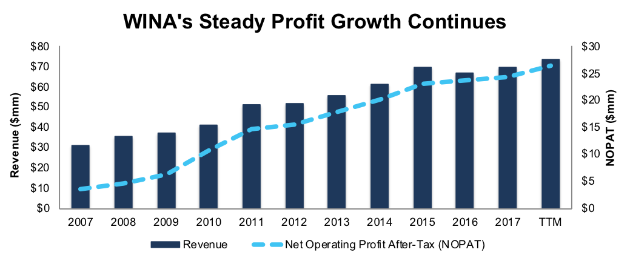
Image Source: New Constructs, LLC
Sources: New Constructs, LLC and company filings
WINA has improved its profitability through margin expansion and intelligent capital allocation. NOPAT margins have improved from 11% in 2007 to 36% TTM. At the same time, average invested capital turns, a measure of balance sheet efficiency, have increased from 0.7 in 2007 to 1.3 TTM.
Rising margins and efficient capital use have improved WINA’s ROIC from 8% in 2007 to a top-quintile 48% TTM, per Figure 2. The company has a long-term track record of profitability, as it has earned a double digit ROIC in nine of the past 10 years and 18 of the past 22 (since 1996).
Figure 2: WINA’s ROIC Improvement Over the Past Decade
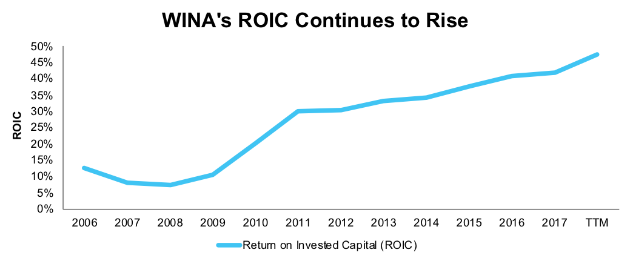
Image Source: New Constructs, LLC
Sources: New Constructs, LLC and company filings
Improving ROIC Correlated with Creating Shareholder Value
Numerous case studies show that getting ROIC right[1] is an important part of making smart investments. Ernst & Young recently published a white paper that proves the material superiority of our forensic accounting research and measure of ROIC. The technology that enables this research is featured by Harvard Business School.
Per Figure 3, ROIC explains 59% of the difference in valuation for the 108 Retail peers under coverage with positive ROIC’s. Despite WINA’s 48% ROIC, which is well above the 9% average of the peer group, the firm’s stock trades at a slight discount to peers as shown by its position below the trend line in Figure 3. If the stock were to trade at parity with its peers, it would be $164/share – 9% above the current stock price. Given the firm’s rising ROIC and consistent profit growth, one would think the stock would garner a premium valuation.
Figure 3: ROIC Explains 59% Of Valuation for Retailing Stocks
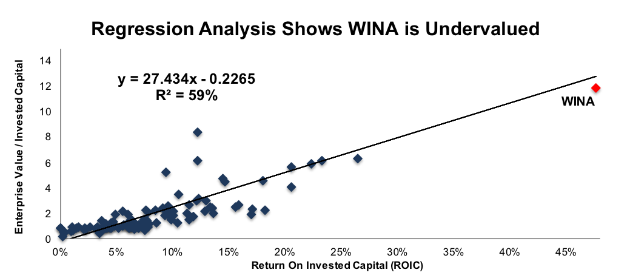
Image Source: New Constructs, LLC
Sources: New Constructs, LLC and company filings
WINA’s Leading Margins Continue to Rise
As noted in our original Long Idea, Winmark faces competition from numerous firms as it operates in multiple different segments of the retail industry, such as sporting goods, children’s apparel, teen apparel and women’s apparel. Competitors include The Buckle, Inc. (BKE), The Gap (GPS), Childrens Place (PLCE), Chico’s FAS (CHS), Dick’s Sporting Goods (DKS), and Abercrombie & Fitch (ANF). In addition, WINA faces competition from less specialized retailers such as Ross Stores (ROST), Amazon (AMZN) and Wal-Mart (WMT).
Together, Winmark’s five brands generated over $1 billion in sales last year, of which Winmark receives anywhere from 3-5% in royalty payments. This asset-light business model requires little capital expenditure, outside of marketing and support of franchisees, and leaves WINA with significantly higher margins than a standard retail firm. Per Figure 4, WINA’s NOPAT margin has continually risen over the past five years despite peers’ heading in the opposite direction.
Furthermore, WINA’s ability to continually improve its margins even in a difficult retail environment represents a strong competitive advantage. Winmark is less focused on traditional retail worries such as the latest fashion trends and more focused on finding profitable store locations and maximizing the efficiency of each franchisee.
Figure 4: Winmark’s Profitability Significantly Higher Than Peers
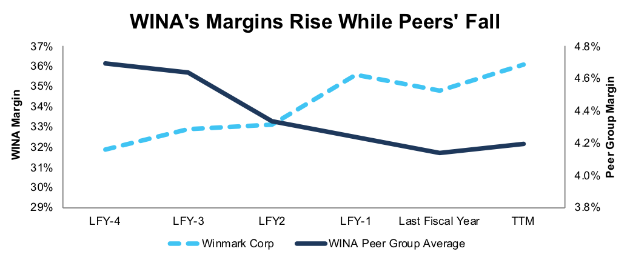
Image Source: New Constructs, LLC
Sources: New Constructs, LLC and company filings.
Bears Continue to Ignore Profitable Industries and Strength of Franchise Business Model
As noted in our original report, WINA has been able to break the trend of weak sales in its apparel markets while avoiding the pitfalls of large store footprints and their equally large overhead. The business’ high margins and ROIC proves management’s ability to only invest in best of breed brands and opportunities while ignoring low return locations or store concepts.
In the year since our Long Idea, sales at WINA franchises have continued to increase. Per Figure 5, total franchise sales grew 3% year-over-year in 2017. Once Upon a Child and Plato’s Closet – the two largest store brands – grew sales at this same 3% rate, but some of the smaller, newer store concepts are growing much faster. Music Go Round sales grew 6% YoY, while Style Encore sales bested all concepts and grew 32% YoY.
Figure 5: Winmark’s Franchise Sales Growth Continues to Rise
Image Source: New Constructs, LLC
Sources: New Constructs, LLC and company filings.
Over the past decade, total franchise sales have grown 7% compounded annually. Plato’s Closet sales have grown 14% compounded annually and Once Upon a Child sales have grown 10% compounded annually. Style Encore has seen sales grow 210% compounded annually since opening in 2013, and its total sales have now surpassed Music Go Round.
A key point from our original Long Idea noted that this sales growth was the continuation of a long-term trend, and that trend has continued. Plato’s Closet and Once Upon a Child sales have now grown YoY in each of the last 11 years, while Music Go Round and Style Encore have seen sales increase YoY the last four and five years respectively. The success of these brands has more than made up for the declining sales at Play It Again Sports.
Strong sales growth drives high rates of renewal by franchisees, which guarantees steady long-term cash flows. Franchisees sign 10-year agreements, and the average franchise renewal rate is 98% over the past decade and was 100% for 2018 through September 29.
Beyond the strong fundamental performance, WINA’s current valuation ignores years of profit growth and still undervalues its business. More details are below.
Recent Pullback Creates “Buy the Dip” Opportunity
Despite WINA outperforming the market since our Long Idea in October 2017, the stock is down 13% since mid-September, with no deterioration in the fundamentals of the business. This price decline sets up a great opportunity to buy WINA at a discounted price. WINA remains cheap, even though traditional metrics would show otherwise. At its current price of $151/share, WINA has a P/E ratio of 21, which is slightly above the Consumer Cyclicals sector average of 20.
When we analyze the cash flow expectations baked into the stock price though, we find that WINA is undervalued. At its current price of $151/share, WINA has a price-to-economic book value (PEBV) ratio of 1.2. This ratio means the market expects WINA’s NOPAT to grow no more than 20% from current levels over the remaining life of the corporation.
This expectation seems rather pessimistic given that WINA has grown NOPAT by 21% compounded annually over the past decade and 13% compounded annually since 1996.
If WINA can simply maintain TTM pre-tax margins (58%), benefit from a lowered tax rate, and grow NOPAT by just 6% compounded annually for the next decade, the stock is worth $207/share today – a 37% upside. See the math behind this dynamic DCF scenario.
What Noise Traders Miss with WINA
In general, markets aren’t good at identifying quality capital allocation that creates value and shareholder friendly corporate governance. Instead, due to the proliferation of noise traders, markets are great at amplifying volatility, and therefore risk, in popular momentum stocks, while high-quality fundamental research is overlooked. Here’s a quick summary for noise traders when analyzing WINA:
- Impressive balance sheet improvements and capital efficiencies enhance cash flows.
- Undervalued stock price – WINA’s P/E ratio looks high relative to its sector, but as we know, P/E ratios are not a good measure of value.
Continued Sales and Profit Growth Should Boost Shares
As noted in our original report, there is no analyst coverage on WINA, and therefore no set consensus expectations. Therefore, earnings beats are unlikely to move the stock. Instead, a continued long-term uptrend in sales and profits should continue to drive shares much as it has in the past.
Macro trends continue to bode well for future growth. In August, the National Retail Federation raised its retail sales outlook for 2018, expecting sales to grow at least 4.5%, well above the 3.8% previously forecasted. The NRF noted that low unemployment and high industrial production were helping U.S. consumer sentiment rise to multi-decade highs. Going forward, eMarketer projects retail sales to grow 5.8% and 5.5% in 2019 and 2020 respectively. Winmark’s franchise sales have traditionally grown at a higher pace than the overall retail market and should provide the boost to send shares higher.
Regardless of the catalyst, this stock offers low valuation risk, a small yield (that could be much higher) and significant upside potential.
Share Repurchases Plus Dividends Could Provide Upwards of 15% Yield
Winmark Corp has increased its dividend in each of the past seven years. It’s annualized dividend has grown from $0.19/share in 2013 to $0.43/share in 2017, or 23% compounded annually. The current dividend provides a 0.4% yield.
In addition to dividends, Winmark Corp returns capital to shareholders through share repurchases. Under standard repurchase authorizations, WINA repurchased no stock in 2017 and $1.6 million in 2016. However, the company repurchases significant shares through tender offers instead. Through these tender offers, WINA repurchased $49.9 million (8% of market cap) in 2017 and $74.3 million (13% of market cap) in 2015. Through the first nine months of 2018, WINA has repurchased $558 thousand worth of shares and is authorized to repurchase up to 139 thousand shares, which at current prices would equal $21 million.
If WINA repurchases shares in line with average in recent years, it would equate to less than 1% of its market cap. However, should management initiate another tender offer, shareholders could see significantly higher (upwards of 13%) repurchase yields.
Executive Compensation Plan Still Raises No Alarms
WINA’s executive compensation plan, which includes base salary, annual incentives, and long-term incentives, is structured around group achievement, rather than individual performance. The compensation committee bases bonuses and incentive compensation on long-term goals such as cash flow, earnings per share, and human resources management. However, final decisions remain largely subjective, as the committee notes it does not tie any elements of compensation to the attainment of one specific goal but rather views all factors in totality when awarding compensation. Annual incentives are limited to no greater than 100% of an executive’s salary and equity-based compensation is awarded via stock options that vest over time.
We would prefer to see executive compensation more clearly measured, and specifically tied to ROIC, since there is a strong correlation between improving ROIC and increasing shareholder value. However, WINA’s current exec comp plan has not led to executives getting paid while destroying shareholder value. In fact, quite the opposite is true for WINA. Economic earnings, the true cash flows of the business, have grown from $1 million in 2006 to $23 million TTM, up from $22 million in our original Long Idea.
Insider Trading and Short Interest Trends
There is little insight to be gained from recent insider trading trends, as they have been minimal. Over the past 12 months, 58 thousand shares have been sold and no shares have been purchased. These sales represent just 1% of shares outstanding.
Short interest trends are more insightful. There are currently 26 thousand shares sold short, which equates to less than 1% of shares outstanding and six days to cover. Short interest has fallen 47%, from 49 thousand shares at the end of December 2017, as WINA’s business model has continually proven its fundamental strength.
Critical Details Found in Financial Filings by Our Robo-Analyst Technology
As investors focus more on fundamental research, research automation technology is needed to analyze all the critical financial details in financial filings. Below are specifics on the adjustments we make based on Robo-Analyst[2] findings in Winmark Corp’s fiscal 2017 10-K:
Income Statement: we made $5 million of adjustments, with a net effect of removing $1 million in non-operating income (1% of revenue). We removed $3 million in non-operating income and $2 million in non-operating expenses. You can see all the adjustments made to WINA’s income statement here.
Balance Sheet: we made $19 million of adjustments to calculate invested capital with a net increase of $19 million. The most notable adjustment was $13 million in asset write-downs. This adjustment represented 33% of reported net assets. You can see all the adjustments made to WINA’s balance sheet here.
Valuation: we made $79 million of adjustments with a net effect of decreasing shareholder value by $79 million. There were no adjustments that increased shareholder value. Apart from $50 million in total debt, which includes $1 million in off-balance sheet operating leases, the largest adjustment was $28 million in outstanding employee stock options. This option adjustment represents 5% of WINA’s market cap. Despite the net decrease in shareholder value, WINA remains undervalued.
Attractive Funds That Hold WINA
The following funds receive our Attractive-or-better rating and allocate significantly to WINA.
- Virtus KAR Small-Mid Cap Core Fund (VKSRX) – 2.3% allocation and Very Attractive rating.
This article originally published on October 24, 2018.
Disclosure: David Trainer, Kyle Guske II, and Sam McBride receive no compensation to write about any specific stock, style, or theme.
Follow us on Twitter, Facebook, LinkedIn, and StockTwits for real-time alerts on all our research..
[1] Ernst & Young’s recent white paper “Getting ROIC Right” proves the superiority of our holdings research and analytics.
[2] Harvard Business School features the powerful impact of our research automation technology in the case New Constructs: Disrupting Fundamental Analysis with Robo-Analysts.


